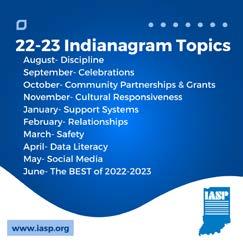


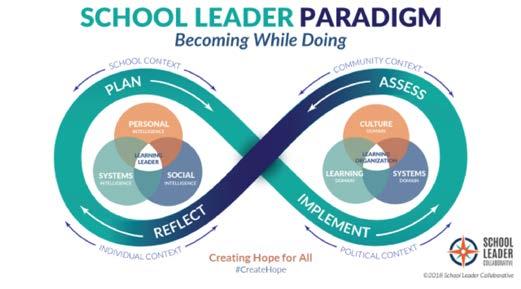
IASP has been in collaboration with several other state associations to create the School Leader Paradigm. It challenges school leaders to think of themselves not just as instructional leaders but even more so as “learning leaders leading learning organizations.” A key word in this definition is “learning.” Learning implies reflection and action based upon information. For school leaders, data is an important source to drive action. When school leaders are empowered to lead a culture of data use, students do better. For this to happen, leaders need to model and support effective data use.
Once obtaining the data, leaders have to decide how to process it, and I have often struggled in how to facilitate that conversation. Our school district modeled a protocol that helped structure a conversation about our school level data. The ORID protocol facilitates a learning conversation around data and shapes how people converse with one another about it. Participants progress through sequential levels of inquiry towards informed decision making. It can be used in small groups or a large group with small breakouts.
ORID is an acronym representing the following steps, their descriptions, and example questions:
O – Objective: examine the data and draw out factual information
- What factual statements can you make based on the data? What do you see?
R – Reflective: evoke personal reactions and encourage participants to make connections and the free flow of ideas and imagination
- When seeing the data, what surprised you? Encouraged you? Discouraged you?
I – Interpretive: identify patterns, determine their significance, and articulate underlying insights
- What areas of need seem to arise?
- What other information might we need to know?
D – Decision: propose next steps and develop an action plan to bring conversation to closure and resolution
- What decisions can we make?
- What is our action plan moving forward?
When using this protocol, I have found several benefits. By its structure, ORID provides a focused, thought process that is efficient and prevents drifting. It allows for honest, authentic dialogue where all voices are valued. The protocol is also easy to follow and can be used effectively by any person regardless of position. Lastly, ORID can be used to discuss not only school data but also incidents that require processing by school personnel.
Data literacy is a critical skill for school leaders to improve overall school quality and ensure success for all students. Using a protocol, like ORID, helps school leaders, teachers, and other stakeholders make sense of data through a logical and disciplined approach while also valuing all voices. That conversation can then lead to a plan detailing strategies, timelines, and monitoring for continuous improvement.
Only 4 to 5 weeks remain until the end of another school year, and those are typically accompanied by a whirlwind of activity. I recently found a quote from Walter Elliott that may help shape our mindset: “Perseverance is not a long race; it is many short races one after another.” Although the weeks ahead may seem daunting, consider taking small steps - day-by-day, week-by-week. Prepare and focus for one and finish it well before getting to the next, yet never forgetting about the final destination. So, let’s encourage and support each other and even reach out to IASP, too! Together, the journey to wrap up this year will be easier and with an even greater possibility of success.
References:
Illinois Principals Association, et al. School Leader Collaborative: School Leader Paradigm. 2022.
“ORID Focused Conversation Data Analysis.” Learning Forward. lfp.learningforward.org/handouts/Dallas2018/8473/ORID%20Protocol.pdf. 2018.
Matt Shockley IASP President
In our information age and digital world reality, data is readily available for our consumption. A challenge, however, is that the volume of data can easily overwhelm us and even cause analysis paralysis. Those that know me well also know my affinity for a color-coded spreadsheet that hopefully helps to simplify the information into manageable chunks that can lead to data driven decisions. As I read through the articles in this issue of the Indianagram, I’m struck by all the ways in which our school leaders are taking my simplistic spreadsheet and creating ways for educators to come together and work on both student achievement and the school environment. Below I’ve noted key phrases that I hope you will seek out as you read the articles, and perhaps add to my list those that you find important as well.
” Using a protocol, like ORID, helps school leaders, teachers, and other stakeholders make sense of data through a logical and disciplined approach while also valuing all voices.”
” As we’ve started these observations, we’ve been diligent about holding feedback sessions with caring accountability and constructive persuasion.”
“Data should lead to more questions, not simply provide answers” and “Data only matters if it is collected with the intention of behavior affirmation or change.”
““Data is not about adding more to your plate. Data is about making sure that you have the right things on your plate” (Loud, nd).”
As our General Assembly moves into the final weeks of the 2023 session, much has been discussed over how school leaders work with teachers, and to me, this Indianagram neatly condenses what we have told legislators. Our Principals and Assistant Principals know that building a positive school culture that values all teachers will also build and sustain the school climate where educators and students can thrive. While data can be a lot of facts, charts, and even spreadsheets, it is your use of this information and the processes you enable that will help you recruit and retain our educators. This investment will pay dividends as students experience instruction and guidance focused on their success.
Dr. Todd D. Bess IASP Executive Director
Matt Shockley President

Dr. Crystal Murff Thorpe President-Elect
Dr. Holly Arnold Vice President
Aimee Lunsford
Past President
Amy Niemeier
NAESP State Representative
Dave Strouse NASSP State Coordinator
Steve Baker
Liaison to the DOE
Dr. Daniel Peo Assistant Principal Liaison
IASP hosts events throughout the year to support the growth and development of Indiana school administrators and students. Each event is intentionally designed to encourage and engage all participants in the pursuit of learning!
Find A Full List Of Events at www.iasp.org/Events
 Dr. John Keller Chief Information Officer Indiana Department of Education
A note from Dr. Katie Jenner, Indiana Secretary of Education: For this article on data literacy, I’ve asked Dr. John Keller, our chief information officer at IDOE, to talk about the importance of utilizing data to drive policy and improve student outcomes. As you know, Dr. Keller is our resident data guru and is often the brains behind our team’s work to strengthen systems and provide improved information regarding K-12 educational programs and results. This work requires all of us working together, at the state and local level, to streamline processes and ensure our data is working for us… not the other way around. Thank you for the important role you play in ensuring our data is as complete, accurate, and meaningful as possible!
Data lives all around us - whether consciously or unconsciously, each of us is part of a data ecosystem which uses information to accomplish a purpose. This data ecosystem translates to more effective marketing, better roads, faster service, higher satisfaction, and the list continues to grow exponentially each day.
As school building leaders, you are all keenly aware that the education enterprise exists well within this data ecosystem, and schools are the epicenter of data creation, collection, and reporting. You and your team are key contributors of data and share responsibility for how that data is used to communicate results. Maybe you’ve not thought about it that way before, so let me share some insights about the importance of your work from my vantage point as the CIO for the Indiana Department of Education.
Given your role, I’m sure you’re aware that IDOE collects a significant amount of data from schools, and we do so for two primary reasons – to direct the flow of funding and to support reporting about the results of this public spending. Over the years, the amount and frequency of data collected
has risen steadily until we arrived at a point where it was simply impossible to keep up using the systems we had. The challenges posed by our brittle systems at the time presented an opportunity to explore new ways of providing additional support to our schools.
We rolled out the Data Exchange platform during the 2019-2020 school year, allowing us to be innovative and to further streamline data to know exactly when your school secretary enrolls a student at 8:45 a.m. on a Tuesday and when the attendance is taken in your eighth grade Music Appreciation class. This one-touch data collection allows you and your team to focus on efficient school operations and student learning, and not on the tedium of preparing data to be submitted for a future reporting window. This migration to more streamlined solutions is a key priority for IDOE and directly translates to some of our additional initiatives.
You are all also familiar with the ongoing work surrounding the development of the Indiana Graduates Prepared to Succeed (Indiana GPS) school performance dashboard, an incredible tool we launched in late 2022 (a year and a half ahead of schedule!) for schools to use to communicate a wide range of results to a variety of stakeholders. The Indiana GPS
dashboard provides communities a direct look into each school’s data when it comes to third grade reading proficiency, higher education enrollment, graduation pathways completion, 21st Century Scholar enrollment, and so much more.
The data underpinning the Indiana GPS dashboard all begins with your school - emphasizing the importance of accurately enrolling students with names correctly spelled and complete demographic information, scheduling a student’s classes, and reporting their attendance, as this data all feeds into platforms such as Indiana GPS or into
reports determining school funding levels. The high-quality data you and your team gather each day is essential for improving our education systems, helping communities align resources and supports, and for doing the best we can to prepare students for today and tomorrow.
As we work to improve our processes and support in the realm of data collection and reporting, we are continuously looking for additional opportunities to alleviate this burden for schools and eliminate duplicative data collection. This also gives us a clear directive to ensure we are maximizing the uses of the data we’re collecting.
One example is the streamlining of data sharing with the Indiana Family and Social Services Administration (FSSA) in their work to administer the Pandemic Electronic Benefits Transfer (P-EBT) program - an essential program providing financial assistance to families whose children were not receiving school lunches due to pandemic-related closures and absences.
Rather than FSSA collecting the data necessary to administer this program, IDOE simply shares the data we already have available to avoid any redundant data collection and undue burdenwhich is only the tip of the iceberg when it comes to the additional crossagency data collaboration we can foster together.
We know that these data system updates and upgrades take time, and our team at IDOE is actively working to support our school leaders and Indiana’s students through data optimization. By leveraging one-touch data systems that automatically submit carefully entered data to the state, we can continue to maximize our use of data for a variety of purposes, including funding your school, reporting its successes, and even directly supporting the flow of benefits to your families and students.
This is a team sport–thanks for your partnership in this work.

Hello, IASP! I hope you all have enjoyed or will be enjoying a well-deserved spring break! As we are focusing on data literacy for the month of April, I’ve asked my colleague Mr. Scott Frye, Assistant Principal at Tri-West High School, to share about a recent school improvement effort focused on data literacy.
I am a proud member of the Tri-West leadership team. We utilize data in a variety of ways to drive student achievement and community outcomes, ranging from student attendance goals to SAT/ILEARN results.
However, for the purpose of this article, we will focus on a recent initiative that our curriculum team is very excited about regarding the direct impact of our targeted professional development (shifting daily measurable and controllable teaching habits) on students’ mathematical understanding and standardized test data. As a compass to guide this writing, we will reference the IASP School Leader Paradigm’s cycle of inquiry, providing a synopsis of our process in the components of (1) Plan (2) Implement (3) Assess and (4) Reflect.
The genesis of this initiative was, as a secondary leadership team, to consider how we would implement effective professional development for math teachers focused on “best instructional practices” with the goal of increased student learning and test scores. Steps used in this initial phase were identifying commonalities in our administration’s perceived “Problems of Practice” and our teacher-created “We Believe Instruction Should..” statements related to our math instructional block. We then took the indicators that appeared most often in these documents and cross-referenced them with our teacher evaluation tool (Standard for Success) data over the past four years to consider our largest areas of planning and instructional gaps.
We knew that to create long-term change, this would be an extended process that focused on a manageable number of classroom instructional practices, and not “teach to the test”
quick fixes. We divided our indicators into three instructional stages, focusing on just the first stage in our initial rollout, with the understanding that our training sessions may become differentiated based on teacher needs and readiness levels. Our first stage goals each represented a specific change to instructional routine that would be measurable and verifiable and also be attainable within the sphere of influence of the leadership team. Our initial goals were:
(1) To increase the amount of time per block that students were engaged in mathematical problem solving (specifically, from 18 to 35 minutes per 49-minute instructional block).
(2) To decrease the amount of time between when an objective is taught to when the instructor identifies student misconceptions (specifically, from 3 instructional days to 1 instructional day).
(3) To increase the number of students who could articulate the primary objective and how it relates to background knowledge and/or real-world connection (specifically, from 63% to 90% of all students).
We then would connect these three measurable/controllable data points to teachers, classes, students, and standardized test results.
As our plan took shape, we built a coalition with the ongoing participants in the process: (1) our district curriculum team, (2) our middle and high school administrative teams, and (3) our middle and high school teachers. We had early conversations with all of these parties, clearly defining roles, outcomes, and anticipated changes in schedule/workload. We also developed buy-in from our students discussing why these instructional shifts were occurring and how this would potentially impact their learning and test scores positively with the clear goal of “expanding opportunities upon graduation”. As importantly, we knew that for any school-wide, impactful instructional change to occur, there must be a frequent, consistent “observationfeedback-support cycle” in place. As this cycle is now being fully implemented, we measure growth using:
(1) Quantitative data from observations to determine the amount of time per block that students are engaged in mathematical problem solving. In addition, we consider
the time from the mini-lesson to when the teacher retaught the objective, addressing misconceptions (based on their observations of student thinking in written/word form).
(2) Summative 6-8 ILEARN data (with formative IREADY scores), and our summative 9-12 PSAT/SAT/AP results (with formative McGraw Hill Reveal math data). Again, we would connect these scores to students, instructors, and courses.
(3) Qualitative data generated from frequent teacher observations and feedback sessions along with student interviews. This would be data that’s difficult to quantify through numbers. Examples of this would be the consistency that students could articulate the teacher’s intended primary objective and how it related to their (students’) background knowledge and/or how it connected to their world. Another example of this would be the consistency between what teachers believed should be their “targeted instructional area of improvement” according to our indicators compared to the administrator’s perspective.
Tom Peters wrote three decades ago “What gets measured and monitored gets done,” and we know that still holds true today. However, we also have become more aware that, as Stefano Tasselli recently stated in Forbes, “an increasingly contemporary problem that our organizations face is that we are so shaped by data-driven systems, we often forget about personal connections and compassion at work. To this generation of employees, those are the triggers that motivate action.” As we’ve started these observations, we’ve been diligent about holding feedback sessions with caring accountability and constructive persuasion. Our focus has been on listening to the teachers’ thoughts on how they felt about the lesson. Then provide feedback to the teacher, structured as generally favorable and noting positive aspects of the lesson. We then dive deeply into one specific area of improvement (based on a key data point) and provide detailed examples on approaches to increase effectiveness in that area and a clear-cut goal for the next observation. Between administrative observations, our curriculum coach is available for non-evaluative observation, feedback, and support, always focusing on that target area of growth.
As this initial article is written, we are 80 days into this project and have seen positive progress in most of our teachers’ instructional habits, with the understanding that there is still room to grow. In our average secondary 49-minute math block, we have increased the time that students are engaged in student-led mathematical problem solving. In addition, the percentage of students that can articulate the standard/ objective (post-mini-lesson) has also increased. We are most proud of initial shifts in the timeliness of teacher awareness of student misunderstandings (regarding the primary objective). In historical district observations, this would
often comprehensively occur after students had received a grade on a formal assessment (ranging from homework to an end-of-unit test). Now, because of a focus on thoughtful checks for understanding between the mini-lesson and release to independent work time, student misunderstandings are generally uncovered during the instructional block when the objective is rolled out. This allows teachers to reconvene and directly reteach to the student misconception before the students have extended practice and time to create problem solving routines/habits that become increasingly difficult to rectify.
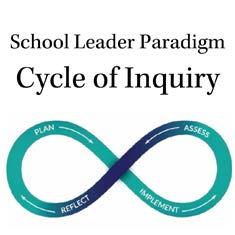
Success is simple, but it is far from easy because it demands execution, not intentions. With this being said, we are mindful that there are years of scripting, developed instructional neuroplasticity, and administrative time management (making presence in classrooms and timely feedback a priority) that must be transformed. We are also aware that achieving our desired outcomes will have little impact without appropriate lesson preparation and concept delivery in a safe, equitable environment. In addition, our initial goals were developed with intentionality to avoid heavy planning/assessing lifts for teachers outside of the classroom, and to focus on the development of efficient routines inside the 49-minute instructional block. The team is excited and proud that we are targeting controllable, process-driven data points and understand that this may have a minimal impact on our spring 2023 ILEARN/SAT data, so we are focused on the 2023-24 formative data benchmarks to track the initial impact on student achievement and continue with our inquiry cycle. Our plan is to reflect and discuss end-of-spring semester progress and how we will use our observation and assessment data to improve this process for the future benefit of our students and community.
Mr. Frye can be reached via email at fryesc@hendricks.k12.in.us


State Superintendent of the Year
National Superintendent of the Year Finalist
Data, its use, and the way it is leveraged in schools has been a point of discussion at best, and contention at worse, for well over a decade. So, in my attempt to best make sense of this phenomenon I will state five truths that define the use of data in schools where it is making a positive impact on staff and students.
■ Data is just another word for information
■ Data should lead to more questions, not simply provide answers
■ Data only matters if it is collected with the intention of behavior affirmation or change
■ Data analysis trumps data collection and beautification
■ Data does not accurately assess effort, it assesses effectiveness
Data is just another word for information
The fact we simply discuss data can be intimidating for many. Data is just a synonym for information. Your weight is data. Your cholesterol is data. The money in your retirement account is data. The amount of miles on your car is data. Data is just information. Said differently, if I asked any educator if they wanted as much information as possible to make the best possible decision on behalf of kids, almost all would say yes. Correspondingly, if I asked educators if they wanted more data on their kids so they could make a better decision, a far smaller percentage would say yes.
Data should lead to more questions, not simply provide answers
Many people look at a data set and think that through deep and thoughtful analysis that there must be an answer to unlock. Some educators act like there is a silver bullet in each spreadsheet if they look hard enough. The truth is that almost all data is best served to provide questions and not answers.
For instance, if Mrs. Jones’ data is superior to Mr. Smith’s class does that mean she is a better teacher? Perhaps. But there are about 10 questions I can immediately think of before coming to that conclusion including determining whether the data measured growth or proficiency, whether one of them had a co-teacher, attendance rates of the course, and many others before feeling anywhere near comfortable arriving at a conclusion.
Collecting data to collect data serves no purpose other than keeping people busy with a false sense of lingering accountability. The purpose of collecting data is to get actionable information that either leads to affirmation or celebration of behaviors taking place with the intention of improving outcomes OR to provide the impetus of creating behavioral change. As the old saying goes, you can weigh a pig every day if you like. But, if you do nothing to help the pig gain or lose any weight, the act of weighing the pig is relatively useless. Such is true for routine data collection as well.
As leaders we should be asking our teachers to analyze data. This analysis should do as described above. It should lead to questions and ultimately changed behavior. Far too often, data work for teachers is data collection or beautification. Leaders should work diligently to take this responsibility off of the shoulders of their teachers.
I cannot say this plainly enough, I do not care how the data looks. If someone will change their behavior based on a table created in Word I am more pleased than if someone creates beautiful pivot tables in Excel, but refuses to change their behavior. Let’s keep our eyes on the prize of changing adult behavior.
The hard part about data is that it does not measure effort, just effectiveness. I have spent weeks constructing a perfect article for it to receive a few clicks. I have also kicked out a blog in eight minutes for it to go viral. Effort does not ALWAYS equate to success or effectiveness. Thus, when analyzing data some teachers will be shaken and/or heartbroken. Remind them of this truth - data does not care about effort.
The good news is that continued effort and the ability and willingness to adapt WILL lead to better results over time if we allow it to. Every ounce of effort is not immediately rewarded. Those that continue to put in the work, in my experience, always reap the rewards, however. Just keep grinding.
Data does not have to be scary. As leaders it is our job to demystify the use of data in our schools so that our teachers use it for what it is intended for - giving them the tools they need to change their behaviors in the precisely correct manner.


Principal in Balance: Leading at Work and Having a Life


Data literacy refers to the ability to understand, analyze, and use data effectively to make informed decisions. It involves skills such as data collection, data interpretation, data analysis, and data visualization. Findings from a global study of over 7,000 C-level executives and employees suggest that data literacy will be the most in-demand skill by 2030 (Data Literacy Project, 2022) .
Here are six reasons why we need to address data literacy in PK-12 schools:
■ Preparing students for the future: In the digital age, data are becoming increasingly important in almost every field. Students who are data literate will be better equipped to succeed in college and in their future careers.
■ Developing critical thinking skills: Data literacy requires students to analyze and interpret data, which helps them develop critical thinking skills. They learn to ask questions, look for patterns, and draw conclusions based on evidence.
■ Improving decision-making: By understanding data, students can make informed decisions. They can evaluate information, identify trends, and make predictions based on data.
■ Enhancing problem-solving skills: Data literacy helps students learn to solve complex problems. They can use data to identify problems, develop hypotheses, and test solutions.
■ Fostering creativity: Data visualization is an important aspect of data literacy. By creating visual representations of data, students can express themselves creatively while also conveying information.
■ Encouraging collaboration: Data literacy encourages collaboration among students. They can work together to collect, analyze, and interpret data, and then use that data to solve problems or make decisions.
Overall, data literacy is an important skill that can help students succeed in the digital age. By addressing data literacy in PK-12 schools, we can prepare students for the future, develop critical thinking skills, improve decision-
making, enhance problem-solving skills, foster creativity, and encourage collaboration.
Students with strong skills in data literacy can pursue careers in a wide range of fields. Here are a few examples:
■ Business Intelligence Analyst: A business intelligence analyst uses data to identify trends, develop reports, and provide insights to help businesses improve their performance.
■ Data Analyst: A data analyst collects, analyzes, and interprets data to help organizations make informed decisions.

■ Data Journalist: A data journalist collects and analyzes data to develop news stories and report on social, economic, and political issues.
■ Data Scientist: A data scientist uses statistical and computational methods to extract insights from data and develop predictive models.
■ Environmental Data Analyst: An environmental data analyst collects and analyzes data on environmental issues, such as climate change, pollution, and natural resource management.
■ Healthcare Data Analyst: A healthcare data analyst analyzes healthcare data to improve patient outcomes, reduce costs, and inform healthcare policies.
■ Market Research Analyst: A market research analyst collects and analyzes data on consumer behavior and market trends to help businesses make informed decisions about their products and services.
■ Social Media Analyst: A social media analyst uses data to track user engagement and inform social media marketing strategies.
These are just a few examples of the many career paths that are available to students with strong skills in data literacy. The demand for data-literate professionals is growing in almost every field, and students who develop these skills will be wellpositioned for success in the job market.
There are several resources available in Indiana that can help you learn about data literacy:
■ Indiana Business Research Center : The Indiana Business Research Center provides training on data literacy for businesses and organizations, as well as resources and publications on data analysis and visualization.
■ Indiana Data Partnership: The Indiana Data Partnership is a collaboration of public and private organizations that work together to provide access to data and resources on a range of topics, including education, health, and the environment.
■ Indiana Department of Education: The Indiana Department of Education has resources available for teachers and students on data literacy, including lesson plans and professional development opportunities.
■ Indiana State Library : The Indiana State Library provides access to databases and resources on a variety of topics, including data and statistics.
■ Indiana University : Indiana University offers online courses in data analysis and visualization, as well as a Data Science and Analytics major.
■ Purdue University : Purdue University offers undergraduate and graduate programs in data science, as well as short courses and workshops on data analytics.
■ United States Department of Education: See presentation here: https://www.ed.gov/sites/default/files/documents/ stem/20211015-data-literacy.pdf

You can also check with your local libraries, schools, and community centers to see if they offer any workshops or training on data literacy! Interested in learning more? Arizona State University has created a wonderful series of explainer videos on data literacy and it’s main components. Scan the code below:

Infinite Capacity LLC is dedicated to inclusively fostering personal and professional growth for educators, leaders, and community partners through innovative educational practices. Consulting services to assist with IDOE STEM Certification are available for school and district-level support. Please e-mail us at contact@infinitecapacity.com for more information. Our book, Leadership in Integrative STEM: Strategies for Facilitating an Experiential and Student-Centered Culture, is available at Amazon, Barnes & Noble, and Rowman & Littlefield
References
Data Literacy Project (2022). Data Literacy: The Upskilling Evolution. Qlik. https://www.qlik.com/us/aw/data-literacyreports?utm_campaign=7013z000001oTzHAAU&utm_ content=UpskillingEvolutionRepPR&utm_medium=pressRelease&utm_ source=QlikWeb&utm_team=COM&utm_mpt_id=CCQKJE
Arizona State University (2022). What is Data Literacy? https://youtu.be/ yhO_t-c3yJY
School morale appears to be at an all-time low with 55% of educators reporting that they are thinking about leaving the profession early (Walker, 2022). Some decision-makers mistakenly believe that throwing money at the problem will solve it. Certainly, higher salaries might attract more undergraduate students to choose teaching. Teachers, of course, would appreciate, and deserve, higher compensation for the critically important roles they play in the lives of children. However, multiple studies conclude that teachers do not leave the profession primarily because of their paychecks. They leave because of “working conditions.”
When we unpack the term working conditions, it becomes apparent that school leaders have some control of these conditions and can “fix” these more readily than finding more money. Trinkle (2018) found these working conditions “pulled” teachers towards remaining in their teaching positions: professional development support; observing other teachers; serving as a formal mentor; influencing school policy; and feeling a sense of control over content to be taught, control in selecting teaching techniques, and control over student behavior. First year teachers were less likely to leave if they enjoyed a reduced teaching schedule (or less courses to prep for) and extra assistance (e.g., teacher aides). A recent study by Maynard (2023) established a strong relationship between collective teacher efficacy and teacher intent to stay among Iowa teachers. Maynard confirmed similar working conditions that raised teachers’ perceptions of collective efficacy, for example, with the following: time to collaborate, observing other teachers, and perceptions of school support. Dissatisfaction increased when teachers were presented with conflicting expectations, out-of-touch policies, and feeling that they were not respected as professionals (Pendola, 2022).
During my career, collective experiences have revealed many ways to use data to improve the working conditions for teachers. Research can provide one important way to access data about successful practice. A relevant tweet also reminds us, “Data is not about adding more to your plate. Data is about making sure that you have the right things on your plate” (Loud, nd). Below I’m sharing highlights of strategies that I know work to make a difference in teachers’ working conditions and improve overall morale. Analyzing Data. After an intense couple of years of implementing a comprehensive, district-wide initiative
involving Writer’s Workshop and writing across the curriculum, these specific data were shared with 3rd grade teachers across a small district. Teachers first color-coded the data and then analyzed it collectively. Prior years of data had always revealed low student achievement. As each grade level color-coded their own data, they were cheering with excitement to realize scores continued to rise since implementing the initiative.
Discussions in each school concluded that the writing initiative was producing the desired results and should continue as a school improvement priority. The next data that teachers were presented to color-code represented math achievement results over the same timeframe.
The rooms became quieter as the chosen criteria produced red color-coding for each box at the teachers’ grade levels. When high school faculty were asked, “What new school improvement goal might we want to focus upon?” a high school teacher replied, “That’s a rhetorical question, right? Obviously, we need to begin researching how to improve our math instruction.” A similar consensus resulted across the district. Being involved in collecting data, analyzing those data, and being asked as professionals about the future direction of the school, teachers experienced more ownership in the process and strengthened their collective sense of purpose.
Receiving Useful Feedback/Data. One of my former graduate students, a talented Black high school teacher sought my advice in tears. Not only had her principal not been in her classroom for three years; he hadn’t even been on the second floor of the high school in that period. She was feeling unappreciated and undervalued. When he left a glowing, but meaningless, evaluation form in her mailbox, she called to discuss her frustration. Soon she decided to uproot her family and move to another district where teachers worked together in close knit teams and the building leaders regularly provided feedback about her work.
The book Radical Candor can provide leaders with insight into the importance of honest feedback. Useful feedback coupled with authentic relationships can be instrumental in fostering continuous improvement. Post-pandemic, educators are starved for affirmation. The teacher observation process is an opportune time to give teachers the detailed, specific, data-driven feedback they need to continue their professional growth. When students in my supervision of instruction courses conduct clinical supervisions of peers, every project reflects how much the observed teacher enjoyed the process. The observed teacher collaborates on the data that will be collected, analyzes these data sets, and considers how to use the data to improve future instruction. One teacher expressed her thoughts about this comprehensive observation based on data, “I think it was really cool to have another teacher see the behaviors through a different lens. It would be great in classes that I’m really struggling with to see what changes I can make for students to help them be the most successful.”
Trinkle (2018) reminds us that “Principals and other school leaders are able to create conditions that influence teachers to want to stay; likewise, these leaders are in positions to eliminate or ameliorate those working conditions which push teachers away from their buildings (134-135).” I believe that smart leaders can improve morale and cause more teachers to thrive in their school cultures if they provide meaningful data for their teachers!

References
Loud, T. (nd). Data. Tweet at Dr. Tom Loud @loudlearning
Maynard, R. (2023). The relationship between teacher retention and collective teacher efficacy. Ball State University ProQuest Dissertations Publishing. https://www.proquest.com
Pendola, A. (2022). Behaviors and Future Intentions of Dissatisfied Teachers. (pdf in Google Scholar).
Scott, K. (2017). Radical candor: How to get what you want by saying what you mean. St. Martin’s Press.
Trinkle, C. (2018). What’s behind the revolving door: A study of push and pull factors influencing teacher retention. Ball State University ProQuest Dissertations Publishing. https://www.proquest.com
Walker, T. (2022). Survey: Alarming number of educators may soon leave the profession. National Education Association website. https://www.nea.org/ advocating-for-change/new-from-nea/survey-alarming-number-educatorsmay-soon-leave-profession
We make your existing student health data usable in the MTSS process
Provide schools their Academic Health Score
Provide schools their Academic Health Cliff Score
Provide schools support with IDOE Health Reporting
Transcribe and code existing student health data from the school nurse or school based health center
Provide schools professional development on use of health data and health professionals in their existing MTSS processes

Support schools in leveraging Title funds to pay for school nurses
Fundable by Title, ESSER, SIG, and Part B
IDOE approved as an evidence based best practice
Learn more at www.healthdataproject.org or email us info@healthdataproject.org





IPLI is a premier professional development opportunity for the practicing principals of Indiana. We are here to support you, encourage you, and provide growth in your leadership as we learn together, lead together, and connect.
According to the definition found on the internet site https://www.intellspot.com/, data literacy is all about the ability to read, write, use, and communicate data. You must be able to analyze and interpret a standard data table or chart, understand and use common graphs, and know how to produce and analyze your own charts.
I cannot imagine a day in the life of an educational leader where some form of data literacy is not required. It truly is a part of our world in every aspect of measuring how we are doing, communicating with our stakeholders, and researching new ways of doing our work to produce better results, i.e., action research.
IPLI’s foundation of learning is through the inquiry cycle, creating personal and team action research. Through action research, we can study our leadership and our school to improve the educational experience for ourselves and our communities. And after collecting data, we interpret that data through analysis to inform the following steps, which may produce a new wondering to begin the process again. These can be exciting times to study leadership and schools, especially as we have experienced changes that have influenced new directions.
If you have not participated in the IPLI 2-year learning journey, we encourage you to join us to gain the professional development that will influence your professional career. Cohort 11 applications are open through April, and we would enjoy having you begin or continue your learning journey with us. There are just a few spots left, so I encourage you to submit your application today and learn from some of the best experts in the field. We will assist you in improving your data literacy!
IPLI is celebrating a decade of support for the principals of Indiana. With bi-partisan support from the Indiana General Assembly, IPLI was signed into law in 2013. After a decade of service, over 550 principals and schools have been supported by the IPLI conceptual model developed and the curriculum implemented to grow leaders and schools throughout Indiana.
Principals continue to lead and are vital to the success of our Indiana students. We are grateful for their leadership as they are learning leaders, leading-learners! Wishing everyone a continued safe and healthy school year.

In April 2023, IPLI will enjoy learning with the AR Showcase for Cohort 10, where principals will share their action research projects. Dr. Steve Gruenert will share Culture Rewired in the afternoon.
IPLI will celebrate Cohort 9 as their teams will share their action research for schools in the morning and graduate in the afternoon after hearing Annette Breaux as the keynote speaker on the Seven Simple Secrets. We anticipate a great two days of learning and sharing.
IPLI began in July 2013 and is excited to celebrate a decade of learning together. Cohort 11 will kick off a new decade of principals learning together, starting in July 2023, with keynote speaker Dr. Peter DeWitt as he shares Leader SelfEfficacy. Applications can be found on the IPLI website at www.indianapli.org and are open through April 2023. IPLI looks forward to serving Indiana principals by growing leaders and improving schools.
IPLI Extended enjoyed three great seminars under the theme, Leadership in Times of Change. Our 23-24 school year theme will be “Leaders in Action!” Applications for the 23-24 Extended year are now open on the IPLI website, www. indianapli.org. Join us to continue your leadership journey as an elite graduate of a nationally recognized professional development opportunity.
Let’s keep learning together as we continue to lead in 2023!
In my role as Kids Caring & Sharing Officer, I think about philanthropy all of the time. Why is it important to introduce children early to the concept of moving into action on behalf of others without expecting anything in return? What do donors wish to accomplish through their philanthropic actions? How can a school’s philanthropic efforts become a school legacy?
As a Riley mom, the decision about where I want my philanthropic efforts to make an impact is an easy consideration, but does my family know how important it is to me and what I might like to happen with my assets when I’m gone? Are there tax considerations that may help with my philanthropic decisions?
There may be multiple reasons for your school family to participate in the Kids Caring & SharingTM program each year and perhaps your own Riley support has deeply personal origins. Does your family know that Riley is important to you beyond your KCS engagement at school?
One of the simplest and most powerful ways to support pediatric research and care is by including Riley Children’s Foundation in your will or living trust.
This type of gift is called a bequest, and it offers plenty of flexibility. You may choose to leave Riley Children’s Foundation a specific dollar amount or asset, a percentage of your estate, or whatever is left after bequests to family and friends are fulfilled.
Bequests of all sizes are important and appreciated, and will help the team at Riley Hospital for Children pursue lifesaving research and deliver the highest quality care to sick and injured kids.
What are the benefits of leaving Riley in your will?
■ A bequest costs you nothing now, and you have the satisfaction of knowing you are supporting the future of children’s healthcare.
■ You retain control of the assets during your lifetime, meaning you can spend your savings as you see fit. You can also modify your bequest at any time if your financial or life circumstances change.
■ You may choose to direct your gift to a specific hospital department or area of research, or allow it to be used toward the area of greatest need. You may also choose to establish a permanent fund in your name that will continue
to support Riley for generations to come. (If you wish to restrict your gift to a specific purpose, it’s important to let us know.)
■ Gifts to Riley Children’s Foundation from your estate are exempt from federal estate taxes. Depending on the size of your estate, this could result in a larger inheritance for your heirs.
Riley Children’s Foundation Planned Gift Officers are available to discuss your interest in making a bequest or other philanthropic options to best fit your intentions. I would be happy to help make a connection for you. Be sure to also contact an attorney or tax advisor for specific information that pertains to your circumstances. Tax rates and estate laws are subject to change.
KCS 2022-2023

It’s a busy spring fundraising season for schools throughout the state and not too late to make plans for a KCS project before the end of the school year. For easy and fun ways to get your school involved, see the KCS program guide available through KCS online launch page here www.rileykids.org/KCS
Be sure to submit your gift in a check(s) payable to the Riley Children’s Foundation to our secure lock box before the end of June for 2022-2023 recognition.
Riley Children’s Foundation
Attn: KCS/Susan Miles
P.O. Box 3356 Indianapolis, IN 46204-3356
Don’t forget to nominate your school’s/school corporation’s/district’s Riley Champion
You may already know a 2024 Riley Champion – perhaps someone in your own school or school corporation who is turning their biggest challenge into their greatest strength. Before the end of the school year, please consider nominating a Riley patient from your community who demonstrates courage and commitment to helping others while navigating medical obstacles. https://rileykids.org/get-involved/nominate-a-rileychampion
Under the Family Educational Rights and Privacy Act (FERPA), students have certain privacy rights regarding their educational records. This includes the right to control the disclosure of records containing personally identifiable information (“PII”). However, when it comes to video recordings depicting students, the balance between privacy rights and the need for safety can be challenging. Adding to the challenge is that FERPA does not specifically address video recordings. Therefore, we are left to bend and shape existing regulations and opinions from various sources, none of which are binding. As you can imagine (or may have experienced), this gap in an otherwise heavily regulated area of education has led to confusion and hesitance among school leaders. We have advised IASP members through the KGR Legal Help Desk on several situations involving video recordings depicting students that thought it was a ripe topic for the Law Briefing. In this briefing, we describe best practices for keeping, storing, and sharing video recordings depicting students.
Determining When a Video Recording is an Education Record. Generally, the classification of something as an “education record” hinges on two questions: (1) does it directly relate to the student? and (2) is it maintained by an educational agency or institution or by a party acting for the agency or institution? The concepts themselves are simple enough, but the application is immediately complicated by the fact that “directly related” is not defined in the FERPA regulations. The U.S. Department of Education released an FAQ on the topic, and provided the
following factors to help determine if a photo or video should be considered “directly related:”
■ Are you (the school) using the recording for disciplinary action?
■ Does the recording depict evidence that a student violated a school policy or a law?
■ Does the recording depict a student being victimized or having a health emergency?
■ Is a specific student the intended focus of the recording? (e.g., student presentation)
If one of these factors exists, clearly consider the recording part of the applicable student’s education record.
One important note regarding education records and the above factors is that a recording can absolutely be considered an education record for more than one student. For example, if a student gets in an altercation with another student, then the recording of that altercation is most definitely considered part of the education record for each of the students involved.
When Uninvolved Students are Captured. Rarely do schools find themselves in a situation that is as straightforward as the examples illustrated above. Most of the time, video recordings capture hallways, lunchrooms and buses full of students. But what about the students that aren’t the primary actor in the video. For example, if your video surveillance of the cafeteria captures three students fighting, that recording is most certainly directly related to the three students who engaged in the fight and
should be considered part of the three students’ education records. But what about the (potentially hundreds of) other students who are captured in that video? You could take the position that FERPA does not protect those “other” students. Doing so could make the video much easier to disclose without consent or applying a FERPA exception. On the other hand, not considering the FERPA protection broadly would result in countless hours, days, weeks, months and even years of school surveillance video being subject to public record requests. That is why we strongly encourage our clients to think through the implications of setting precedent in how they consider the FERPA as applied to videos depicting students. In most situations, we typically suggest erroring on the side of considering FERPA to protect all students depicted in the video.
Parent Inspection. Once a video is determined to be part of a student’s education record, the parent’s (or eligible student’s) right to inspect, review, or to “be informed” of the content of the video is triggered (see 20 U.S.C. § 1232g(a)(1)(A)). This is where things can get more difficult. According to U.S. DOE Guidance, a school’s responsibility to redact or blur other students varies depending on whether the video “directly relates” to the other students or if the other students are incidentally captured. The DOE advises that if the school can reasonably redact or segregate out the portions of the video directly related to other students, without destroying the meaning of the record, then the school is required to do so prior to providing the parent or eligible student with access. The DOE’s guidance is illustrated through an example.
Students A and B get in a fight in the hallway and 10 other students are captured on the surveillance footage (12 students total). For each of the 12 students, you run an analysis to determine to which students the video “directly relates.” You determine the video “directly relates” to students A and B only and that the other 10 students were incidentally captured. You file the recording in the education record of Student A and B, and then the Parent of Student A requests to inspect. Breakdown of Responsibility owed:
■ To Student B: because the video also “directly relates” to Student B, the school has the responsibility to redact or segregate out the portions that are directly related to Student B if they have the resources/technology to reasonably do so.

■ To 10 Other Students: no redaction/segregation efforts required.
But, again, we suggest considering all students depicted as having FERPA protections. Not doing so could result in a lot of requests and even more blurring of images. Instead, we suggest only providing access to a video depicting numerous students to
the family of a student depicted in the video and the video is being used as evidence to support a recommendation for out-of-school suspension or expulsion. This situation demonstrates the balance between the right of access to a student’s records outweighing the right of privacy, particularly when removal from school is at issue. Also note that there are several other exceptions that could permit disclosure of a video, including consent from all families of students depicted, when necessary to protect against imminent injury and compliance with a subpoena (after opportunity to quash the subpoena has been provided). For an in-depth discussion of the issue of balancing the rights of access and privacy, see the Letter to Wachter issued by the U.S. DOE in 2017.
Policy Recommendations. The gap in FERPA’s application to video surveillance amplifies the importance of your local approach to policy. When developing your policy, keep in mind that nothing in FERPA requires the school to provide the parent or eligible student with a copy of the information. Additionally, be consistent with your determination of whether you will take
a conservative application of FERPA protection as we suggest, or the less conservative approach taken by US D.O.E.. While you can change course and set new precedent, you don’t want to be doing so in a high intensity situation that will draw allegations of discriminatory treatment. And finally, remember that there is no requirement in state or federal law that you have a certain level of video surveillance technology. However, there is a federal requirement that if you have access to redaction features, you are required to use it.
Conclusion. Video recordings can be a useful and often necessary tool for educational purposes, but schools must ensure that they comply with FERPA when using video recordings and take steps to protect the privacy and security of students’ education records. Be sure to review each situation on a case-by-case basis and reach out to the KGR Legal Help Desk if you would like to talk through one of those cases.
We at the KGR Legal Help Desk are here to address legal issues for IASP members. Until the next KGR Law Briefing, stay legal!


