21 minute read
International Journal of Agronomy and Agricultural Research (IJAAR)

from Climate and potential habitat suitability for cultivation and in situ conservation of the black plum
ISSN: 2223-7054 (Print) 2225-3610 (Online) https://innspub.net Vol. 8, No. 4, p. 67-80, 2016 RESEARCH PAPER
OPEN ACCESS
Advertisement
Climate and potential habitat suitability for cultivation and in situ conservation of the black plum (Vitex doniana Sweet) in Benin, West
Africa Achille Hounkpèvi*1,2, Félicien Tosso3,4, Dossou Sèblodo Judes Charlemagne Gbèmavo1, Edouard Konan Kouassi5, Daouda Koné2, Romain Glèlè Kakaï1
1 Laboratoire de Biomathématiques et d’Estimations Forestières (LABEF), Faculté des Sciences Agronomiques, Université d’Abomey-Calavi, Abomey-Calavi, Bénin 2 Graduate Research Program Climate change and Biodiversity, WASCAL, UFR Biosciences, University Félix Houphouët-Boigny, Campus of Bingerville, Abidjan, Côte d’Ivoire 3 University of Liège, Gembloux Agro-Bio Tech., Terra & Biose, Forest Resources Management, Tropical Forestry, Passage des Déportés, Gembloux, Belgium 4 Laboratoire d’Ecologie Appliquée (LEA), Faculté des Sciences Agronomiques, Université d’Abomey-Calavi, Abomey-Calavi, Bénin 5 Laboratoire de Botanique, UFR Biosciences, Université Félix Houphouët-Boigny, Abidjan, Côte d’Ivoire
Article published on April 22, 2016
Key words: Climatic envelope, MaxEnt, Species distribution modelling, Representation gap analysis, Vitex doniana.
Abstract
Sustainable management actions are needed for several indigenous agro forestry plant species like the black plum (Vitex doniana Sweet) because they are facing increasing pressures due to the rapid human growth and threats such as climate change. By combining species distribution modelling using the Maximum Entropy Algorithm (Max Ent) and representation gap analysis, this study accessed the impacts of current and future (2050) climates on the potential distribution of Vitex doniana in Benin with insight on the protected areas network (PAN). The model showed a high goodness-of-fit (AUC = 0.92 ± 0.02) and a very good predictive power (TSS = 0.72 ± 0.01). Our findings indicated annual mean rainfall, annual mean diurnal range of temperature and mean temperature of the driest quarter as the most important predictors driving the distribution of V. doniana. Under current climate, about 85 % of Benin area is potentially suitable for its cultivation. This potential suitable area is projected to increase by 3 to 12 % under future climatic conditions. A large proportion (76.28 %) of the national PAN was reported as potentially suitable for the conservation of the species under current climate with increase projections of 14 to 23 % under future climate. The study showed that V. doniana can be cultivated in several areas of Benin and that the PAN is potentially suitable for its conservation. These findings highlighted some of the opportunities of integrating V. doniana in the formal production systems of Benin and also its potentialities in ecosystems restoration under the changing climate. * Corresponding Author: Achille Hounkpèvi * hounkpeviachille@gmail.com Hounkpèvi et al.
Introduction
Indigenous agro forestry species, formerly considered as less useful and underutilized products are becoming nowadays important resources for many food security policies mainly in developing countries (Garrity, 2004, Oladélé, 2011). These species provide several goods to local communities enhancing then their capacity to face food shortage (Atato et al., 2011) and to alleviate poverty (Akinnifesi et al., 2008, Oladélé, 2011). Moreover, they provide several ecosystem services and contribute to biodiversity conservation (Vodouhè et al., 2011). Unfortunately, most of these agroforestry species are overexploited and threatened in their natural biotopes (Maundu et al., 2006). In fact, habitat and population of these species are facing increasing pressures due to the rapid human population growth (Maundu et al., 2006, Nacoulma et al., 2011, Haarmeyer et al., 2013, Mensah et al., 2014) and this combined with climate change add several uncertainties to their fitness and survival (IPCC, 2007, FAO, 2012). This situation has enhanced the need of developing sustainable management, domestication and conservation strategies for those species with a focus on climate change.
Climate change, one of the biggest challenges for this century, occurs mainly as alterations over time in weather parameters such as temperature, precipitation and wind, and changes in temperature are the most considered facts (de Chazal and Rounsevell, 2009). The implications of these change are significant for the long-term stability of natural ecosystems and for the many benefits and services that humans take from them (Lucier et al., 2009). Several impacts have been reported on biological systems, with species extinction being the most extreme and irreversible negative impact (Bellard et al., 2012). In Africa for instance, more than 5,000 species might lose their natural habitat before 2080 (McClean et al., 2005). To avoid or reduce the amplitude of those effects, biodiversity components must produce adaptive responses which can be of several time-dependent types (Parmesan, 2006, Bellard et al., 2012). Whatever the adaptation mechanism used, species responses to climate change have been observed along three non-exclusive axes: time (e.g. phenology), space (e.g. range) and self (e.g. physiology), with the first two axes being the most easily observable (Parmesan, 2006). In the spatial point of view, through seed dispersal, plant species track appropriate conditions and follow them by shifting their geographical range in order to stay in quasi-equilibrium with the climatic conditions they are adapted to (Bellard et al., 2012). Evidences of such geographical range shifting have been given by several modelling studies and experimental trials on species tolerance. These studies revealed significant changes in the distribution of some species and ecosystems, principally due to increasing temperature and alteration of precipitation regimes (Walther et al., 2002, Campbell et al., 2009).
In this context of a changing climate, assessing spatial dynamics of suitable habitat of useful species is an important steps towards their domestication and integration into formal agricultural production systems especially in developing countries where rural population are still dependent on such resources (Oladélé, 2011). Furthermore, this assessment is relevant for in situ conservation planning strategies taking into account the existing extensive protected areas network. Despite the increasing literature on climate change impacts on plant species distribution and effectiveness of protected areas network in conserving suitable habitat of native plant species (Fandohan et al., 2013), little is known on how climate could affect habitat suitability for cultivation and conservation of several useful indigenous agroforestry species such as the black plum.
The black plum (Vitex doniana Sweet) is one of these very important indigenous agroforestry species valued by local communities in many parts of Africa and for which sustainable management and domestication programs are required (Maundu et al., 2009, Achigan-Dako et al., 2011, Mapongmetsem et al., 2012). Beside its potential role in soil fertility improvement by litter production (Mapongmetsem et al., 2005), several parts of the species are used for
food, medicine and other purposes (Dadjo et al., 2012). It is known that its leaves are used as fodder for livestock and the young leaves as leafy vegetables in sauces preparation. The blackish pulp of its ripened fruits is edible and used in preparation of some sweet drinks. The wood is suitable for construction and fire (Arbonnier, 2004, Ky, 2008, Orwa et al., 2009, Dadjo et al., 2012). The mature leaves, the bark and the roots have phytotherapeutic properties and are used to heal several diseases (Iwueke et al., 2006, Kilani, 2006, Padmalatha et al., 2009). Given its socioeconomic importance, its integration into the formal production systems could foster domestication strategies and reduce anthropogenic pressures on its natural populations. In addition, knowledge on its conservation by protected areas is relevant for designing strategies for plant genetic resources management. It is therefore crucial to assess impacts of climate on the species habitat in order to identify suitable areas for its cultivation and conservation.
Thus, through species distribution modelling using the Maximum Entropy Algorithm “MaxEnt” (Phillips et al., 2006) and representation gap analysis, this study aimed at assessing impacts of current and future (2050) climates on V. doniana’s habitat suitability for its cultivation and in situ conservation in Benin. Specifically, it addressed the following research questions: i) what are the bioclimatic variables controlling V. doniana’s potential distribution? ii) How will the species’ habitat suitability change with climate? iii) How far the national protected areas network might conserve the species’ suitable habitat under current and future climates?
Material and methods
Target species and study area The black plum (Vitex doniana Sweet) is a deciduous plant species occurring in tropical Africa from Senegal to Somalia and to South Africa, also in Comoros and Seychelles (Arbonnier, 2004, Ky, 2008). It was formerly classified in the Verbenaceae family but based upon several phylogenetic studies, it has been transferred to the Lamiaceae family (Cantino et al., 1992, Harley et al., 2004). It colonises various habitats from forests to savannahs, often in wet localities and along rivers, and on termite mounds, up to 2000 m altitude. It occurs in regions with a mean annual rainfall between 750-2000 mm and temperature ranging from 10 to 30°C (Arbonnier, 2004, Ky, 2008, Orwa et al., 2009). It has been mentioned as naturally occurring in all the three climatic zones of Benin (Assogbadjo et al., 2012).
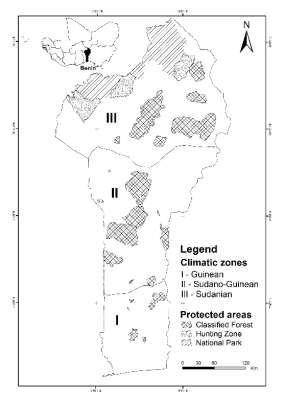
Fig. 1. Climatic zones and protected areas network of Benin.
The study was carried out in Benin republic (114,763 km2), located between 6°10’ and 12°50’ N and 1° and 3°40’ E in West Africa (Fig. 1). The country’s climatic profile shows two contrasting climatic zones (Guinean vs. Sudanian) and a transitional zone (SudanoGuinean). The Guinean zone (between 6°25’ and 7°30’ N) is characterised by a subequatorial climate with four seasons (two rainy and two dry). The rainfall of about 1200 mm per year is bimodal mostly from March to July and September to November. The temperature varies between 25 and 29 °C, and the relative humidity varies between 69 % and 97 %. The
Sudanian zone (9°45’ - 12°25’ N) has a tropical dry climate with two equal length seasons (rainy and dry). The mean annual rainfall in this zone is often less than 1000 mm and occurs mainly from May to September. The relative humidity varies from 18% to 99% and temperature from 24 to 31°C. The SudanoGuinean (from 7°30’ to 9°45’ N) is a transitional zone with two rainy seasons merging in a unimodal regime. The annual rainfall fluctuate between 900 and 1110 mm, the temperature is between 25 and 29°C and relative humidity from 31 % to 98 % (Fandohan et al., 2011, Gnanglè et al., 2011, Assogbadjo et al., 2012).
About 24 % of the country (approximately 27,310.47 km2) is legally protected by the national protected areas network constituted of two parks (Pendjari in the North-western part and W in the extreme Northern part of the country, Fig. 1) and several classified forests (IUCN and UNEP-WCMC, 2015).
Data collection A total of 227 occurrence points (longitude and latitude) were obtained from fieldwork in Benin and from the Global Biodiversity Information Facility portal (GBIF, 2015) for the West African region (Fig. 2).
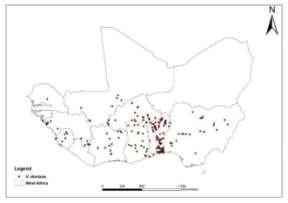
Fig. 2. Occurrence of V. doniana in West Africa (Data source: GBIF and fieldwork).
Bioclimatic data for current (1950-2000) and projections for 2050 were extracted from World Clim (available at www.worldclim.org/bioclim), Version 1.4 database (Hijmans et al., 2005) at 2.5-minute grid resolution (approximately 4.62 x 4.62 km2 in West Africa). This database includes 19 bioclimatic variables (Bio1 to Bio19) which are derived from average minimum and maximum temperature and rainfall data (Hijmans et al., 2005).
According to the future climate (2050), projections from two models of the Coupled Model Intercomparison Project phase 5 (CMIP5) were preferred because of their commonness use and satisfactory features for simulating the global climate response to increasing greenhouse gas concentration (Fandohan et al., 2015, McSweeney et al., 2015). These models were the Met Office climate model (HadGEM2-ES) and the Model for Interdisciplinary Research on Climate Change (MIROC5). They were considered under two of the four Representative Concentration Pathway (RCP) developed by the Intergovernmental Panel on Climate Change (IPCC) in its Fifth Assessment Report: RCP 4.5 and RCP 8.5. These RCP were preferred because they projected the most divergent trends for the West African region compared to the others (IPCC, 2013). With this divergent trend (low vs. high emissions scenario), the range of emissions uncertainty is well captured (Harris et al., 2014). For instance, temperature is projected to rise above industrial level by at least 1.4°C under RC 4.5 in West Africa by mid-21st century, with atmospheric CO2 reaching 500 ppm and by 2°C with atmospheric CO2 over 550 ppm under the more drastic RCP 8.5 (IPCC, 2013).
The Protected Area Network (PAN) map of Benin was obtained from the World Database on Protected Areas (IUCN and UNEP-WCMC, 2015) and used to assess the in situ conservation of the species in the country under current and future climates.
Data analysis The Maximum Entropy species distribution model algorithm (MaxEnt, version 3.3.3k” Princeton University, Princeton, New Jersey, USA) was used for the habitat suitability modelling. This modelling tool requiring presence-only data is one of the bestperforming algorithm among those using climate modelling approaches (Phillips et al., 2006) and is relatively robust for small sample sizes (Pearson et
al., 2007). It is a machine learning method that estimates species’ distribution across a study area by calculating the probability distribution of maximum entropy subject to the constraint that the expected value of each feature under this estimated distribution should match its empirical average (Phillips et al., 2006). Although there are several conceptual ambiguities and uncertainties about bioclimatic envelope modelling (Schwartz, 2012), MaxEnt remains an important modelling tool in assessing potential impacts of climate change on species distribution (Elith et al., 2011a).
During the modelling process, presence data were cleaned up by removing duplicate records in grids in order to reduce sampling bias which may result from the over sampling of some sites in the study area (Elith et al., 2006). Only the less-correlated (r < 0.85) bioclimatic variables were selected with the environmental niche modelling tools (ENMTs) and used for the modelling (Elith et al., 2011b). During these bioclimatic variables selection process, priority was given to those reflecting water availability since plants distribution in the study area is known to be under the influence of mainly soil moisture, total rainfall, air humidity and the length of the dry season (Adomou et al., 2006). MaxEnt’s internal Jackknife test was performed to assess the contribution of the selected variables in the distribution of the species (Pearson et al., 2007).
Twenty five percent (25%) of the occurrence points was used for model testing and 75% for model calibration in five replicates. The five replicates were averaged through cross-validation. Two criteria were used to evaluate the performance i.e. goodness-of-fit and predictive power of the model: (i) the area under the receiver operating characteristic curve (AUC) and the true skill statistic (TSS) (Allouche et al., 2006, Elith et al., 2006, Pearson et al., 2007). The AUC is the probability that a randomly chosen presence point of the species will be ranked as more suitable than a randomly chosen absence point (Elith et al., 2006). A model is considered as having a good fit when its AUC is close to one (AUC ≥ 0.75) (Elith et al., 2006). The TSS is the capacity of the model to accurately detect true presences (sensitivity) and true absences (specificity). A model with TSS ≤ 0 indicates a random prediction, while a model with a TSS close to 1 (TSS > 0.5) has a good predictive power (Allouche et al., 2006).
To capture the correct range of each bioclimatic factor, we performed the modelling process using occurrence and climatic data for the whole West Africa. The outputs of MaxEnt were then clipped on Benin, to mark out the study area. The potential habitat suitability across the study area was assessed based on the logistic probability distributions generated by Ma x Ent using the 10 percentile training presence logistic threshold. Thus, areas with occurrence probability above the threshold value were considered as suitable for the species and areas with occurrence probability below the threshold value were taken as unsuitable habitats (Scheldeman and van Zonneveld, 2010, Fandohan et al., 2015). Suitable/unsuitable habitats of the species under current and future climates were mapped in ArcGIS 10.3 (ESRI, 2014).
Representation gap analysis was used to assess how far the national protected areas network conserve the species (Fandohan et al., 2013, Tantipisanuh et al., 2016). For that, PAN of Benin was overlain on the present and future habitat suitability maps and proportions of suitable and unsuitable areas within the PAN were estimated in ArcGIS 10.3 (ESRI, 2014).
Results
Bioclimatic variables importance and model performance Five of the 19 bioclimatic variables were selected as less-correlated (r < 0.85) and used for the species potential habitat modelling. Annual mean rainfall, annual mean diurnal range of temperature and mean temperature of the driest quarter were the most important predictors driving the species’ distribution (Table 1). These variables have significant effect on the gain when used in isolation or removed from the modelling process (Fig. 3). Annual mean rainfall was
the most uniquely informative predictor because its presence/absence in the model considerably affects the gain; its contribution and permutation importance were around 50 % (Table 1). The five bioclimatic variables used for the modelling showed significant variation (Wilcoxon signed-rank test, pvalue < 0.05) between current climate and future projections with the most important changes reported in the Sudanian and Sudano-Guinean zones (Table 2). Annual mean rainfall, annual mean temperature and mean temperature of the driest quarter were projected to increase in all zones whatever the climatic scenario. Meanwhile, precipitation of the driest month is projected to significantly decrease in the Guinean zone and to remain stable in the other
zones. Table 1. Variables contribution and permutation importance (%).
Varia bles Definition Contribution (%)
Permutation importance (%) bio12 Annual mean rainfall 48.7 52.1 bio2 Annual mean diurnal range of temperature 28.6 21.3 bio9 Mean temperature of the driest quarter 15 17.8 bio1 Annual mean temperature 5.4 6.8 bio14 Precipitation of the driest month 2.3 2.0
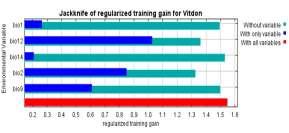
Fig. 3. Jackknife of regularized training gain for V. doniana.
Table 2. Current and future projections of selected bioclimatic variables in Benin (mean ± standard deviation).
Climatic
Climate Bio12 Bio2 Bio9 Bio1 Bio14
zones
Guinean
SudanoGuinean
Sudanian Current 1136.92a ± 59.56 82.95a ± 15.54 279.91a ± 1.96 273.82a ± 2.34 9.49a ± 3.84 He4.5 1137.54a ± 59.24 79.11b ± 13.78 300.29b ± 3.00 293.11b ± 3.46 7.42b ± 2.49 He8.5 1135.98b± 61.53 78.92b ± 13.80 306.60b ± 3.58 299.10b ± 3.63 6.41b ± 2.35 Mi4.5 1231.52b ± 65.83 82.50b ± 14.89 297.10b ± 2.42 288.93b ± 2.46 7.08b ± 2.90 Mi8.5 1214.40b ± 61.77 79.94b ± 13.49 298.92b ± 3.06 290.82b ± 2.11 7.15b ± 2.91 Current 1096.08a ± 51.52 121.36a ± 7.05 270.82a ± 4.22 269.80a ± 3.58 3.21a ± 1.24 He4.5 1149.18b ± 70.28 114.45b ± 8.57 295.06b ± 4.29 292.35b ± 3.65 3.23b ± 1.26 He8.5 1152.14b ± 75.71 113.31b ± 7.68 301.94b ± 3.99 299.01b ± 3.41 3.17b ± 1.17 Mi4.5 1201.67b ± 63.17 120.40b ± 7.45 290.18b ± 4.14 286.30b ± 2.79 2.28b ± 1.01 Mi8.5 1233.80b ± 73.76 115.69b ± 8.62 292.94b ± 2.78 289.03b ± 2.22 2.19b ± 0.96 Current 1054.32a ± 94.99 131.05a ± 1.97 268.49a ± 8.27 273.04a ± 6.64 0.20a ± 0.40 He4.5 1167.59b ± 78.19 128.66b ± 1.94 294.00b ± 6.95 295.52b ± 7.06 0.20a ± 0.40 He8.5 1190.36b ± 80.81 125.14b ± 1.78 301.27b ± 7.18 303.63b ± 7.26 0.20a ± 0.40 Mi4.5 1173.18b ± 98.35 131.53b ± 2.10 287.37b ± 9.20 291.70b ± 6.70 0.20a ± 0.40 Mi8.5 1206.60b ± 110.07 131.02a ± 2.44 294.92b ± 7.61 297.30b ± 6.89 0.20a ± 0.40
Values were extracted from Worldclim database Version 1.4 at 2.5-minute grid resolution (approximately 4.62 x 4.62 km2 in West Africa) based on the occurrence points of V. doniana in Benin. In each climatic zone, significant differences between current and each future scenario are shown by letters following mean values (Wilcoxon signed-rank test, pvalue < 0.05). He4.5 & He8.5: HadGEM2-ES under respectively RCP 4.5 and 8.5. Mi4.5 & Mi8.5: MIROC5 under respectively RCP 4.5 and 8.5. Bio12 =
Annual mean rainfall (mm); Bio2 = Annual mean diurnal range of temperature (10 x °C); Bio9 = Mean temperature of the driest quarter (10 x °C); Bio1 = Annual mean temperature (10 x °C); Bio14 = Precipitation of the driest month (mm).
The model had a very goodness-of-fit (cross-validated average AUC = 0.92 ± 0.02) and a very good predictive power (TSS = 0.72 ± 0.01). The 10th percentile training presence logistic threshold for the habitat suitability discrimination was 0.22. Areas with occurrence probability above this threshold were then considered as suitable for the species, the remaining been considered as unsuitable areas.
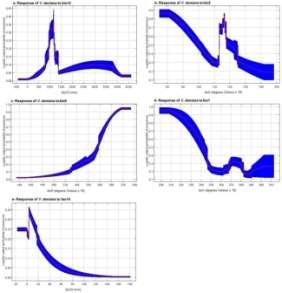
Fig. 4. Response curves of V. doniana to bioclimatic predictors in the habitat suitability modelling.
Responses of V. doniana to the selected bioclimatic predictors Vitex doniana preferred areas with the annual mean rainfall between 800 and 1200 mm (Fig. 4a). Occurrence probability of the species was at its highest level for annual mean diurnal range of temperature around 6°C and decreased progressively when the range increased up to 12°C. Areas with diurnal range of temperature between 12.5 and 15°C were also suitable for the species (Fig. 4b). Globally, habitat suitability of the species increased with the mean temperature of the driest quarter (Fig. 4c), but it decreased with the annual mean temperature (Fig. 4d). Similarly, increases in the precipitation of the driest month reduced the habitat suitability of V. doniana (Fig. 4e).
Logistic output is the occurrence probability of V. doniana. a- Annual mean rainfall (bio12, mm); bAnnual mean diurnal range of temperature (bi o2,°C x 10); c- Mean temperature of driest quarter (bi o9,°C x 10); d- Annual mean temperature (bio1, °C x 10); ePrecipitation of driest month (bio14, mm).
Suitable areas for cultivation of V. doniana in Benin Under current climatic conditions, about 85 % (≈ 98,005 km2) of Benin’s area was potentially suitable for the cultivation of V. doniana (Table 3). This suitable habitat consisted of two blocks: a southern block and a northern block. The first block covered the Guinean zone and the lower part of the SudanoGuinean zone; the second block included the upper part of the Sudano-Guinean zone and the Sudanian zone except its extreme northern part which is not actually suitable for the species (Fig. 5a). The habitat suitability was projected to increase by 3 to 12 % (about 3,512 to 14,278 km2) under future climatic conditions for the year 2050 (Table 3; Fig. 5b, c, d & e). For instance, the extreme northern part of the country will become suitable for the cultivation of the species under all the considered future climatic projections. For the RCP 4.5 projections, the increase of the suitable habitat will be two times more important for MIROC5 than for HadGEM2-ES. Meanwhile, when considering RCP 8.5, the most important increase of the suitable area will be noted under Had GEM2-ES (Table 3).
Conservation of V. doniana by protected areas network under current and future climate Under current climate, about 76 % (≈ 20,832 km2) of the national PAN was suitable for the conservation of V. doniana (Table 3). Regarding the two national parks, the major part of the W national park was not currently suitable for the conservation of the species (Fig. 5a). Future climate will slightly ameliorate the in situ conservation of the species by the national PAN. Indeed, the proportion of the conserved suitable
habitat will increase under the future climatic projections with HadGEM2-ES showing the greatest variation (thus, +20.71 and +23.27 % for RCP 4.5 and RCP 8.5 respectively). The most important change will likely occur in the W National Park in the Sudanian zone (Fig. 5).
Table 3. Dynamic of suitable areas for cultivation and conservation of V. doniana
Climate Cultivation Area (Km2) Area (%)
Conservation by PAN Variation (%) Area (Km2) Area (%)
Variation (%) Current 98,005.21 85.40 - 20,832.46 76.28 RCP 4.5 HadGEM2 MIROC5 -ES 103,522.26 108,502.07 90.21 94.54 +4.81 +9.15 26,487.87 25,603.57 96.99 93.75 +20.71 +17.47 RCP 8.5 HadGEM2 MIROC5 -ES 112,283.42 101,517.94 97.84 88.46 +12.44 +3.06 27,187.08 24,760.40 99.55 90.66 +23.27 +14.38
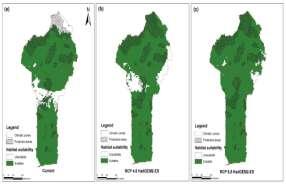
Fig. 5. Potential suitability maps for cultivation and conservation of V. doniana under current and future climate in Benin. a. Current climatic conditions; b. Future projection according to HadGEM2-ES under RCP 4.5; c. Future projections HadGEM2-ES under RCP 8.5; d. Future projections with MIROC5 under RCP 4.5 and e. Future projections according to MIROC5 under RCP 8.5.
Discussion
Species potential distribution is driven by biotic and abiotic factors with climate playing a determinant role (Walther, 2003, Adomou et al., 2006, Sommer et al., 2010). There are evidences that change in climate will Hounkpèvi et al.
affect distribution of several species (IPCC, 2007, Busby et al., 2010). Species distribution modelling (SDM) are widely used to determine habitat suitability patterns at large spatial scales and to produce spatially explicit and comprehensive maps that are particularly useful for identifying areas where conservation efforts are most needed or effective. Generally, these SDM techniques taking into account information on habitat requirements derived from known occurrence sites are widely used to predict potential habitat of species under current or possible future conditions. Even if these models can not indicate the realised niche, they provide relevant habitat suitability information for a given species and can guide sustainable management plans (Phillips et al., 2006, Sommer et al., 2010, Schwartz, 2012). This information on the derived distribution map are useful in identifying suitable areas for cultivation and assessing conservation status of target species by protected areas network (Schwartz, 2012, Fandohan et al., 2013, Tantipisanuh et al., 2016).
Here, Maximum entropy algorithm (Ma x Ent), one of the most used SDM techniques, was used to assess habitat suitability for cultivation and in situ conservation of V. doniana by PAN under current and future (2050) climatic conditions. The future climatic conditions considered were the projections of the Met Office climate model (Had GEM2-ES) and the Model for Interdisciplinary Research on Climate Change (MIROC5) under RCP 4.5 and RCP 8.5. These climatic models projected significant changes in the
