

INTRODUCTION


• Multiple myeloma (MM), the second-most common hematologic malignancy in the Western World, occurs two to three times more frequently in Black people, making it the most common hematologic malignancy among said patient population.
• Bortezomib is the standard treatment regimen, however, it can also induce peripheral neuropathy (PN).
• In accordance with these two factors, we sought to investigate whether extant research had studied any racial difference in the incidence of Bortezomib-induced peripheral neuropathy (BIPN).
• Furthermore, we searched for other promising areas for preventing BIPN and how it might be applied to Black patient populations.

• We conducted background literature reviews on research that focused on PN and the use of bortezomib as part of the standard induction regimen.
• We also found studies that identified the comorbid conditions that should be screened along with the genetic markers that seem to have a connection to BIPN.


Diandra G. B. Adu Kyei, BA , Tondre Buck, MD2 School of Medicine, Meharry Medical College, Nashville, TN, 2Department of Hematology/Oncology, Spartanburg Medical Center, Spartanburg,
SC

Incidence of Bortezomib-Induced Peripheral Neuropathy


• Analyses of DNA samples (from whole blood) were limited to those from Caucasian patients as they formed the largest homogenous population in the Favis et al. paper.
• In the Corthals et al. study, DNA samples (from peripheral blood nucleated cells or CD138 negative bone marrow cells) similarly excluded 15 patients of non-European descent to ensure homogeneity of allelic frequencies.
• The studies specifically did not include non-European subjects, which means that these genes may not manifest in minority populations.
Patients with BIPN
• The incidence of BIPN was higher in the Black group (46%) than in the non-Black group (34%), and in a multivariate regression analysis, Black race was associated with a significantly increased risk (p = 0.047) of BIPN.
• In addition, the following genetic markers were found to be associated with BIPN: single-nucleotide polymorphisms (SNPs) associated with immune function (CTLA4 rs4553808, CTSS rs12568757), reflexive coupling within Schwann cells (GJE1 rs11974610), drug binding (PSMB1 rs1474642), and neuron function (TCF4 rs1261134, DYNC1I1 rs916758).


• Patients of color need to be more intentionally researched in order to have their needs adequately assessed.
• Additional genetic testing during routine MM blood analysis would help further identify significant variables in BIPN development.
• After testing has proactively identified comorbidities, relevant SNPs, and overall risk of PN, alternative prescriptions and courses may need to be considered to bridge the treatment gap.
• In addressing MM among Black patients, the increased incidence rate of BIPN demonstrates that it is critical to avoid the onset of secondary issues–to which they also remain vulnerable–through thorough and holistic screening


Background

Multiple myeloma, a hematological malignancy, remains a significant healthcare challenge despite advances in treatments like bispecific antibodies (Kumar et al., 2019; Mikhael et al , 2020) Racial disparities, particularly between Black and white patients, significantly impact multiple myeloma outcomes (Kumar et al., 2019). Black patients often face worse clinical outcomes due to social determinants of health (SDOH) such as socioeconomic status, education, and healthcare access (Williams et al , 2018).
SDOH significantly affect a patient's quality of life (QoL), influencing both physical functioning and psychological wellbeing (Hwang et al., 2018; Palumbo et al., 2020). This study aims to understand the impact of SDOH on treatment outcomes and QoL in Black and white patients receiving bispecifics for multiple myeloma, highlighting the need for strategies to improve health equity
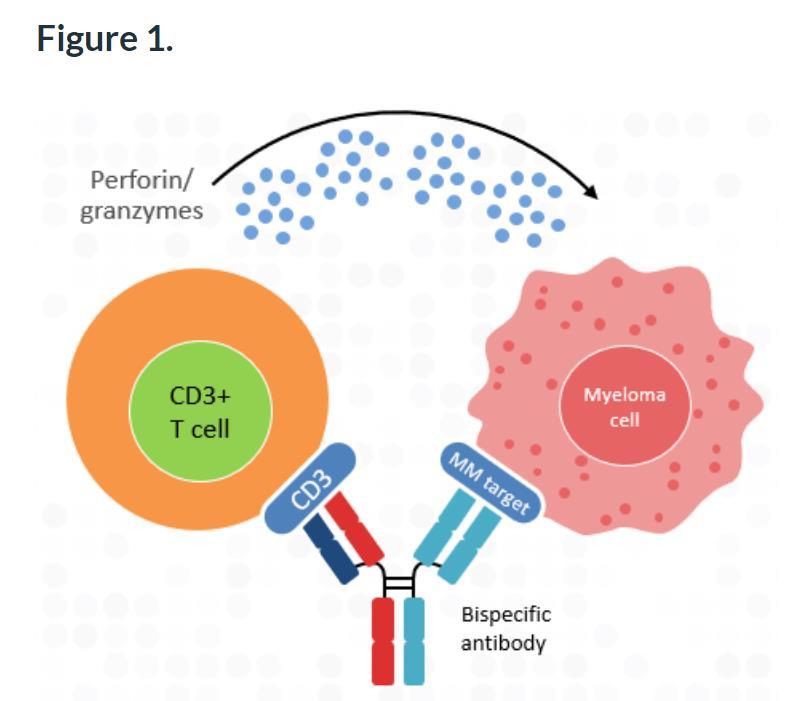
What are Bi-Specifics?
Principle Using genetically engineered antibodies to bind myeloma cells and T cells, enhancing immune cell destruction of cancer cells
Ferdinand Anokwuru1, Monique Hartley-Brown2
Charles R. Drew University of Medicine and Science, Los Angeles, CA1 Dana-Farber Cancer Institute, Boston, MA USA2
Methods
• Study Design: Retrospective analysis of medical records and healthcare data.
• Study Population:
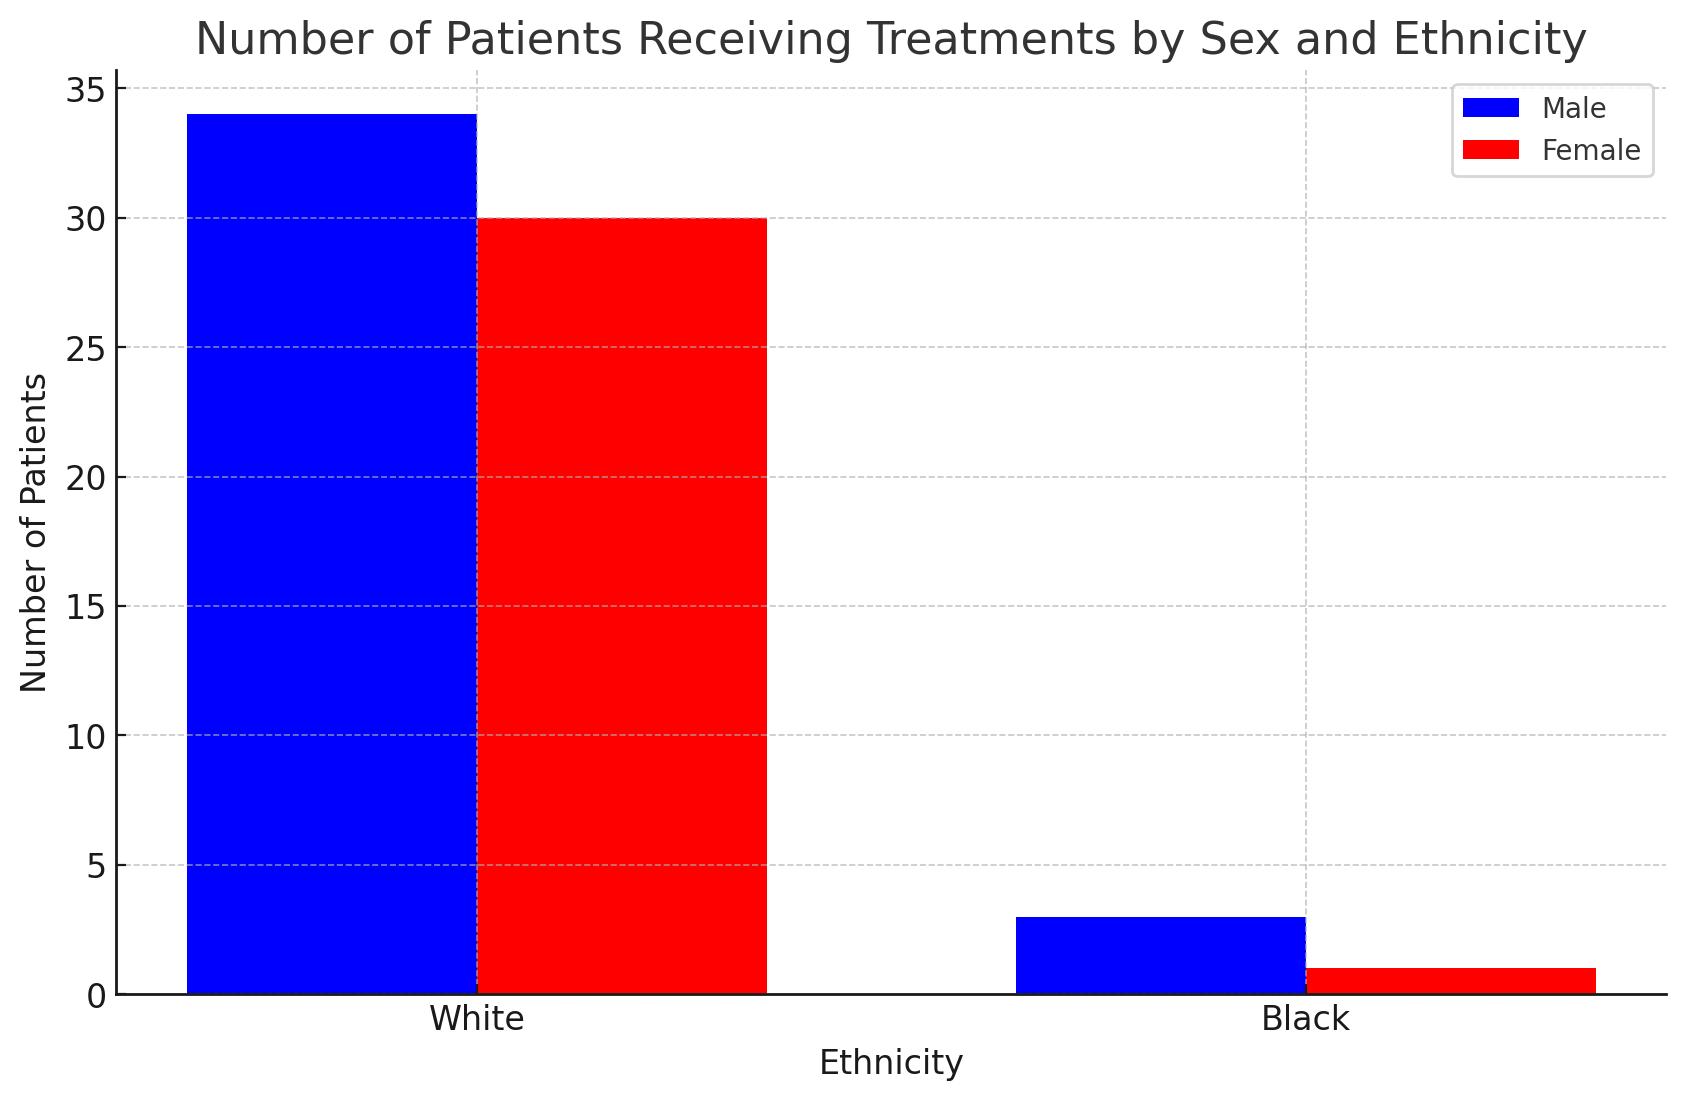
– 69 patients treated with teclistamab for multiple myeloma.
– Racial composition: 65 White patients (34 males, and 31 females), and 4 Black patients (3 males, and 1 female).
– Age range: For white patients (Ages 49 to 82), and for black patients (Ages 59 to 81).
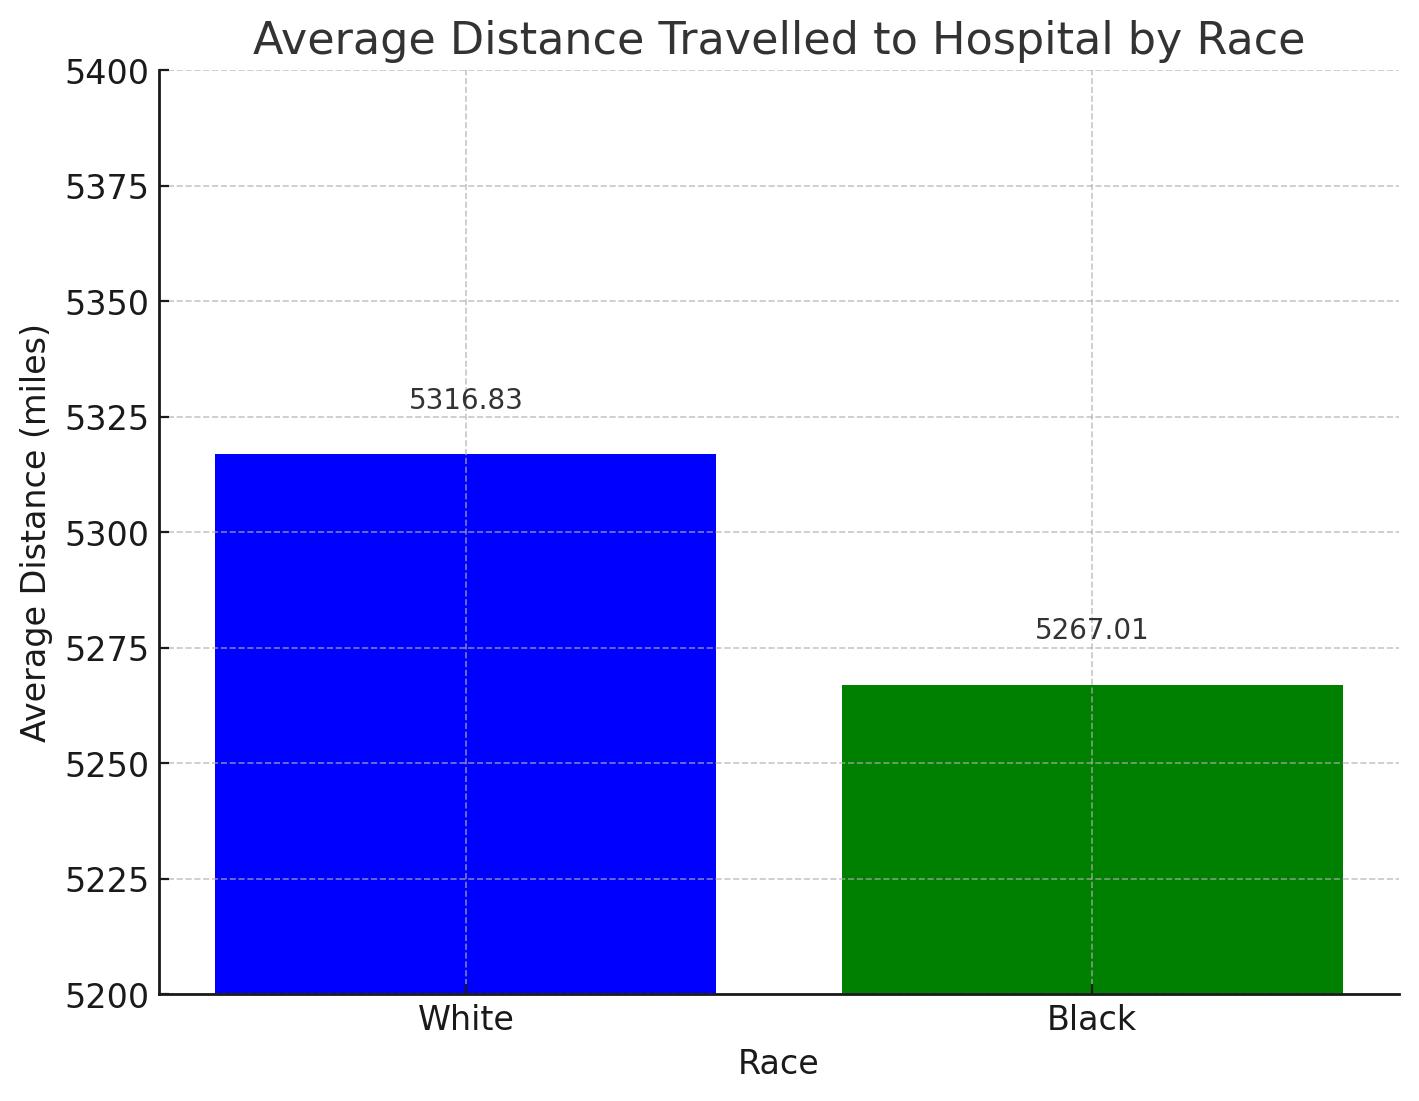
Travel Distance Data:
• White patients:
• Average distance: 5316.83 miles.
• Median distance: 5272.19 miles.
• Range: 572.80 miles (Farthest patient’s distance from hospital – Nearest patient’s distance from hospital)
• Black patients:
• Average distance: 5267.01 miles.
• Median distance: 5258.31 miles.
• Range: 121.97 miles (Farthest patient’s distance from hospital – Nearest patient’s distance from hospital)
Results Conclusions
Key Findings:
• There are higher numbers of white patients undergoing novel therapy.
• It is unclear if black patient’s stay closer or further to hospital (DFCI), due to the limited number of black patients in our data.

Preliminary findings show that we have less black patients going to treatment centers. More data is needed to draw any conclusive statements for our study
✓ We need more real world trials to evaluate differences by race in terms of access to care for individuals
✓ Increase patient education and community outreach about available treatments.
• Boost Immune system
• Improves Treatment Efficacy
Adverse effect
• Severe Immune reactions
• Cytokine release syndrome(CRS)
• Susceptibility to Infections
• Limited access could impact treatment options, or outcomes.
Cautions:
• Preliminary findings should be interpreted with caution due to the small sample size of Black patients.
✓ Enhance data collection on social determinants and focus research on minority challenges.
✓ Conduct studies on the long-term impacts of social determinants on health outcomes.
✓ Advocate for health equity policies and research funding to address disparities.
• International Myeloma Foundation
• W. Montague Cobb/NMA Health Institute
• Dana-Farber Cancer Institute
• Dr. Monique Hartley-Brown Acknow
References


Multiple myeloma is a hematologic malignancy characterized by the abnormal plasma cell proliferation in the bone marrow. Management involves a complex treatment regimen with various medications and often lifelong therapy While advancements in multiple myeloma treatment have improved patient outcomes, disparities continue to persist in treatment utilization and adherence, particularly with underserved populations experiencing lower survival rates and limited care access. This retrospective comparative analysis seeks to identify and address such disparities in medication adherence and treatment access among multiple myeloma patients
Using data from the All of Us Research Program under the National Institute of Health, 1,414 patients diagnosed with multiple myeloma were studied Factors analyzed include pharmacy drug access, treatment modalities, and qualitative survey responses on healthcare access The pharmacy drugs assessed include lenalidomide, dexamethasone, melphalan, bortezomib, daratumumab, and pomalidomide, while treatment modalities encompass chemotherapy, immunotherapy, and stem cell transplantation
Survey responses measured medication adherence and access The findings of this study revealed that there are significant disparities in healthcare access, medication adherence, and affordability among racial groups, with underserved populations exhibiting lower rates Moreover, disparities in drug utilization may stem from differences in access to healthcare services, prescription practices, or patient preferences among different racial groups Further investigation is needed to understand the underlying factors driving these disparities Addressing these disparities is crucial for achieving equitable access to healthcare for all individuals, irrespective of race or ethnicity
This study employed a retrospective comparative analysis design to examine the role of healthcare access and socioeconomic factors in myeloma treatment utilization and adherence The study population comprised of individuals diagnosed with multiple myeloma within the All of Us Research Program cohort, stratified by self-reported racial and ethnic categories Data was retrieved from electronic health records sourced from the National Institute of Health Researcher Workbench dataset.
Variables of interest included patient demographics, the distribution of prescribed drugs, survey responses on pharmacy drug access metrics (adherence, prescription fill rates, costs), and additional treatment modalities (chemotherapy, immunotherapy, stem cell transplantation Descriptive statistics were used to characterize the study population and assess disparities in medication use and adherence among various racial and ethnic groups Clinical trial participation, stem cell transplants, and CAR-T therapy were queried, but insufficient information was collected to draw definitive conclusions on these variables
Saron Araya, Dr. Winston Price, MD, Dr. Cesar Rodriguez, MD
International Myeloma Foundation, W. Montague Cobb NMA Health
Icahn School of Medicine at Mount Sinai - The Tisch Cancer Institute
National Institutes of Health - All of Us Research Program


Figure 1: Racial Composition of Multiple Myeloma Patients Enrolled in the All of Us Program


The pie chart illustrates the racial distribution of patients who


Figure 3 Myeloma Prescription Drug Distribution Across Racial Groups The horizontal x-axis illustrates the types of drugs under assessment Lenalidomide, Dexamethasone, Pomalidomide, Melphalan, Bortezomib, and Daratumumab The vertical y-axis indicates the percentage of individuals with multiple myeloma prescribed each medication The red bar represents Black or African American individuals The yellow bar represents White individuals The
represents other races including Middle Eastern/North African, Asian, etc Lenalidomide and Dexamethasone are taken orally by the patient Bortezomib, Daratumumab, and Pomalidomide are administered by a physician either as a subcutaneous injection or intravenously (IV)


Access to pharmacy drugs and treatment is critical for managing multiple myeloma effectively This study aimed to uncover racial disparities in drug access among multiple myeloma patients. Findings showed underserved populations have decreased healthcare access, lower medication adherence, and affordability problems Among the studied medications, lenalidomide, pomalidomide, and dexamethasone are taken orally, giving patients control over their treatment In contrast, bortezomib and daratumumab require subcutaneous injection or intravenous (IV) infusion administered by a physician, which reduces patient control over compliance Melphalan can be administered orally or IV Our target population did not adhere to prescribed oral medication, possibly due to high deductibles, insurance limitations, or patient preferences Interestingly, IV drugs like bortezomib and daratumumab were also used less in underserved patients, suggesting the physician did not offer such agents or the patient opted out of them
Participation of underserved populations in the All of Us Program health data contributions and the qualitative surveys is notably lower, hindering efforts to address health disparities affecting these communities Without adequate representation, it becomes challenging to uncover underlying factors contributing to these disparities and limits our understanding of how certain diseases, treatments, and health outcomes vary across different racial and ethnic groups Qualitative survey findings indicate that underserved participants encounter more frequent financial obstacles when trying to access prescribed medications Overall, effective multiple myeloma treatment requires consistent medication adherence, irrespective of how they are administered The underrepresentation of our target population in medication usage highlights potential gaps in healthcare access, affordability, and quality of care Addressing these disparities is essential for improving
equity in multiple myeloma Future research should focus on obtaining comprehensive
participants, stem cell transplants, and new therapies like CAR-T and advanced immunotherapies


• How long is time to treatment for CAR T cell therapy?
• How long is time to treatment for CAR T cell therapy?
• Is there an observable, statistical difference in time to CAR T treatment for patients based on measurable patient characteristics?
• Is there an observable, statistical difference in time to CAR T treatment for patients based on measurable patient characteristics?
This retrospective single center study included 84 RRMM patients who underwent apheresis for idecabtagene vicleucel (Ide-Cel) between 11/2018 and 02/2023 at MD Anderson as standard of care (SOC) or on clinical trials (KarMMa 2, KarMMa 3).
This retrospective single center study included 84 RRMM patients who underwent apheresis for idecabtagene vicleucel (Ide-Cel) between 11/2018 and 02/2023 at MD Anderson as standard of care (SOC) or on clinical trials (KarMMa 2, KarMMa 3).
• Data on demographics, disease features, prior treatment, comorbidities via a revised HCT-CI score, time to treatment, and followup were extracted from medical records.
• Data on demographics, disease features, comorbidities via a revised HCT-CI score, prior treatment, time to treatment, and follow-up were extracted from medical records.
• Area Deprivation Index (ADI) was measured based on zip code at time of CAR- T referral. Comparisons across racial/ethnic groups utilized chi-squared tests and ANOVA.
• Area Deprivation Index (ADI) was measured based on zip code at time of CAR T referral. Comparisons across racial/ethnic groups utilized chi-squared tests and ANOVA.
• Four time to treatment durations were calculated (Figure 1). Time to treatment comparisons were conducted using two-sample t-tests and ANOVA with Tukey post-hoc analysis.
• Four time to treatment durations were calculated (Figure 1). Time to treatment comparisons were conducted using two-sample t-tests and ANOVA with Tukey post-hoc analysis.
Table 1 Time to Treatment by Insurance Type
Time from diagnosis to infusion was longer for patients with Medicare, there's about a 2year difference.
Figure 2 Time to Apheresis by Race/Ethnicity Days from Apheresis to Infusion were significantly higher in non-White patients.
Table. 2 Time to Treatment by Prior Lines
Patients that had 5 or more prior lines of therapy for RRMM experienced almost a 4-year long difference in time from diagnosis to infusion.
• Timelines for non-White RRMM patients are observably longer for CAR T cell therapy
• Patients with Medicare insurance and those with higher numbers of prior lines of therapy faced an average delay of approximately 2 years from diagnosis to infusion as compared to their white counterparts
• While limited in scale, the study provides valuable insights into emerging disparities in CAR T-cell therapy access and timelines
• Future research should focus on factors affecting patient recommendation for CAR T therapy and understanding the underlying causes of these delays
• Further research may draw a connection between ADI and time to CAR T therapy.
Bethelehem Gebre, BS1 and Ajay K. Nooka, MD MPH2
• Significantly higher incidence rates of plasma cell disorders (PCDs) and T-cell lymphomas (TCLs) were reported among blacks compared to whites in the United States
• Survival differences by race among both PCDs and TCLs highlight the need for understanding the biological differences by race, and the need for improved access to innovative care that provides the survival benefit, for minorities
• More recently, two B-cell maturation antigen (BCMA)-directed chimeric antigen receptor (CAR) T-cell therapies were approved for treating myeloma, a PCD - Carvykti (ciltacabtagene autoleucel) for patients with relapsed myeloma that have been treated with ≥1 line of therapy and Abecma (idecabtagene vicleucel) for patients treated with ≥2 lines of therapy Both the CARTs have proven therapeutic superiority in extending progression free survival (PFS) compared to the standard of care options from the randomized control trials (RCTs) –CARTITUDE-4 and KarMMa-3.
• The Food and Drug Administration (FDA) has mandated a black box warnings for BCMA-CAR-T cell therapies following reports of increased risk of TCL following CART administration.
• Unfortunately, the true nature and frequency of the TCLs following BCMA-CART cell therapy are yet to be fully discerned.
• To describe the incidence rates of the PCD and TCL
• To describe the overlap of the concomitant diagnosis of PCD and TCL that would predispose PCD patients for TCL following BCMA-CART administration
• To describe the racial differences in the incidence of the concomitant malignancies of PCD and TCL
• First, we have interrogated the National Cancer Institute (NCI) supported Surveillance, Epidemiology, and End Results (SEER) database to understand the incidence rates of PCDs and TCLs in the United States The SEER 22 database that covers incident cases from 2000 to 2021 representing approximately 48 percent of the U S population, was used for this analysis
• Next, the concomitant cases of myeloma and TCL were identified.
• Then, we evaluated the differences of incidence of the concomitant cases by race to understand the epidemiological distribution.
• Patients were identified based on the International Classification of Disease for Oncology version 3 (ICD-O-3) morphological codes for PCD – 9732/3: multiple myeloma (MM), 9734/3: Extraosseous MM and 9731/3: Solitary plasmacytoma of bone
• ICD-O-3 codes for TCL were - 9702/3: Peripheral TCL, NOS (PTCL-NOS), 9701/3: Sezary syndrome, 9688/3: T-cell histiocyte-rich large B-cell lymphoma, 9705/3: Angioimmunoblastic TCL (ATCL), 9708/3: Subcutaneous panniculitis-like TCL, 9709/3: Primary cutaneous TCL (PCTCL), 9714/3: Anaplastic large cell lymphoma (ALCL), ALK-positive, 9715/3: Anaplastic large cell lymphoma (ALCL), ALK-negative 9716/3: Hepatosplenic TCL, 9718/3: Primary cutaneous ALCL, 9719/3: Extranodal NK-/TCL, nasal type, 9724/3: Systemic EBV-positive T-cell lymphoproliferative disease of childhood, 9726/3: Primary cutaneous gamma-delta TCL, 9729/3: Precursor T-cell lymphoblastic lymphoma, NOS (OBS 2010+) see 9837/3, 9827/3: Adult TCL, and 9831/3: T-cell large granular lymphocytic leukemia (LGL)
• First malignant index records of myeloma as well as T cell lymphomas were cross checked and validated.
% T-cell lymphoma cases identified using ICD-O-3 morphological codes
9688/3: T-cell histiocyte-rich large B-cell lymphoma
9701/3: Sezary syndrome
9702/3: Peripheral T-cell lymphoma, NOS
9705/3: Angioimmunoblastic TCL
9708/3: Subcutaneous panniculitis-like TCL
9709/3: PCTCL
9714/3: ALCL, ALK-positive
9715/3: ALCL, ALK-negative
9716/3: Hepatosplenic TCL
9718/3: Primary cutaneous ALCL
• Myeloma as the first malignant primary indicator was higher in blacks than whites (85.7% vs 82.9%, p<0.001).
• Similarly, T-cell malignancy as the first malignant primary indicator was higher in blacks than whites as well (86.3% vs 81.8%, p<0.001).
• A total of 190 cases of TCLs were reported as concomitant malignancies with PCDs (PTCL-NOS – 25.3%, T-LGL –25.3%, ATCL – 13.2%, PCTCL – 12.6%, ALCL – 8.9% were the predominant TCLs).
• The incidence of concomitant diagnosis of MM and TCL among the whites (males – 0.105%; females – 0.053%) and among blacks (males – 0.075%; females –0.108%).
9731/3: Solitary plasmacytoma of bone
9732/3: Plasma cell myeloma
9734/3: Extraosseous plasmacytoma
• The incidence rates of concomitant diagnosis of PCD and TCL was 0.086%, less than 8 case per 10000 cases of PCD, similar to the reported TCLs post BCMA administration leading to the black-box warning.
• The relative risk of developing a concomitant PCD and TCL among white females is lower compared to white males or black males and females.
• Nevertheless, this analysis doesn’t account for indolent concomitant T-cell clonal process.
• This analysis highlights that concomitant processes of PCD and TCL can coexist, and effort should be made to screen for likely T cell clonal processes for myeloma patients being considered for BCMACART therapy to minimize their risk of a secondary TCL.


Yasmine Griffiths, Tala Shekarkhand, Andriy Derkach, Sridevi Rajeeve, Carlyn Tan, Sham Mailankody, Ross Firestone, Eric Jurgens, Kevin Miller, Neha Korde, Urvi Shah, Hamza Hashmi, Hani Hassoun, Malin Hultcrantz, David Chung, Sergio Giralt, Gunjan Shah, Alex Lesokhin, Saad Z. Usmani
• Multiple myeloma (MM) is a plasma cell neoplasm that accounts for 10% of hematologic cancers overall and is the most common blood cancer in Black Americans1 .
• The median age of diagnosis is 69 years and the etiology of disparities in incidence rates is largely unknown. However, race, age, gender, family history, and exposure to toxins are considered known risk factors2–4
• The survival of MM has more than quadrupled in the past two decades. More recently, T-cell redirecting therapies including bispecific antibodies (BsAb) and chimeric antigen receptor (CAR) T-cell therapies have shown particular promise for the treatment of MM5–8 .
• While the emergence of BsAbs and CAR T-cell therapies appear to be revolutionizing the MM treatment landscape in the US, little is known about access, utilization, and responses to these treatments across racial and ethnic groups9
• Few studies have thoroughly explored racial and ethnic disparities in outcomes associated with bispecific and CAR T-cell therapies.
• In this single-center study, we compared outcomes of patients treated with CAR T-cell therapy and commercial bispecific antibody therapy based on race and ethnicity.
• We performed an IRB-approved retrospective analysis of clinical outcomes for 254 patients with relapsed/refractory multiple myeloma who received CAR Tcell therapy or commercial bispecific antibody therapy at Memorial Sloan Kettering Cancer Center (MSKCC) between March 22, 2017, to May 17, 2024.
• All analysis was performed using the CRAN R version 3.3.0 (The R Foundation for Statistical Computing, Vienna, Austria). Disease characteristics analyzed include time since diagnosis, revised International Staging System (R-ISS) stage, cytogenetic risk, presence of extramedullary disease (EMD) and heavy and light chain isotypes. Outcomes assessed include overall therapy response rate and progression-free survival (PFS) and overall survival (OS) as per IMWG guidelines10
• We saw a statistically significant relationship between mean age of patient during treatment and race, with both Black and White populations having an older mean age compared to Asians (P<0.05). However, there was no statistically significant difference in mean age between Hispanic and non-Hispanic groups. There was no significant difference in the number of prior lines of therapy used or presence of extramedullary disease among racial or ethnic groups.
• There was a significant difference in type of therapy compared across racial groups:
• CAR T-cell therapy: 16 (11.4%) were Black, while 110 (78.6%) were White, 7 (5%) were Asian, and 7 (5%) identified as other or were unidentified.
• Talquetamab: 4 were Black, 10 were White, 3 were Asian, and 3 identified as other/unidentified.
• Teclistamab/Elranatamab therapy:16 were Black, while 71 were White, 2 were Asian, and 5 identified as other or were unidentified (p=0. 0475).
• 36% of Hispanic patients received CAR T therapy, 9% received Talquetamab therapy, and 55% received Teclistamab/Elranatamab. 57% of non-Hispanic patients received CAR T-cell therapy, 8% received Talquetamab therapy, and 35% received Teclistamab/Elranatamab (p= 0.25987).
• There was no statistically significant difference in overall response rates. The overall response rates with all T-cell redirecting therapies were 56% in Black, 65% in White, 75% in Asian, 60% in pts who identified as other or were unidentified (p=0.3848). Overall response rate in Hispanic patients was 55% and 69% of non-Hispanic patients (0.3286). The VGPR or better rates with T-cell redirecting therapies were 42% in Black, 50% in White, 67% in Asian, and 40% in pts who identified as other or were unidentified (p=0.3103).
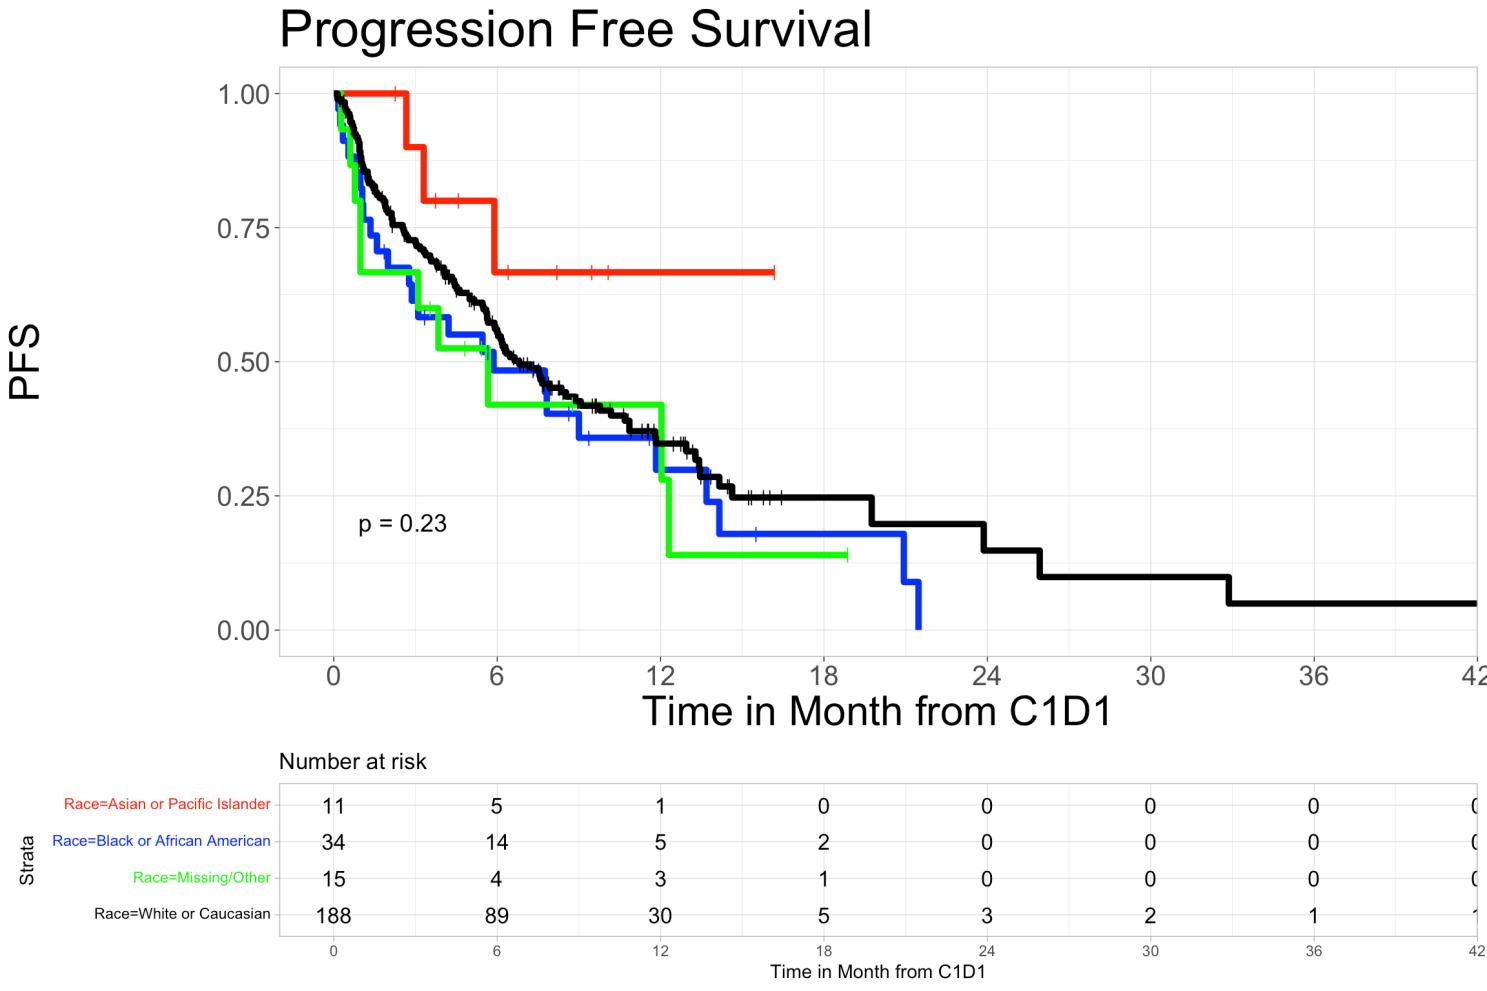
• The 6-month and 12-month Progression-Free Survival rates with T-cell engaging therapies were 48.4% (95%CI, 33.9%-69.1%) and 29.9% (16.2%-55.0%) in Black patients, 55.4% (95% Cl 48.5%63.3%) and 34.7% (95% CI 27.6%-43.8%) in Whites, 66.7% (95% CI 41.5%-100%) and 66.7% (95% CI 41.5%-100%) in Asian patients, and 42% (95% CI 21.8%-81.0%) and 42% (95% CI 21.8%-81.0%) in patients who identified as other or were unidentified, respectively (P=0.23).
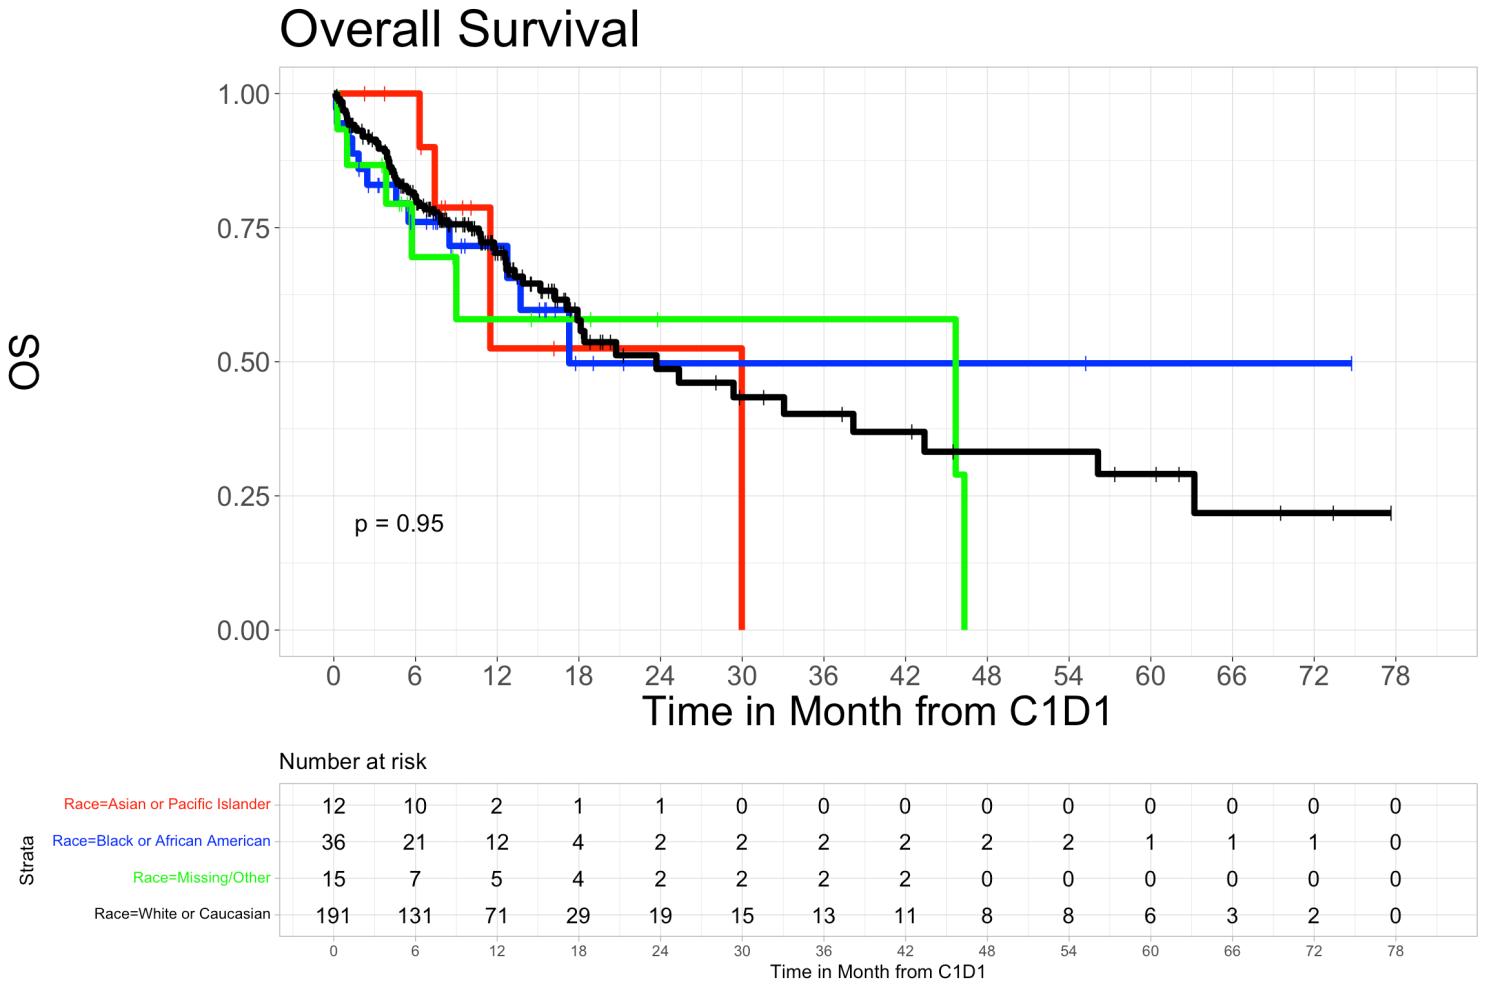
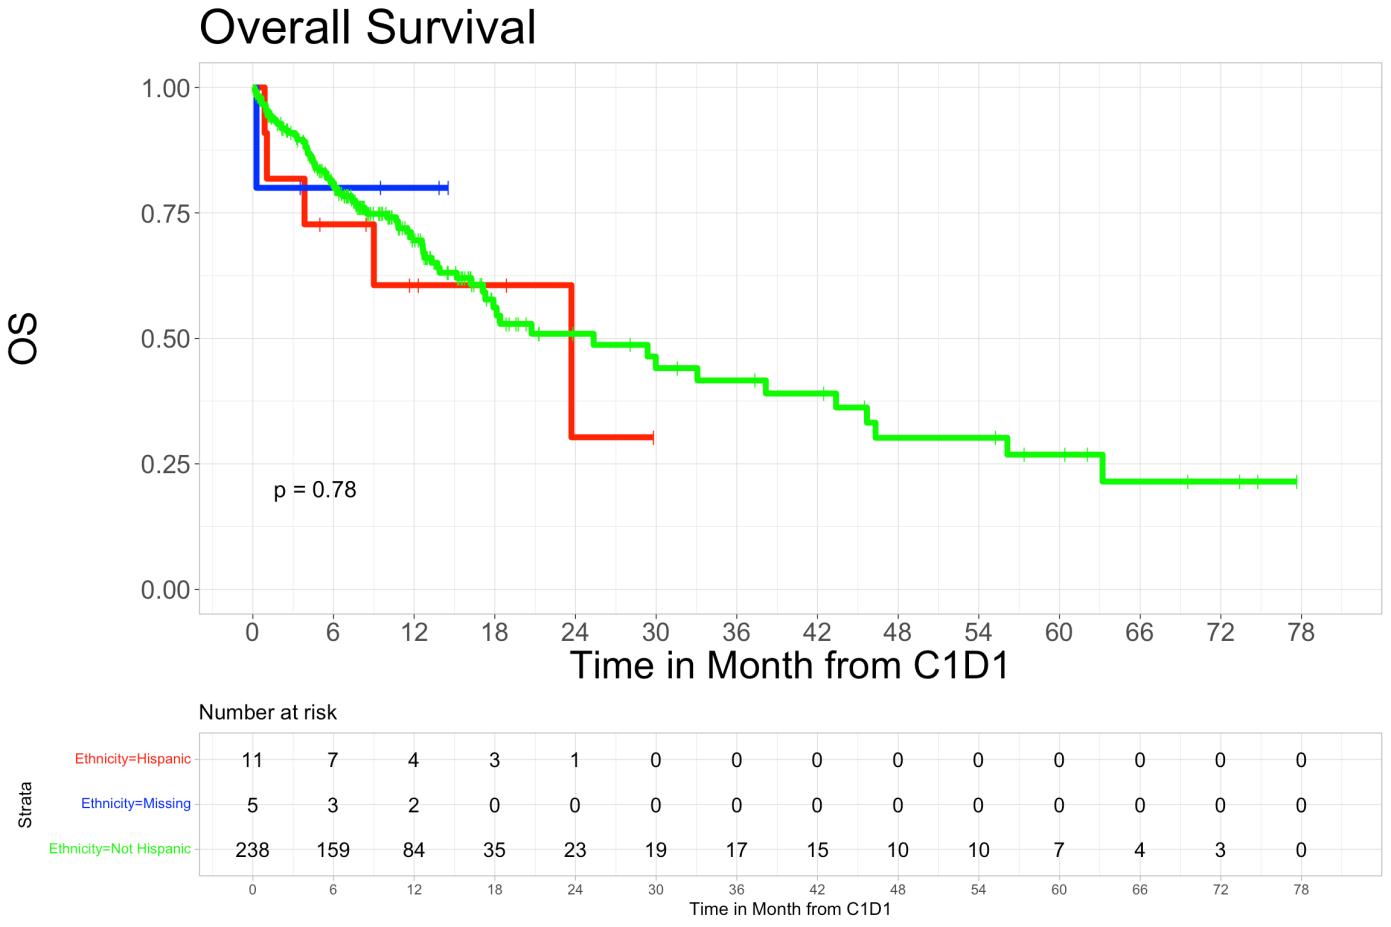
• The overall survival rates for Black patients were 76.1% (95% CI 62.8%-92.2%) at 6 months and 71.6% (95% CI 57.1%-89.7%) at 12 months. For Asian patients, overall survival was 100% (95% CI 100%-100%) at 6 months and 52.5% (95% CI 22.1%-100%) at 12 months. In White patients, overall survival at 6 months was 80.9% (95% CI 75.3%-86.9%) and 70.3% (95% CI 63.4%-78.0%) at 12 months. In patients who identified as other or were unidentifiable, overall survival was 69.5% (95% CI 48.0%-100%) at 6 months and 57.9% (95% CI 34.6%-96.9%) at 12 months (p=0.95).
• Overall survival in Hispanic patients at 6 months was 72.7% (95% CI 50.6%-100%), and 60.6% (95% CI 36.4%-100%) at 12 months, while in non-Hispanic patients’ overall survival at 6 months was 80.9% (95% CI 75.9%-86.3%) and was 69.5% (95% CI 63.2%-76.6%) at 12 months (p=0.78). We did not observe a statistically significant difference in PFS and OS rates among different racial or ethnic groups.
• Progression-free survival rates in Hispanic patients were 27.3% (95% CI 10.39%-71.6%) at 6months and 18.2% (95% CI 5.19%-63.7%) at 12-months and 55.6% (95% CI 49.3%-62.7%) in nonHispanic at 6-months and 36.0% (95% CI 29.3%-44.2%) at 12-months (p=0.29).
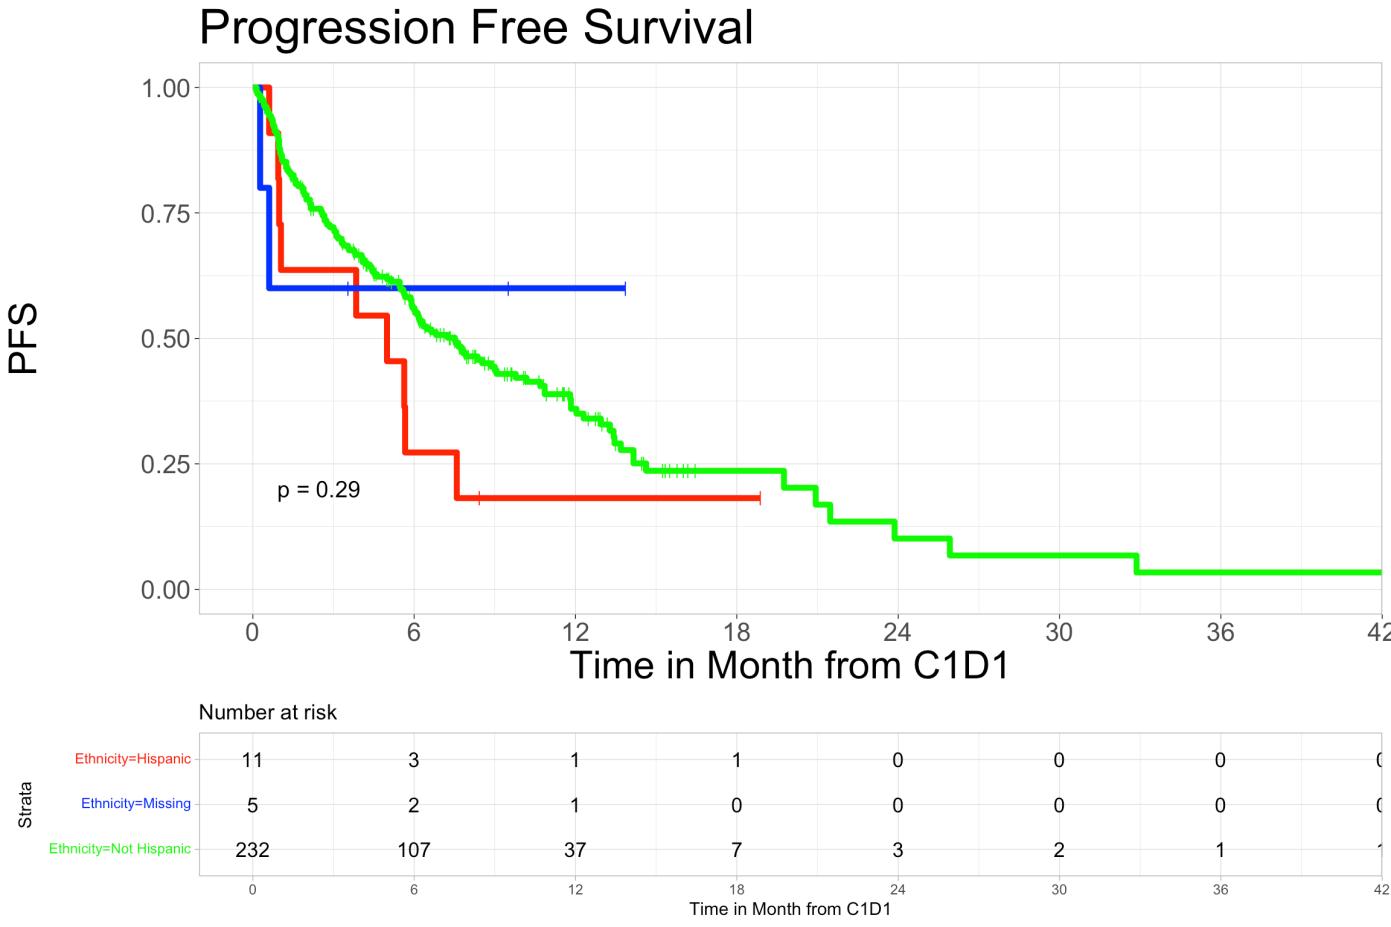
• Overall survival and progression-free survival showed no significant difference across ethnic groups.
• Overall, we saw no statistically significant difference in overall response rates to Tcell redirecting therapies when stratified by patient race. Neither bispecific antibody therapies nor CAR T-cell therapies showed disparate response rates in Black populations when compared to their White counterparts. This demonstrates a promising future for bispecific and CAR T therapies. However, only 14% of this overall cohort was comprised of Black or African American patients. A more robust study across multiple centers with increased diversity may provide further insight into racial disparities in care and outcomes.
• This study highlights the urgent necessity for equitable treatment options and access to care across all populations. Historically, Black populations in the US have been marginalized and faced difficulties receiving the newest and highest quality treatments. As such, Black individuals have experienced increased burden and severity of many diseases, including multiple myeloma
• This single center study shows no statistically significant difference in therapy response or outcomes. Thus, we must continue to invest resources into equitable health care along the multiple myeloma care continuum including access to novel treatment options, additional supportive care, and improved responses to treatment.
1. Alexanian Raymond, Dimopoulos Meletios. The Treatment of Multiple Myeloma. N Engl J Med 1994;330(7):484-489. doi:10.1056/NEJM199402173300709
2. Smith CJ, Ambs S, Landgren O. Biological determinants of health disparities in multiple myeloma. Blood Cancer J. 2018;8(9):17. doi:10.1038/s41408-018-0118-z
3. Marinac CR, Ghobrial IM, Birmann BM, Soiffer J, Rebbeck TR. Dissecting racial disparities in multiple myeloma. Blood Cancer J. 2020;10(2):1-8. doi:10.1038/s41408-020-0284-7
4. Padala SA, Barsouk A, Barsouk A, et al. Epidemiology, Staging, and Management of Multiple Myeloma. Med Sci. 2021;9(1):3. doi:10.3390/medsci9010003
5. Caraccio C, Krishna S, Phillips DJ, Schürch CM. Bispecific Antibodies for Multiple Myeloma: A Review of Targets, Drugs, Clinical Trials, and Future Directions. Front Immunol 2020;11. doi:10.3389/fimmu.2020.00501
6. Nath K, Mailankody S, Usmani SZ. The Role of Chimeric Antigen Receptor T-Cell Therapy in the Era of Bispecific Antibodies. Hematol Oncol Clin North Am. 2023;37(6):1201-1214. doi:10.1016/j.hoc.2023.05.011
7. Firestone RS, Mailankody S. Current use of CAR T cells to treat multiple myeloma. Hematol Am Soc Hematol Educ Program 2023;2023(1):340-347. doi:10.1182/hematology.2023000434
8. Firestone R, Lesokhin AM, Usmani SZ. An Embarrassment of Riches: Three FDA-Approved Bispecific Antibodies for Relapsed Refractory Multiple Myeloma. Blood Cancer Discov. 2023;4(6):433-436. doi:10.1158/2643-3230.BCD-23-0176
9. Gasoyan H, Fiala MA, Doering M, Vij R, Halpern M, Colditz GA. Disparities in Multiple Myeloma Treatment Patterns in the United States: A Systematic Review. Clin Lymphoma Myeloma Leuk 2023;23(11):e420-e427. doi:10.1016/j.clml.2023.08.008
10. Kumar S, Paiva


• Multiple Myeloma (MM) is a hematologic malignancy, usually of older adults and with a predilection for African Americans
• Patients often undergo series of remission and relapses
• BCMA-directed chimeric antigen receptor (CAR) T-cell therapies such as idecabtagene vicleucel (ide-cel) and ciltacabtagene autoleucel (cilta-cel) are highly effective immunotherapies for advanced MM, but can take 3-4 months to manufacture due to long:
• Brain-to-vein time (B2V): Seeking insurance approval to T-cell collection
• Vein-to-vein time (V2V): T-cell harvest to infusion
This study analyzed B2V and V2V times for CAR T-cell therapy in MM, their interaction with insurance status and disease characteristics, and their impact on outcomes
• Retrospective study of 64 consecutive insured patients at the University of Chicago
• All patients were collected for commercial CAR T-cell therapy between April 2021 and June 2024
• Patients stratified by insurance type (private vs Medicare)
• Demographics and disease characteristics were recorded
• Fishers exact test was used for comparison of categorial variables and Mann-Whitney test for continuous variables
• Cox proportional hazard models estimated hazard ratios (HRs) for progression-free survival (PFS) and overall survival (OS), indexed from the time of T-cell collection.

Tyra

Vein-Vein
Characteristic Medicare (N=40)
• 1/10 (10%) patients with B2V ≤ 15 days died before receiving CAR T-cells vs. 9/54 (17%) with B2V > 15
• 2/10 (20%) patients with B2V ≤ 15 days died from CAR T-cell therapy vs. 6/54 (11%) with B2V > 15
(0.1-0.6, p=0.001)
(0.1-0.7, p=0.007)
1.1 (0.5-2.3, p=0.7) 1.5 (0.6-3.9, p=0.4) 2.0 (0.8-5.3, p=0.1) 2.2 (0.6-8.6, p=0.2)
ISS 1.0 (0.6-1.6, p=0.9) 1.0 (0.6-1.9, p=0.8) 1.0 (0.6-1.6, p=0.9) 1.2 (0.6-2.5, p=0.6)
ECOG PS 3.4 (2.0-5.8, p<0.001) 4.4 (2.4-8.2, p<0.001) 4.9 (2.0-12, p<0.001) 7.8 (2.6-23.8, p<0.001)
Aggressive Features 3.6 (1.6-7.9, p=0.002) 4.5 (1.5-13.4, p=0.008) 3.5 (1.3-9.2, p=0.013) 2.8 (0.8-10.9, p=0.1)
Prior BCMA 3.2 (1.5-6.8, p=0.004) 1.4, (0.5-4.0, p=0.5) 3.6 (1.4-9.4, p=0.008) 2.8 (0.8-9.5, p=0.1)
Bridging Therapy 2.8 (0.82-9.6, p=0.1) 2 (0.5-8.8, p=0.3) 2.2 (0.5-9.4, p=0.3) 0.9 (0.2-4.3, p=0.9)
LD Chemo (Flu/Cy vs Benda) 1.1 (0.5-2.4, p=0.8) 1.01 (0.4-2.9, p=0.98) 1.2 (0.5-3.4, p=0.6) 1.3 (0.3-5.5, p=0.7)
Bone marrow PC 60+% 4 (1.8-8.9, p<0.001) 4 (1.5-11.2, p=0.007) 5.4 (2-15, p=0.001) 4.1 (1.5-11.2, p=0.007)
Ferritin >Median (285) 3.3 (1.5-7.2, p=0.002) 6.7 (1.9-22.9, p=0.002) 3.8 (1.5-9.8, p=0.005) 7.7 (1.6-35.7, p=0.009)
B2V <15 days 1.1 (0.5-2.7, p=0.82) 1.4 (0.5-4.1, p=0.5)
• Patients with Medicare had numerically shorter B2V time and higher proportion had a B2V < 15
• A shorter B2V time may be associated with a lower risk of dying before receiving CAR T-cells.
• In multivariate analysis, worse PS, prior BCMA-directed therapy before CAR T, bone marrow plasmacytosis > 60% were associated with worse PFS and receipt of cilta-cel versus ide-cel was associated with better PFS. Only worse PS was associated with worse OS.
• Neither insurance type, B2V time, nor V2V time were associated with worse outcomes overall; however, these findings may be affected by restricted slot allotments causing delayed B2V time.


Introduction
Multiple
patients with MM have a higher mortality rate1-3 Additionally, prior evidence demonstrated disparities in access to innovative therapies and underrepresentation in clinical trials of Black patients with MM y Teclistamab, a first-in-class B-cell maturation antigen (BCMA) x CD3 bispecific antibody, was approved to treat patients with relapsed/refractory MM through the pivotal MajesTEC-1 trial, which included 21 (12.7%) Black patients5,6
In the real-world, recent literature demonstrated higher percentages of Black patients with MM receiving teclistamab as compared numerically to the percentage of Black patients enrolled in the MajesTEC-1 trial.7,8 Furthermore, a cross-sectional analysis of patients with newly diagnosed MM in 2021, using the All-payer Real-world Multiple Myeloma Research-ready Data (ARMMRD) registry, found that 14.7% were Black race
y To date, no known real-world study has sought to understand access and outcomes for Black patients with MM receiving teclistamab in the real-world
Objective
To understand access and outcomes for Black patients with MM, we sought to describe patient characteristics, treatment patterns, and safety outcomes in Black patients with MM receiving teclistamab in the real-world
Methods
y We performed a retrospective observational cohort study using de-identified data from the ARMMRD registry, derived from the STATinMED RWD Insights all-payer claims data (covering approximately 87% of the insured population in the US) from January 1, 2014, to January 31, 2024 (the study period)
Study population
y Adult patients (≥18 years of age) with MM who had ≥1 teclistamab claim in the ARMMRD registry between October 26, 2022, and January 31, 2024 (the identification period) were included in this study (Figure 1)
y The index date was defined as the date of the earliest outpatient claim of a teclistamab 30 mg/3 mL vial or the admission date of the earliest inpatient encounter that contained teclistamab
y Patients were required to have continuous eligibility in pharmacy and medical benefit for ≥6 months prior to index date (pre-index period)
y Patients who received teclistamab before or on October 25, 2022 were excluded
Results
Cohort identification
y Patients in the ARMMRD registry who met the following criteria were defined as having a complete step-up dosing (SUD) period:
–
Had ≥1 inpatient admission containing teclistamab or ≥1 outpatient claim for a 30 mg/3 mL vial for teclistamab; the earliest admission date (if inpatient) or claim date (if outpatient) was defined as the start date of the SUD period
– All inpatient or outpatient claims for teclistamab with a <5-day gap between claims within a 21-day continuous enrollment period were rolled up as part of the SUD period. If an index claim was outpatient, an additional outpatient claim for a 153 mg/1.7 mL vial for teclistamab
Data analysis
y Three cohorts were described: (1) overall patient population, which includes patients with unknown race, (2) Black patients, and (3) patients of other races
Demographics and clinical characteristics were captured on or during the 6-month pre-index period (the
Table 3: Treatment
Duration
This
Comparing
Table 4: CRS and ICANS among patients who completed SUD
11 (25.0) 58 (22.6)
Patients with grade 2 events, n (%) 29 (7.6) 5 (11.4) 22 (8.6)
Patients with grade ≥3 events, n (%) 3 (<1) (2.3) 2 (<1)
Patients
Patients
(28.8)
Patients with mild CRS 100 (26.0) 15 (34.1) 59 (23.0)
Patients with severe CRS 28 (7.3) 3 (6.8) 15 (5.8)
Patients with specific rwCRS symptoms per Keating algorithm
Fever 82 (21.4) 12 (27.3) 47 (18.3)
Fatigue 44 (11.5) 4 (9.1) 28 (10.9)
Hypotension 16 (4.2) 4 (9.1) 10 (3.9)
Hypoxia 4 (1) 0 (0) 3 (1.2)
Headaches (<1) 0 (0) 1 (<1)
rwICANS per ICD-10-CM codes
y
Treatment history
the
HRU during SUD
with
Table 3)
y Of 384 patients with observed complete SUD by data cutoff, 297 (77.3%) completed teclistamab SUD in inpatient admission. Of 87 patients with >1 encounter during SUD, 3 (3.4%) were all inpatient admissions, 19 (21.8%) were all outpatient admissions, and 65 (74.7%) were hybrid inpatient/ outpatient admissions with 63/65 (96.9%) initial encounters being inpatient admissions versus 2 initial encounters that were outpatient Among 44 Black patients with observed complete SUD, 43 (97.7%) had ≥1 teclistamab-related hospitalization during the SUD period; among 257 patients of other races with observed complete SUD, 242 (94.2%) had ≥1 teclistamab-related hospitalization during the SUD period
Patients ≥1 ICANS and/or other neurotoxicity event, n (%) 40 (10.4) 5 (11.4) 30 (11.7)
Patients with grade 1 events, n (%) 9 (2.3) 2 (4.5) 6 (2.3)
Patients with grade 2 events, n (%) 8 (2.1) 2 (4.5) 5 (1.9)
Patients with grade 3 events, n (%) 2 (<1) 0 (0) 2 (<1)
Patients with grade ≥4 events, n (%) 0 (0) 0 (0) 0 (0)
Patients with ICANS grade unknown or unspecified, n (%) 21 (5.5) (2.3) 17 (6.6)
ICANS per symptom codes
Patients with ≥1 ICANS symptom code 22 (5.7) 5 (11.4) 13 (5.1)
Encephalopathy 6 (1.6) (2.3) 5 (1.9)
Delirium 13 (3.4) 2 (4.5) 8 (3.1) Agitation 3 (<1) (2.3) 2 (<1) Seizure 3 (<1) 2 (4.5) 0 (0) Abbreviations: CRS, cytokine

Semegne Hiruy1 , Myra Robinson, MSPH2, Peter M. Voorhees, MD3 and Manisha Bhutani, MD3
1Wake Forest School of Medicine, Winston Salem, NC, USA , 2Data Sciences, Levine Cancer Institute, Atrium Health, Charlotte, NC, USA, 3Department of Hematologic Oncology and Blood Disorders, Atrium Health, Levine
Table 2. Disease characteristics of Black patients with MM stratified by cytogenetic profile
• Multiple Myeloma (MM) is a genetically diverse disease with varying prognosis that occurs 2-3 times more frequently in Black individuals, who also experience a lower annual percentage change in survival compared to White patients.
• The role of cytogenetic subtypes in contributing to these racial disparities remains unclear.
• Primary cytogenetic abnormalities, broadly divided into hyperdiploid and nonhyperdiploid signatures, represent multiple myeloma initiating mutations potentially involved in the disease pathogenesis.
• Trisomies of odd numbered chromosomes contribute to hyperdiploid signature while translocations involving the immunoglobulin heavy chain gene (IgH) locus comprise the nonhyperdiploid subgroup.
• While previous studies suggest cytogenetic differences between racial groups in MM, data on Black patients are limited.
• We investigated the association between primary cytogenetic subtypes and disease characteristics at MM diagnosis in Black patients.
• We also examined differences in initial treatment response and outcomes across initial therapy regimens based on cytogenetic groups.
• A total of 467 Black patients were identified
• Median age of the whole cohort was 63 (24 -91) years.
• 112 (24%) had no abnormality detected by FISH probes used.
• The retrospective data from January 2012 to March 2022 were abstracted from Levine Cancer Institute MM database for adult Black patients with MM who underwent cytogenetic testing by FISH at diagnosis.
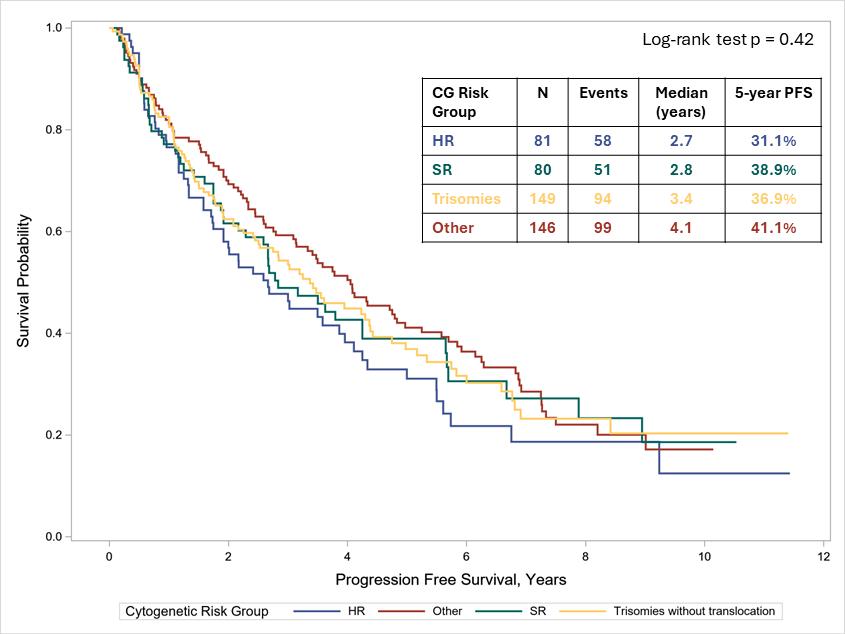
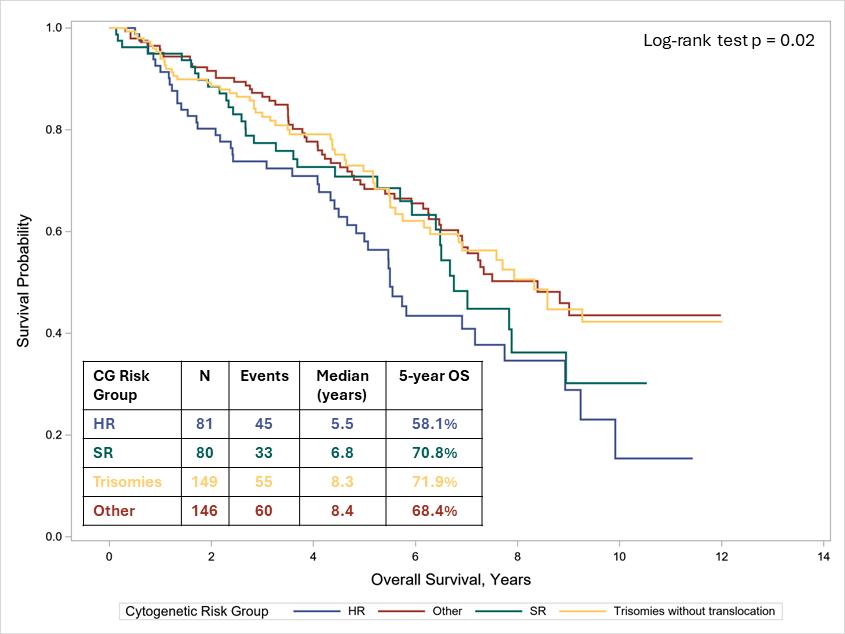
• We compared outcomes across three cytogenetic groups: standard risk (SR) (t(11;14), t(6;14), unknown IgH), high-risk (HR) (t(14;16), t(14;20), t(4;14), del17p, del1p, 1q gain/amp), and trisomy without translocations.
• Patient and disease characteristics were compared using Fisher’s exact tests or chisquared tests for categorical variables and Kruskal-Wallis tests for continuous variables.
• Time-to-event outcomes were assessed using Kaplan-Meier methods and compared using logrank tests.


• 11 (2.4%) patients did not receive any therapy.
• Age, sex, renal failure, hypercalcemia, and lytic bone disease were similar between cytogenetic groups
• Anemia was present in 96% of patients with t(4;14), 81.8% with t(14;20), and 81% with 1q gain/amp compared to 69.5% overall.
• More patients with t(14;16) were ISS stage 3 (54.6%) versus 29.8% overall.


• Among 456 treated patients, 45.8% received a PI+IMiD regimen (mostly RVD) first line, with 39.9% undergoing upfront ASCT.
• The overall response rate (ORR) to initial therapy was 91.7% (63.4% achieved VGPR or better).
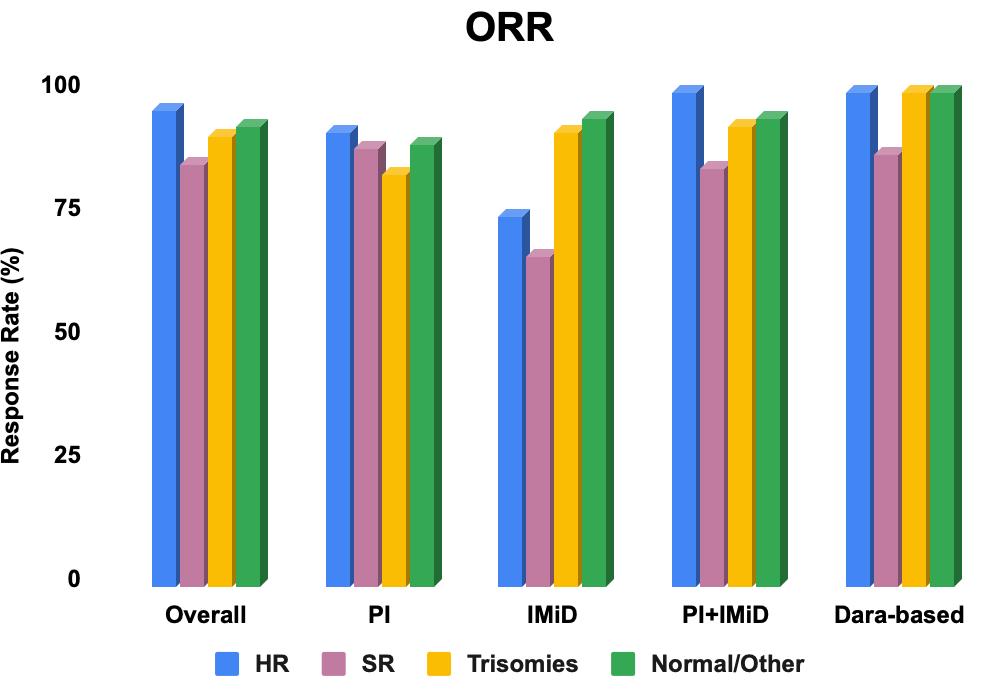
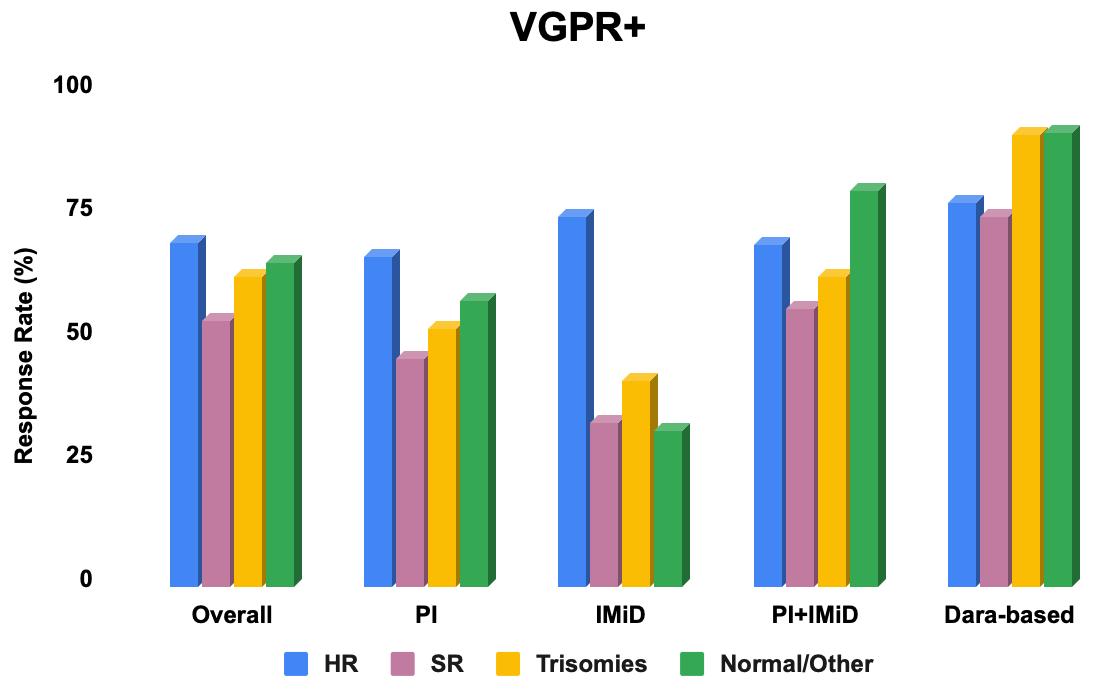
The overall response rate (ORR) to first therapy was 91.7% (63.4% with VGPR+).
In the subgroup of patients who received PI+IMiD for first therapy, ORR was significantly different between cytogenetic groups (100% vs 84.6% vs 92.9% vs 94.6%, HR vs SR vs trisomy vs normal/other; p = 0.046).
• To our knowledge, this is the largest single institution report on cytogenetics in Black patients with MM.
• Our findings underscore the impact of cytogenetic subtypes on MM outcomes in Black patients, highlighting the need for tailored therapeutic approaches based on genetic risk stratification.
• We plan to abstract our data for the White cohort (n=1500) to compare the prevalence of cytogenetic subtypes between Black and White patients, as well as compare the primary therapy outcomes between Black and White patients with MM after adjusting for primary cytogenetic subtype
• Recent advancements in therapeutic approaches for multiple myeloma (MM) have improved patient outcomes and survival.
• Despite clinical progress, disparities in health outcomes among racial, ethnic and socioeconomic groups persist.
• Factors that impact patient decisions regarding healthcare choices, and potentially contribute to variability in healthcare utilization, are under-studied
• With improved survivorship, it remains crucial to understand the medical, psychosocial, and financial burden of MM management in order to generate patientcentered care.
• An anonymous, online, self-reported questionnaire in English language, consisting of 45 questions was created through Google Forms.
• The survey explored:
Ø Demographic characteristics
Ø Social determinants of health factors (e.g., socioeconomic status, education, access to healthcare)
Ø Treatment decision-making preferences
Ø Treatment Satisfaction
Ø Cancer survivorship outcomes
• This survey was distributed to MM patients within the Mayo Clinic system and to all (156) International Myeloma Foundation (IMF) support groups.
• Results were collected from May 10 to June 21, 2024.
• Descriptive statistics were calculated.
• Multiple model logistic regression was done for multivariate analysis of patient responses, using R language (Bluesky Statistics, V7.40).

• Decision-making for MM treatment remains complex and is influenced by numerous factors impacting patient behavior.
• Improved MM survival corresponds with a significant survivorship and caregiver burden which can also impact patient treatment choices for subsequent therapy.
• This burden is associated with sociodemographic disparities.
• Addressing these factors systematically is crucial to:
1)Achieving equitable healthcare utilization
2)Optimizing clinical outcomes
3)Enhancing psychosocial welfare
4)Improving financial security


• Multiple myeloma (MM) is the most common hematologic cancer in people of African Descent
• The prevalence of MM and MGUS is 2 to 3 times more common and occurs at a younger age than in White individuals
• Black people anecdotally have little awareness of the condition.
• Outcomes for MM are poorer in Black communities due to myriad reasons
• Health literacy and awareness of the MGUS/MM may improve cultural awareness, self advocacy and MM outcomes
Ingrid Okonta, MS¹; Vincent Rajkumar MD 2, Joselle Cook , MD² ¹University of Louisville School of Medicine, ²Mayo Clinic - Rochester, MN
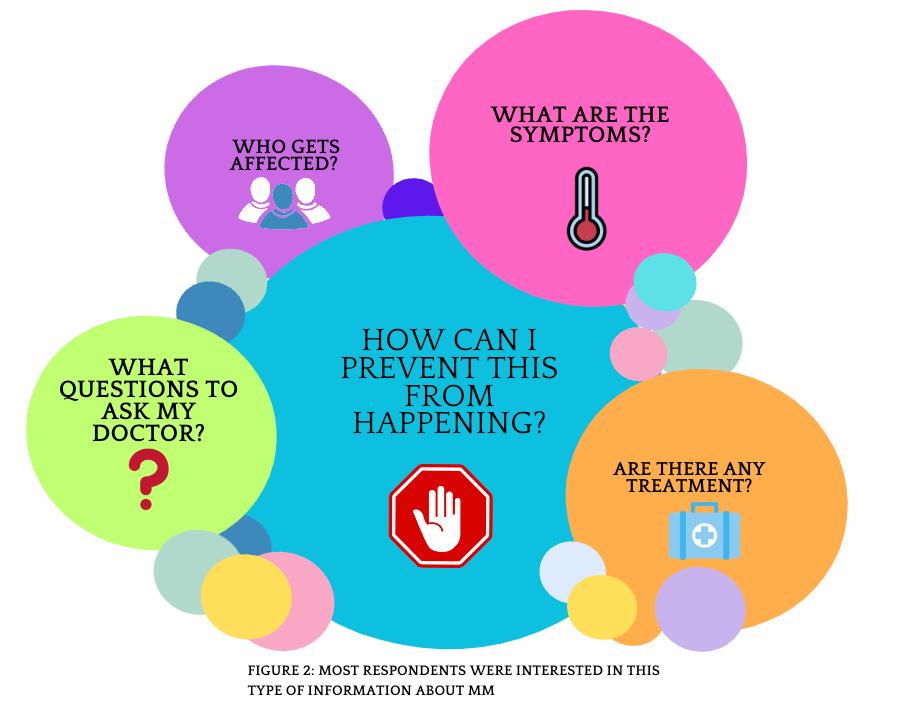
Questions from the community…
• To perform a qualitative assessment of the knowledge and perceptions of MM in the community and determine their health literacy needs
• Population: Adults over 18 years in Louisville, Kentucky, USA
• Locations: Barbershops, churches, community events
• Survey: Awareness of MM and educational needs (QR code)
• Survey Distribution: Electronic via QR code and paper surveys for those unable to complete electronically.
• Data Analysis: Descriptive Statistics and Chi-Square Test (p-value < 0.05 considered significant)
225 hours spent in community outreach from March 2024 to July 2024
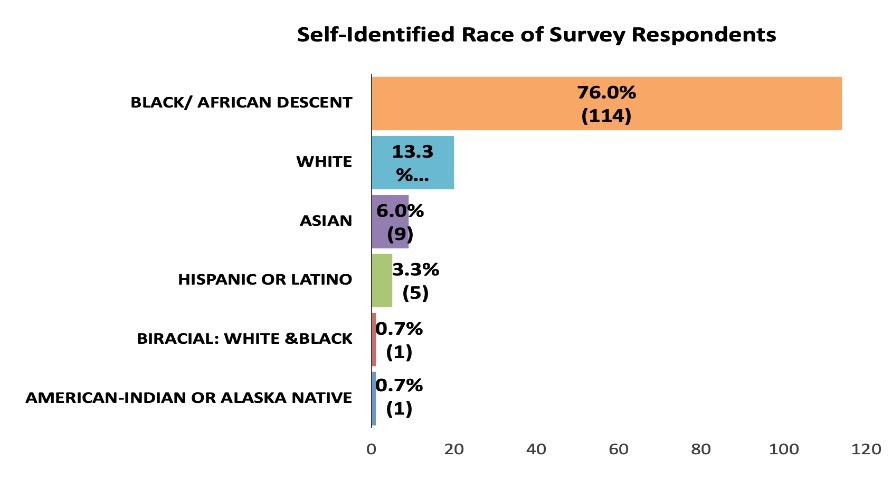
150 approached• 100% completion• 118 electronically, 32 paper surveys
• First time insight into the health awareness and health education needs regarding Multiple Myeloma from a community perspective.
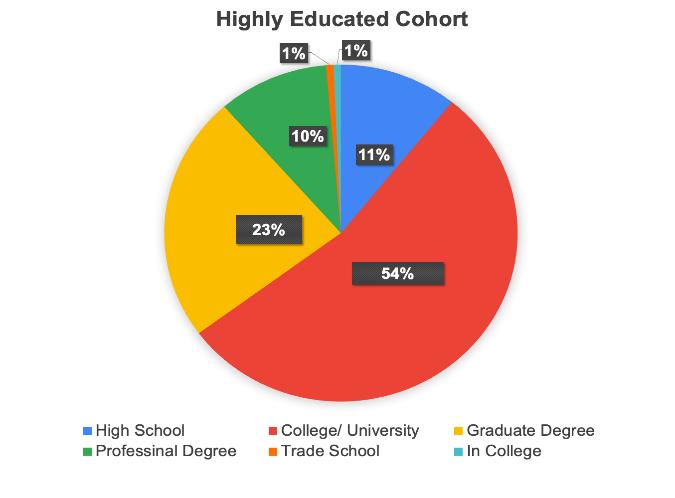
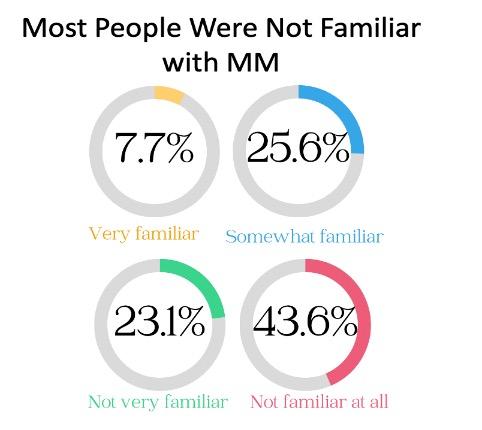
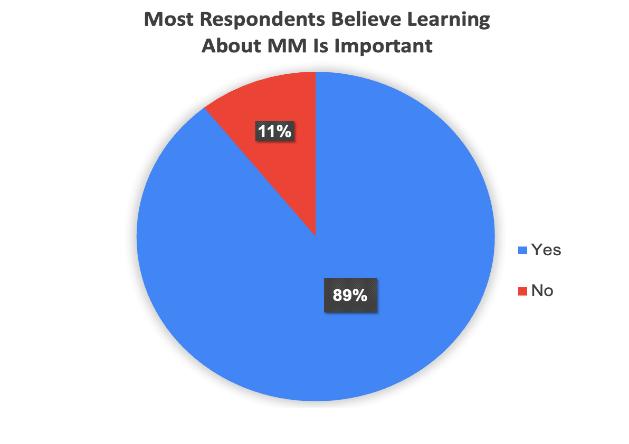
• Well educated cohort but 67% of population had little to no awareness with the condition MM is still a relatively rare malignancy could explain some of the lack of familiarity.
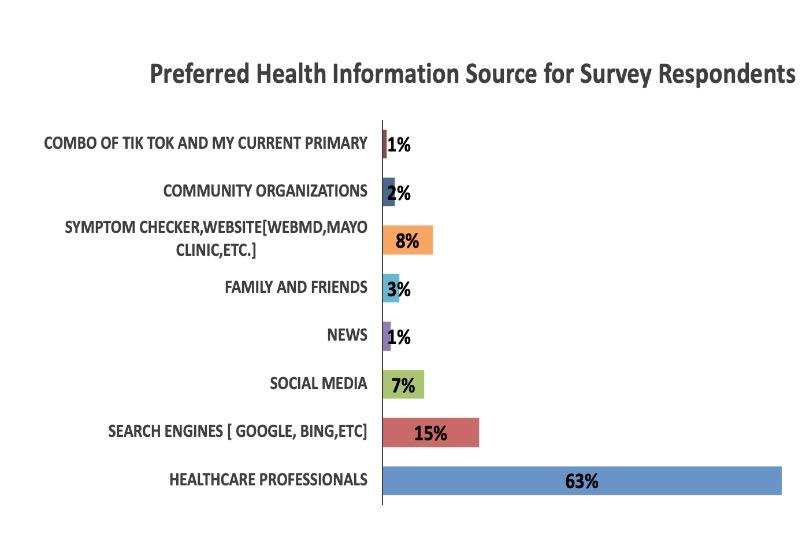
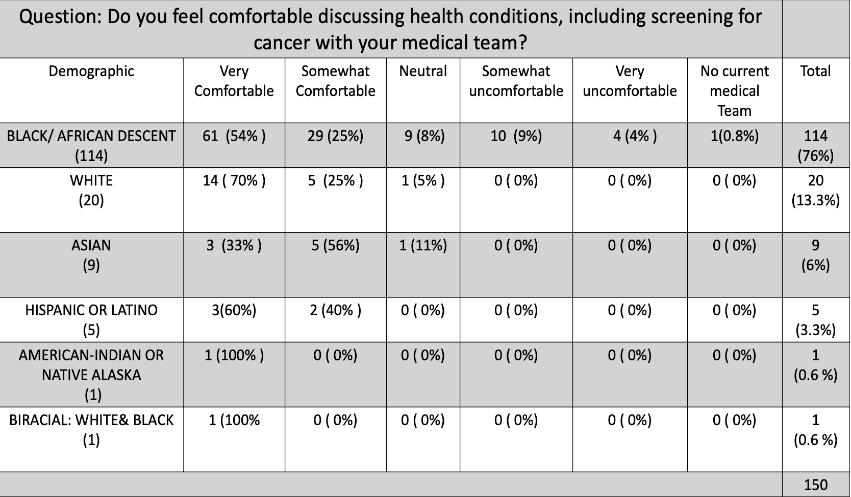
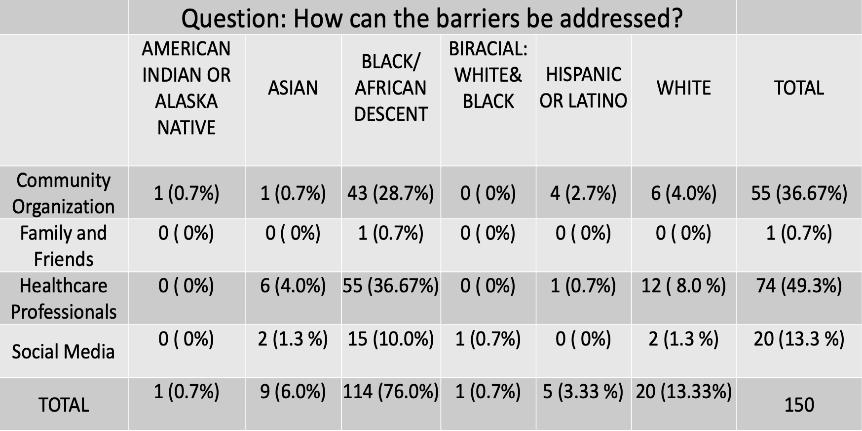
• Black individuals desire more information on MM and trust the health care team for information
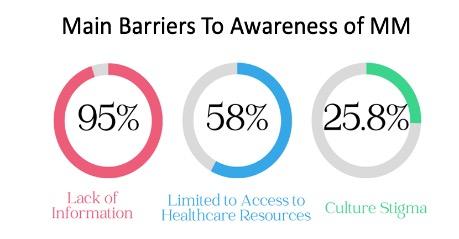
• Key areas for education identified
• Social media is not a favored resource for information dissemination
• Improving health literacy of MM at a community level will be key to encouraging self-advocacy and reducing delays in presentation to ultimately improve the outcomes for MM in the Black community


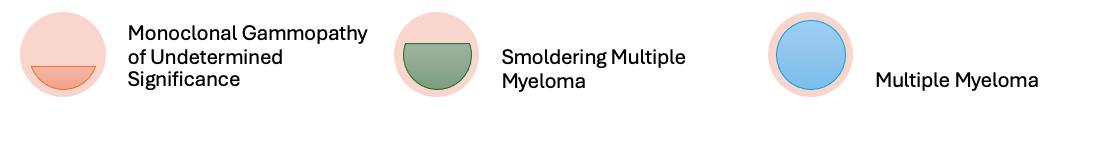
Multiple Myeloma (MM) is a blood cancer, arising from plasma cells. Plasma cells develop from a type of white blood cell called B-cell that is found in the bone marrow and secretes antibodies.
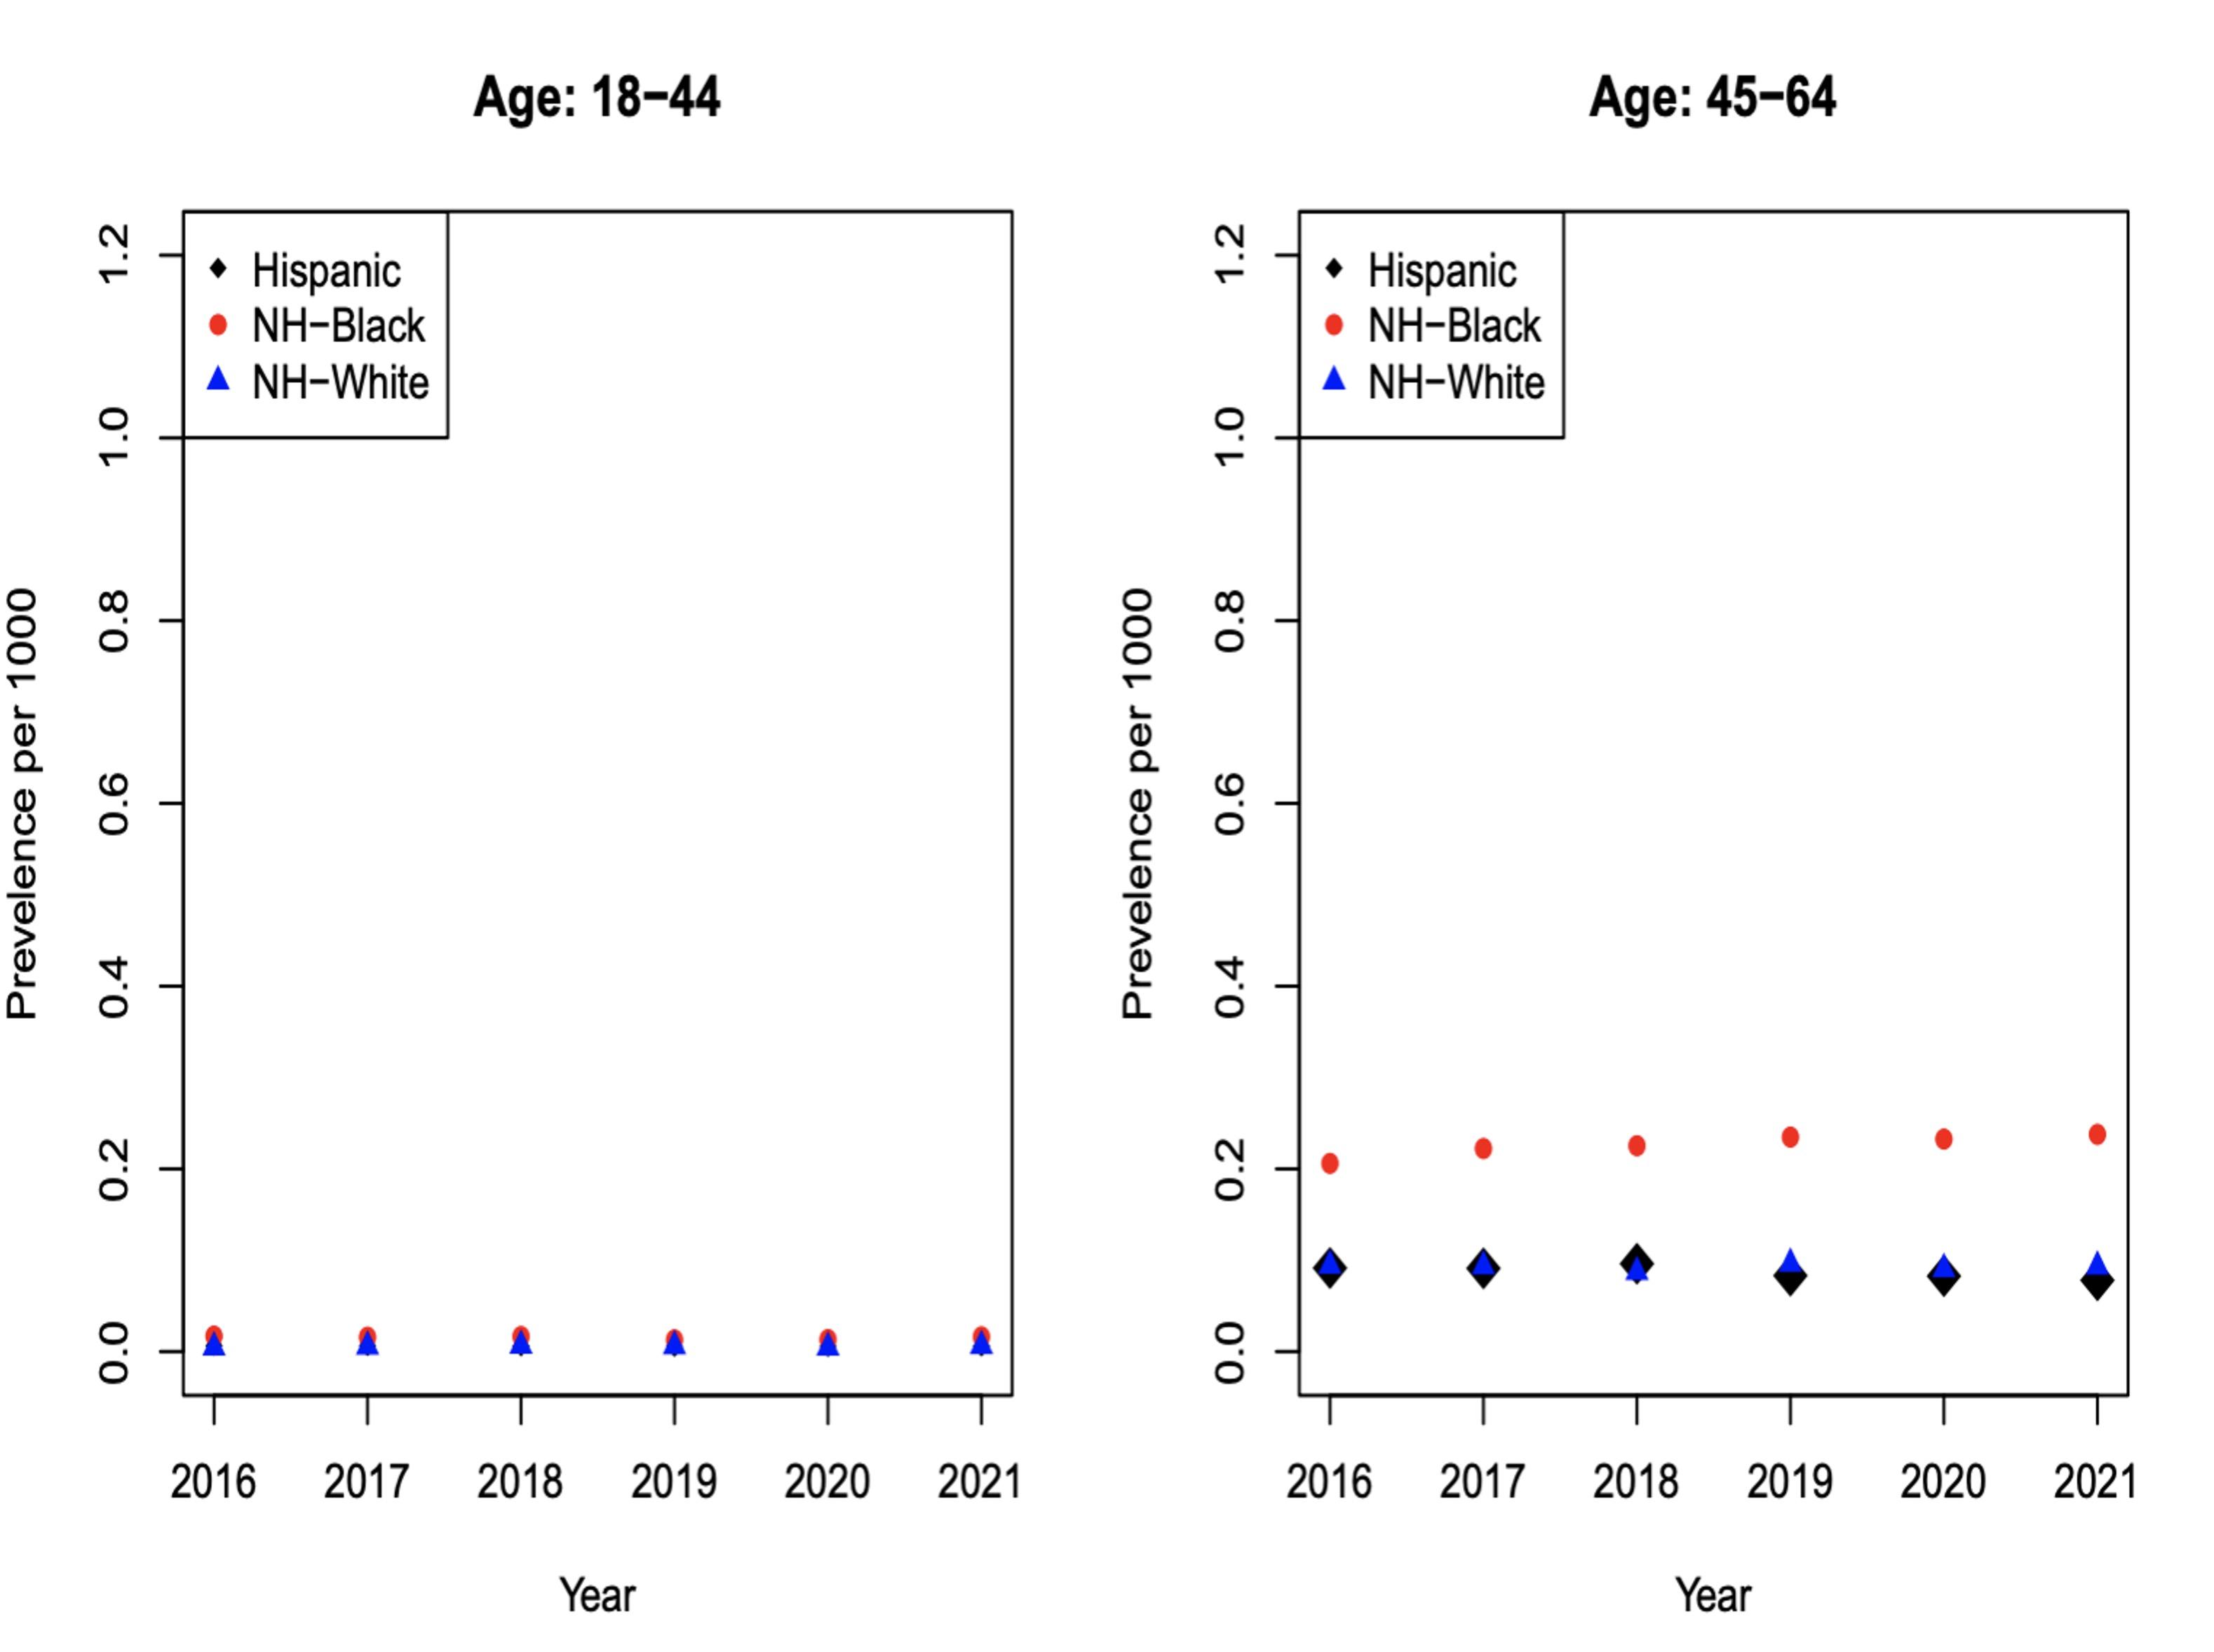
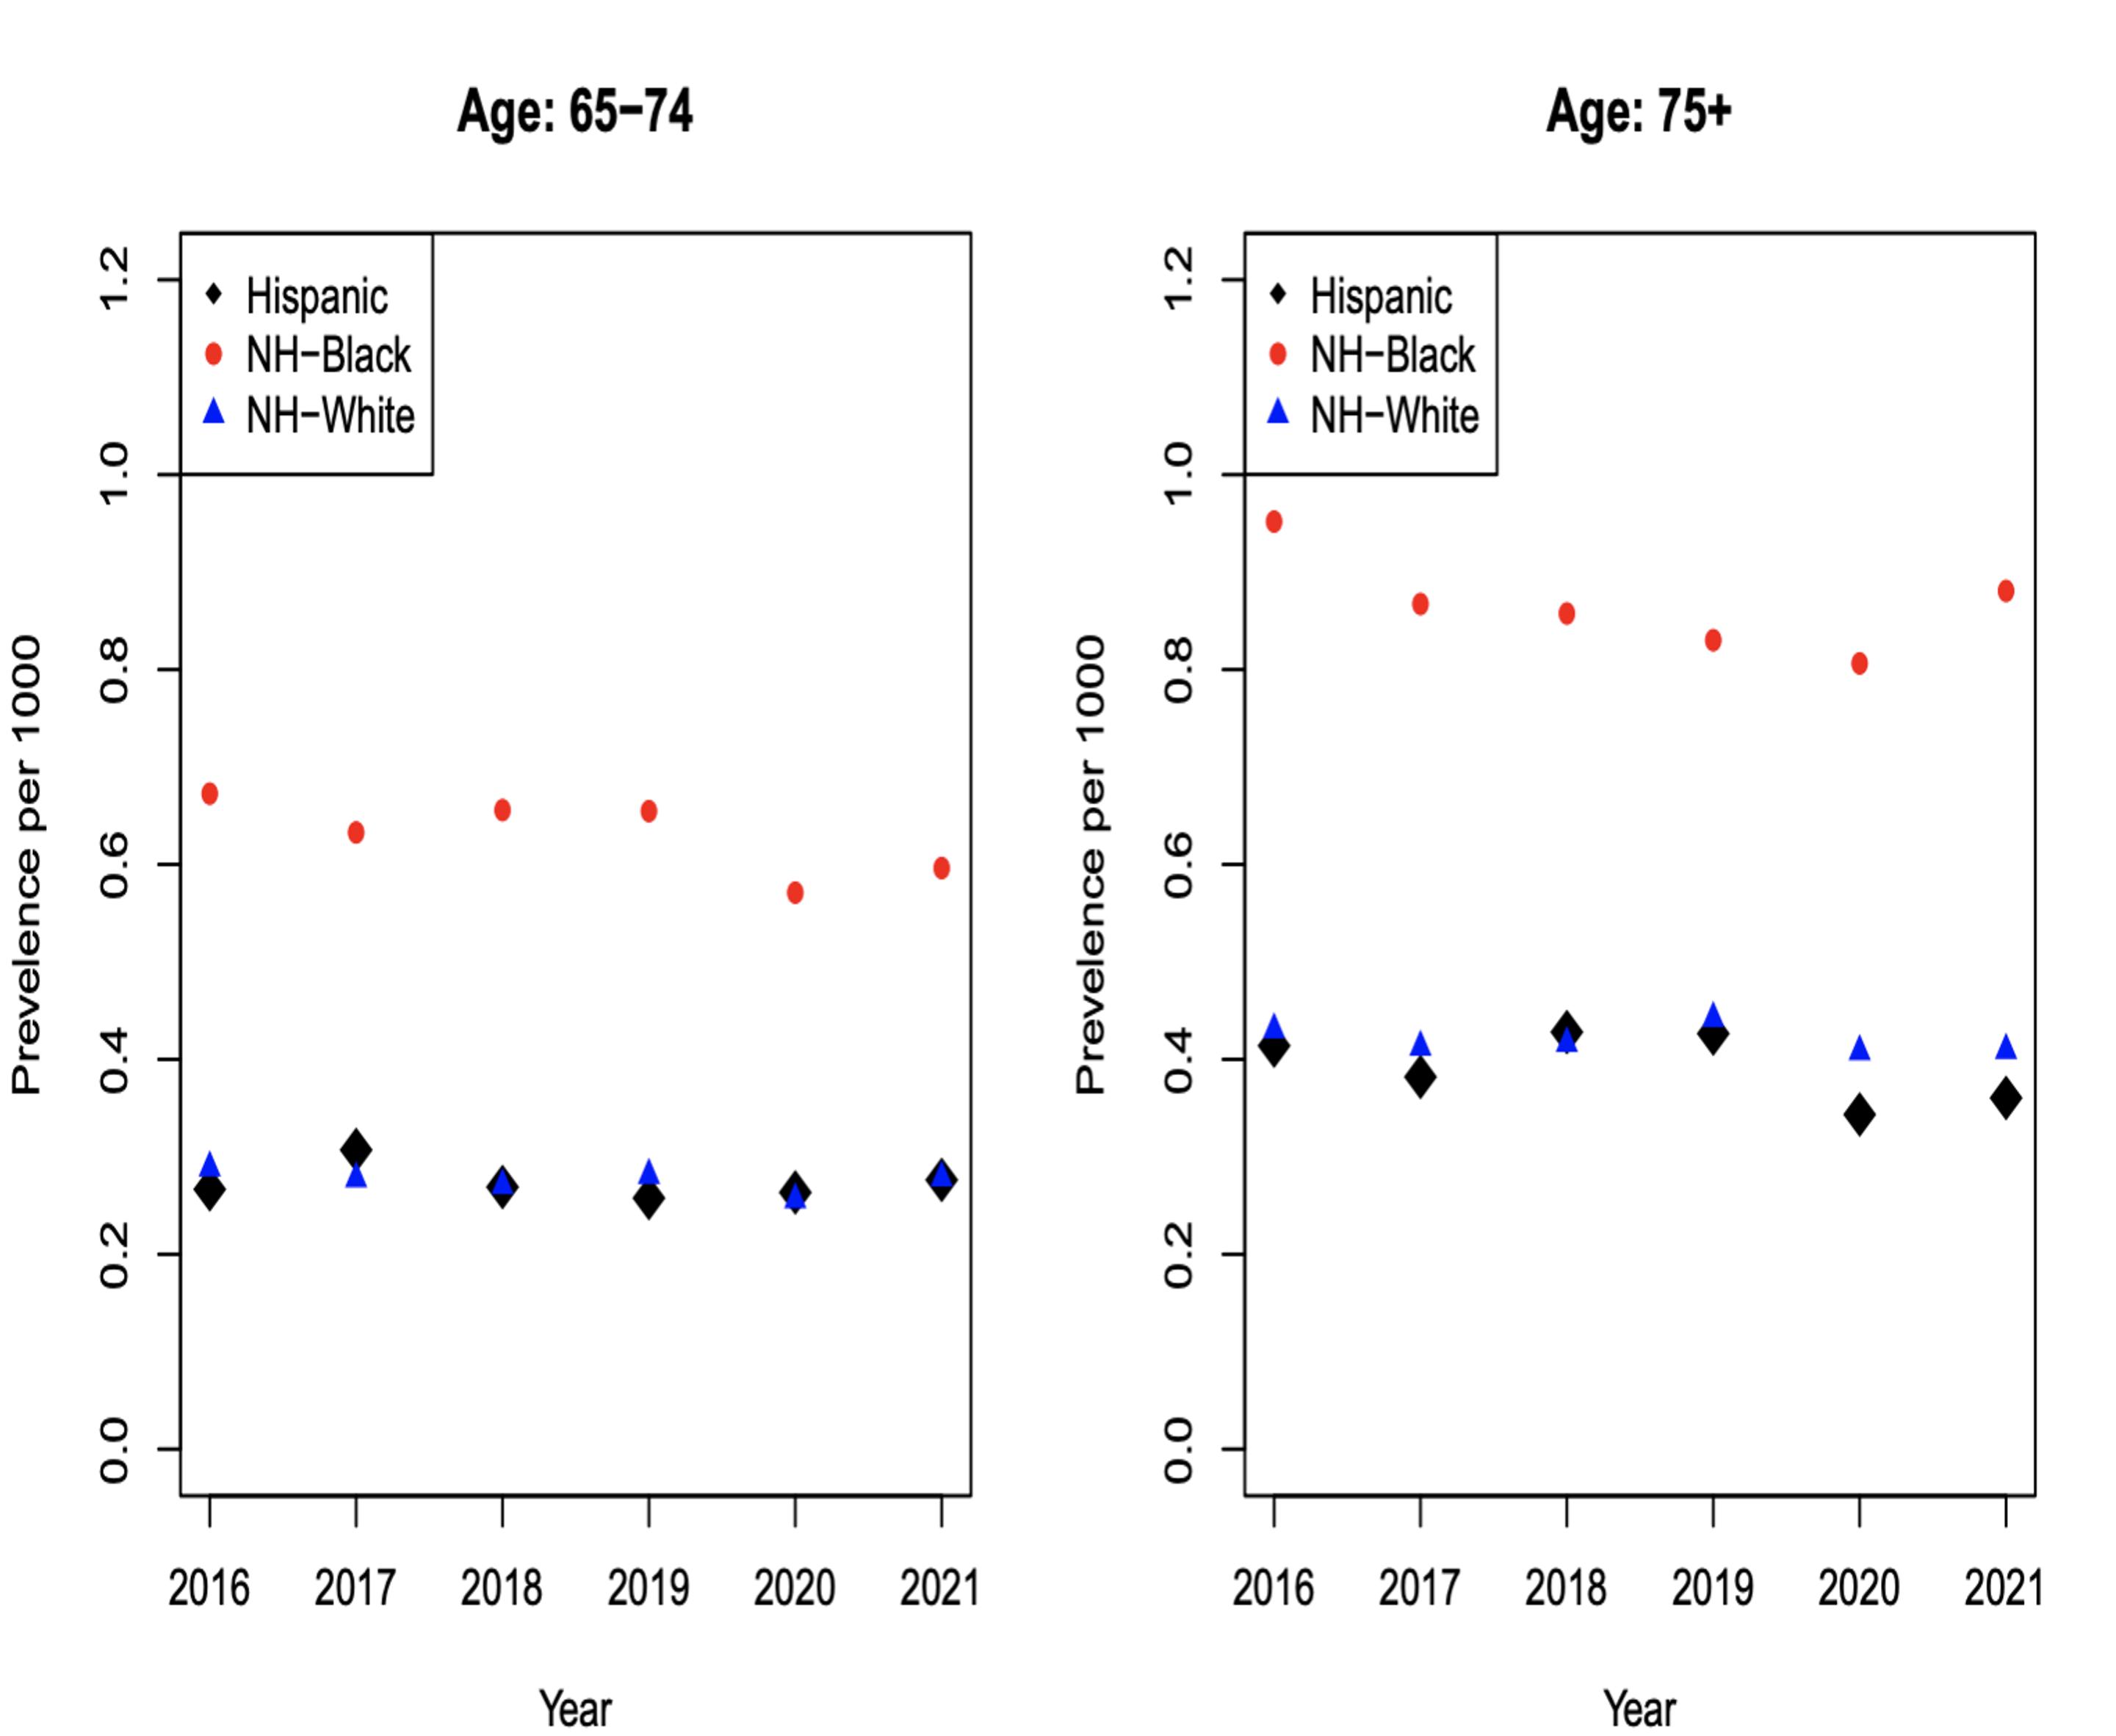
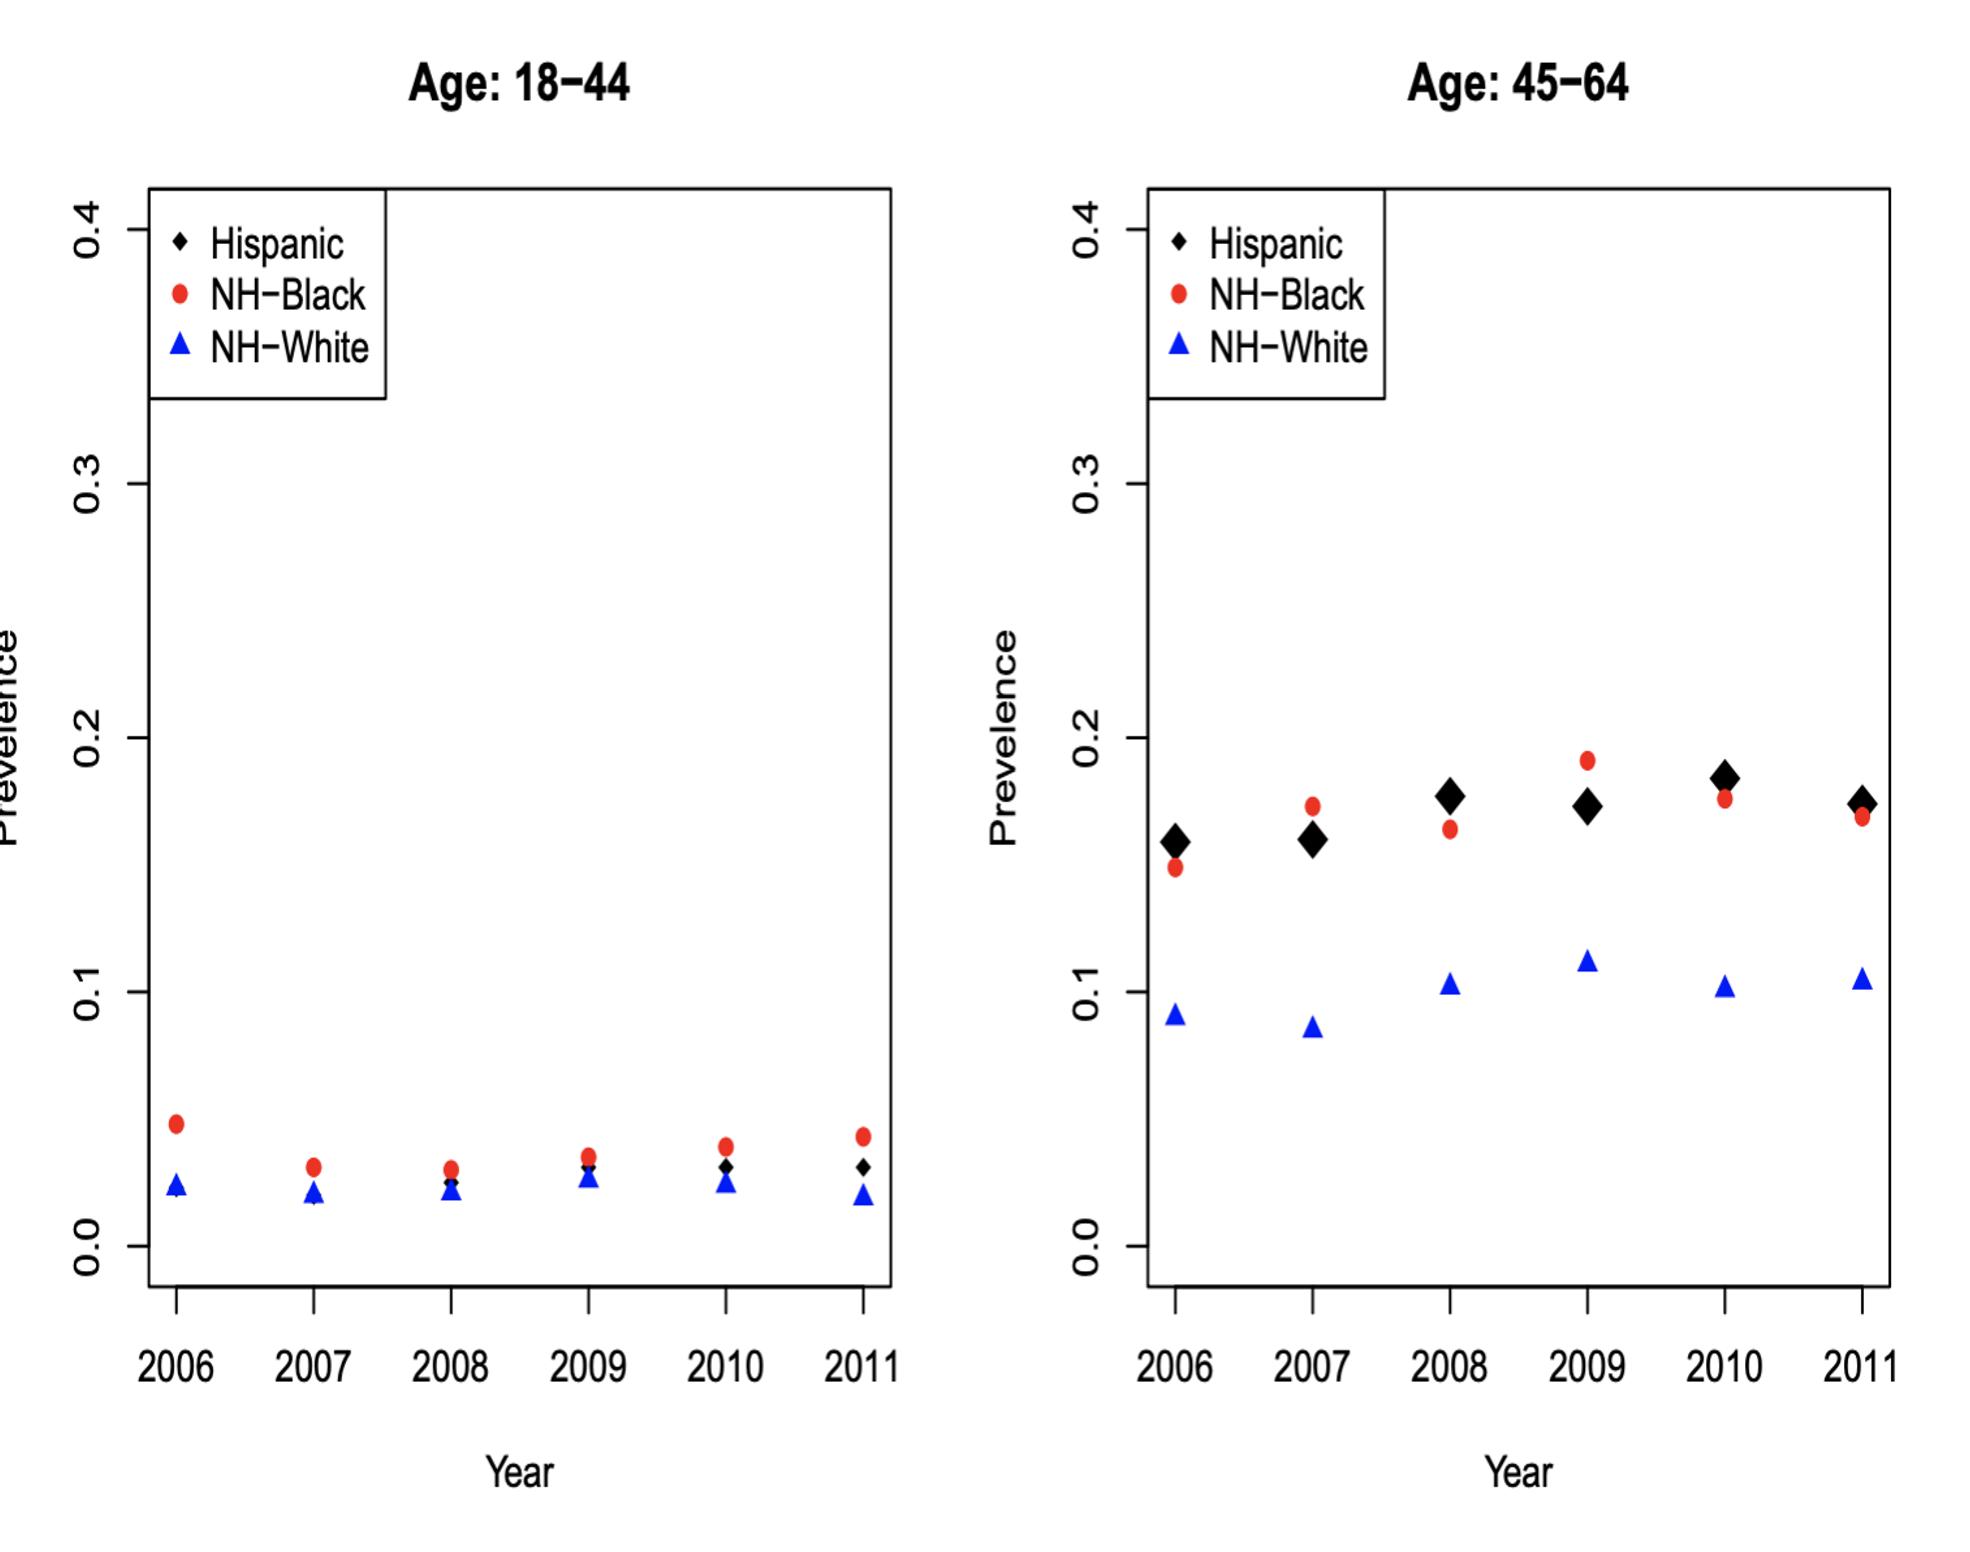
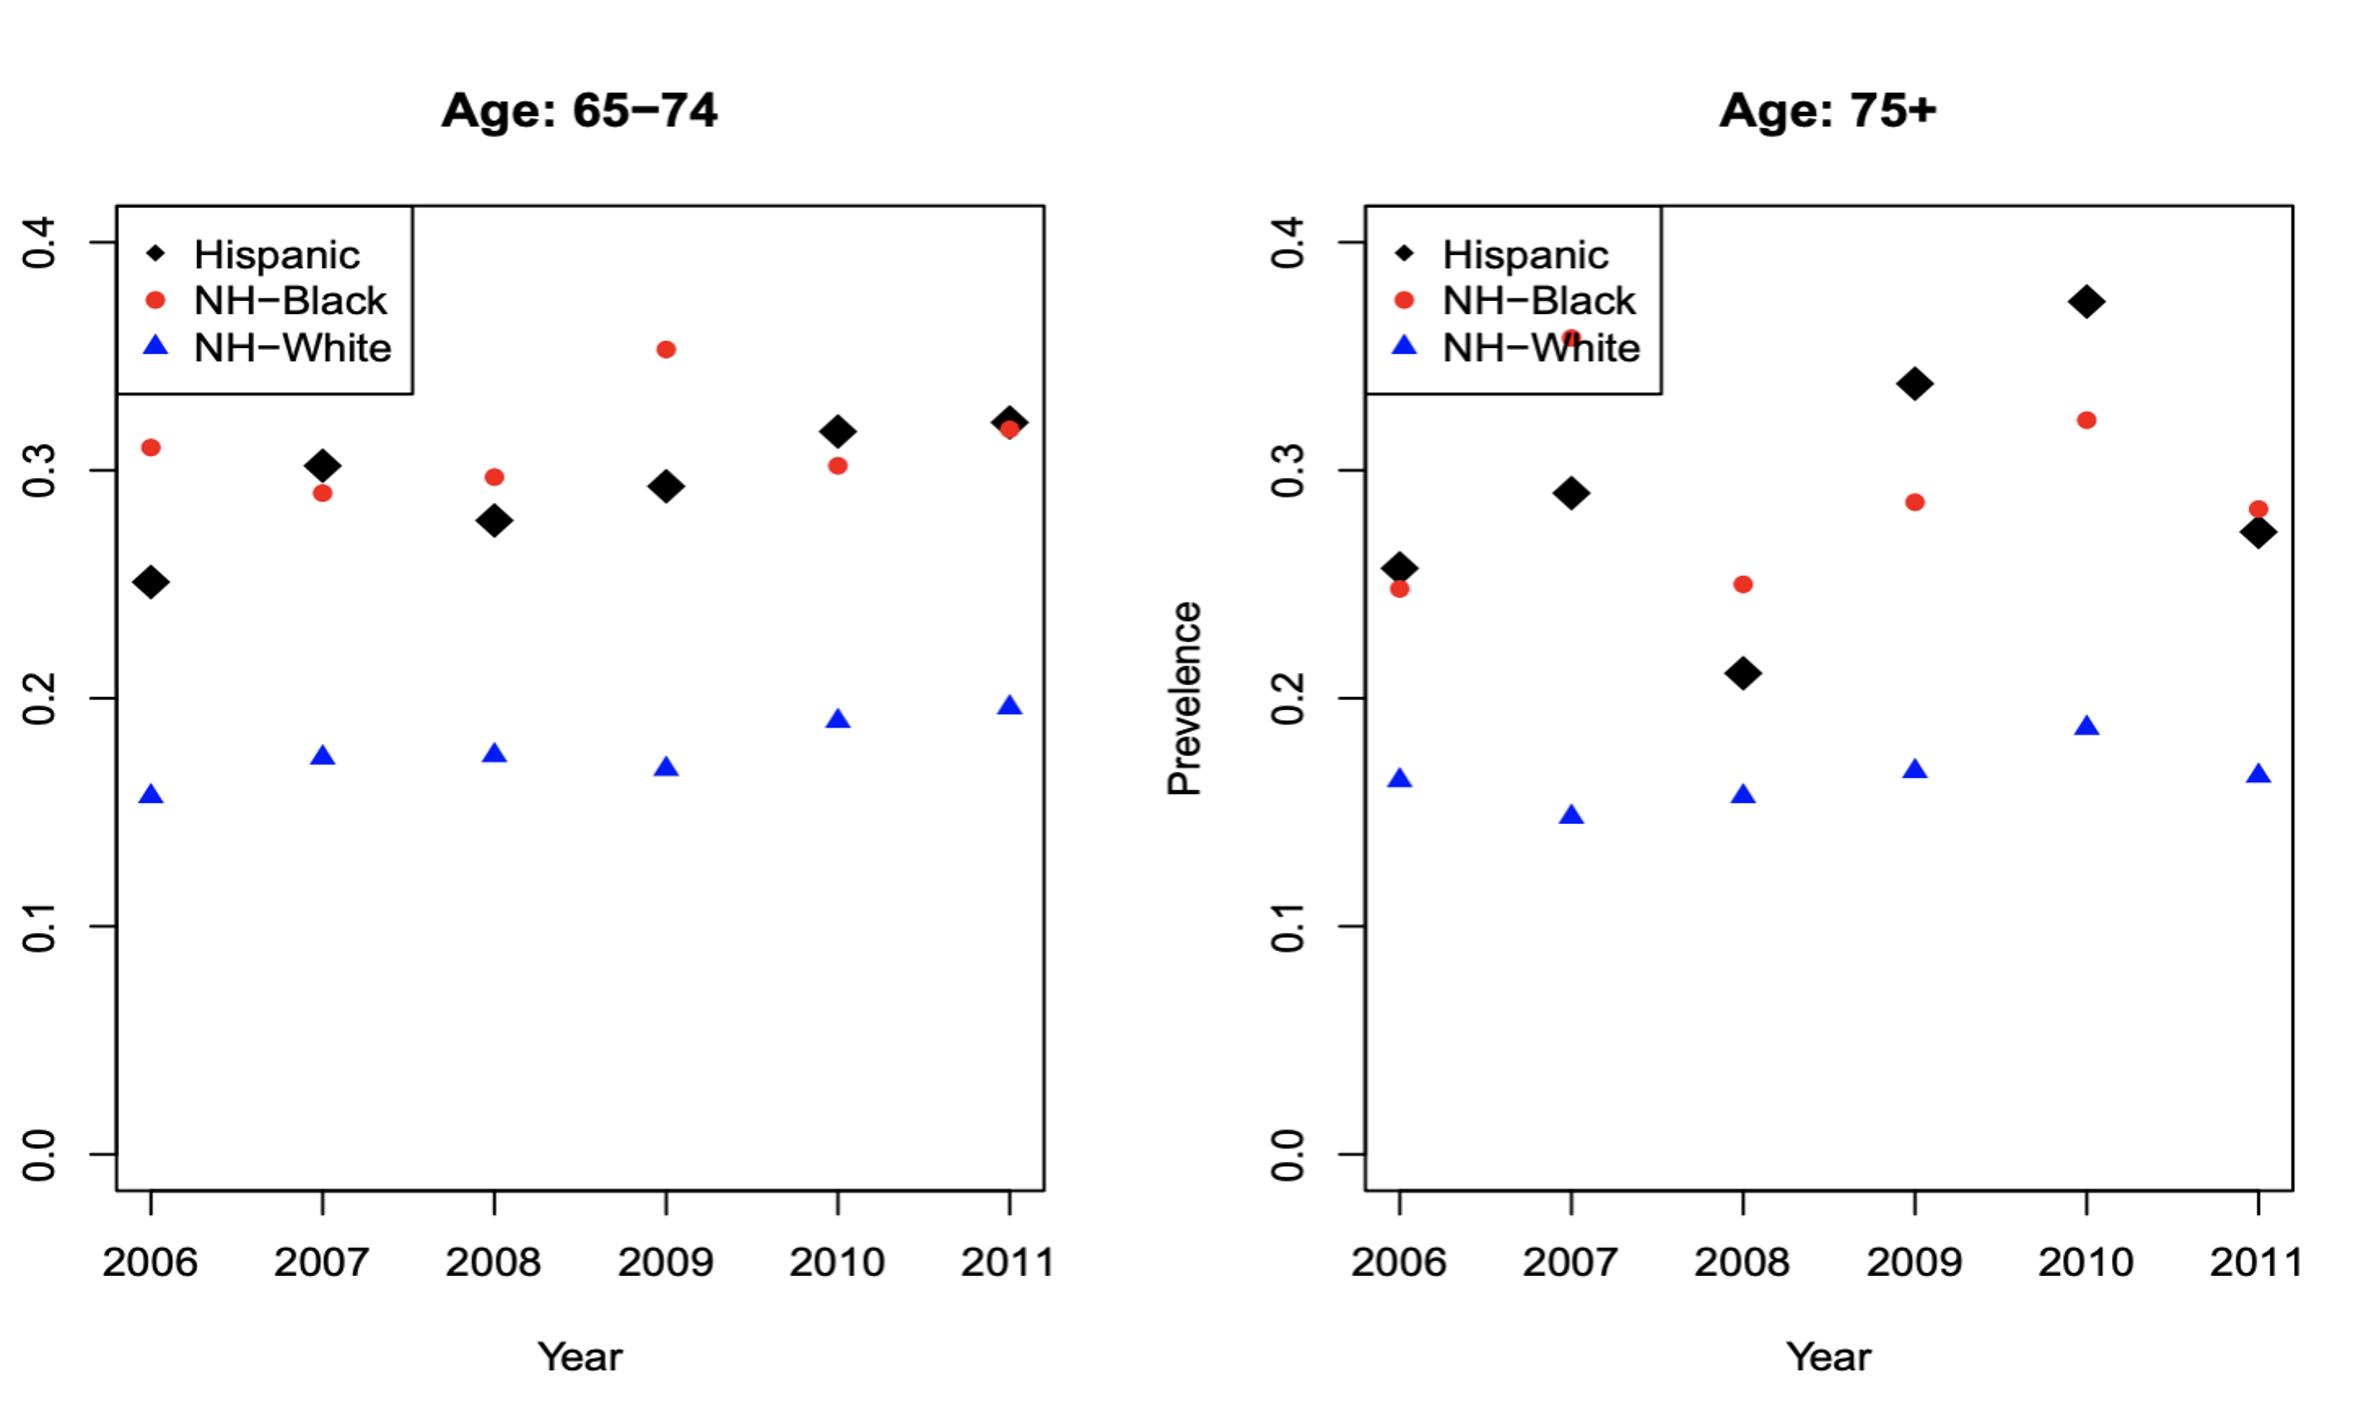
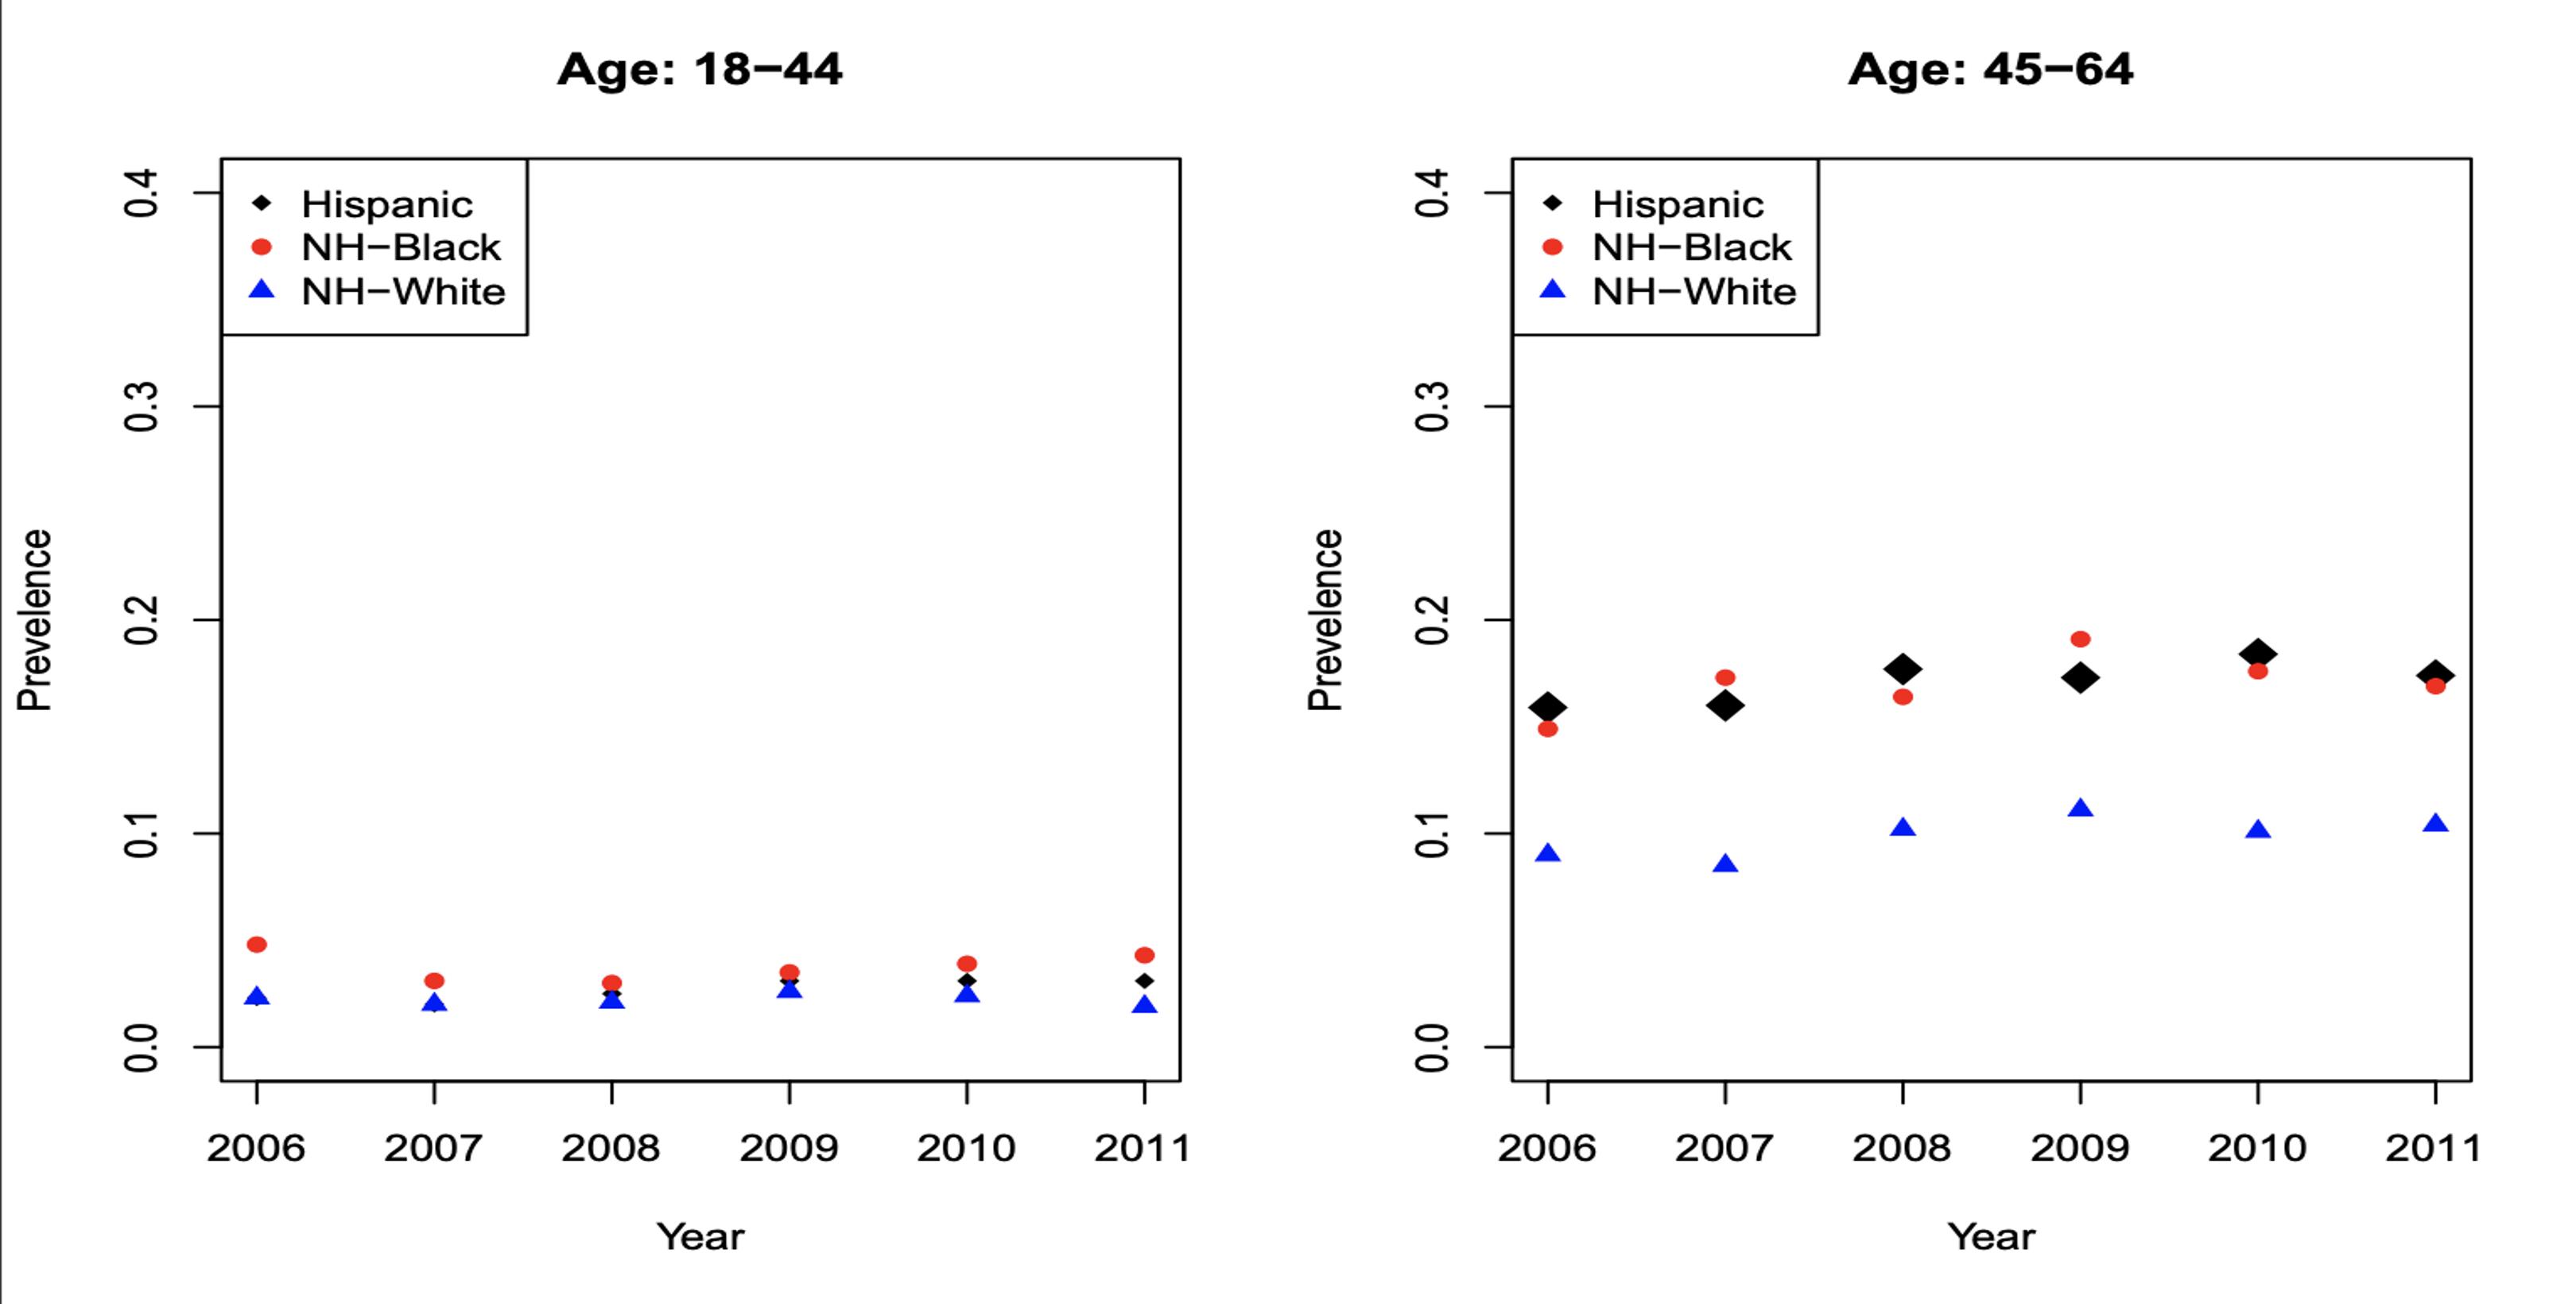
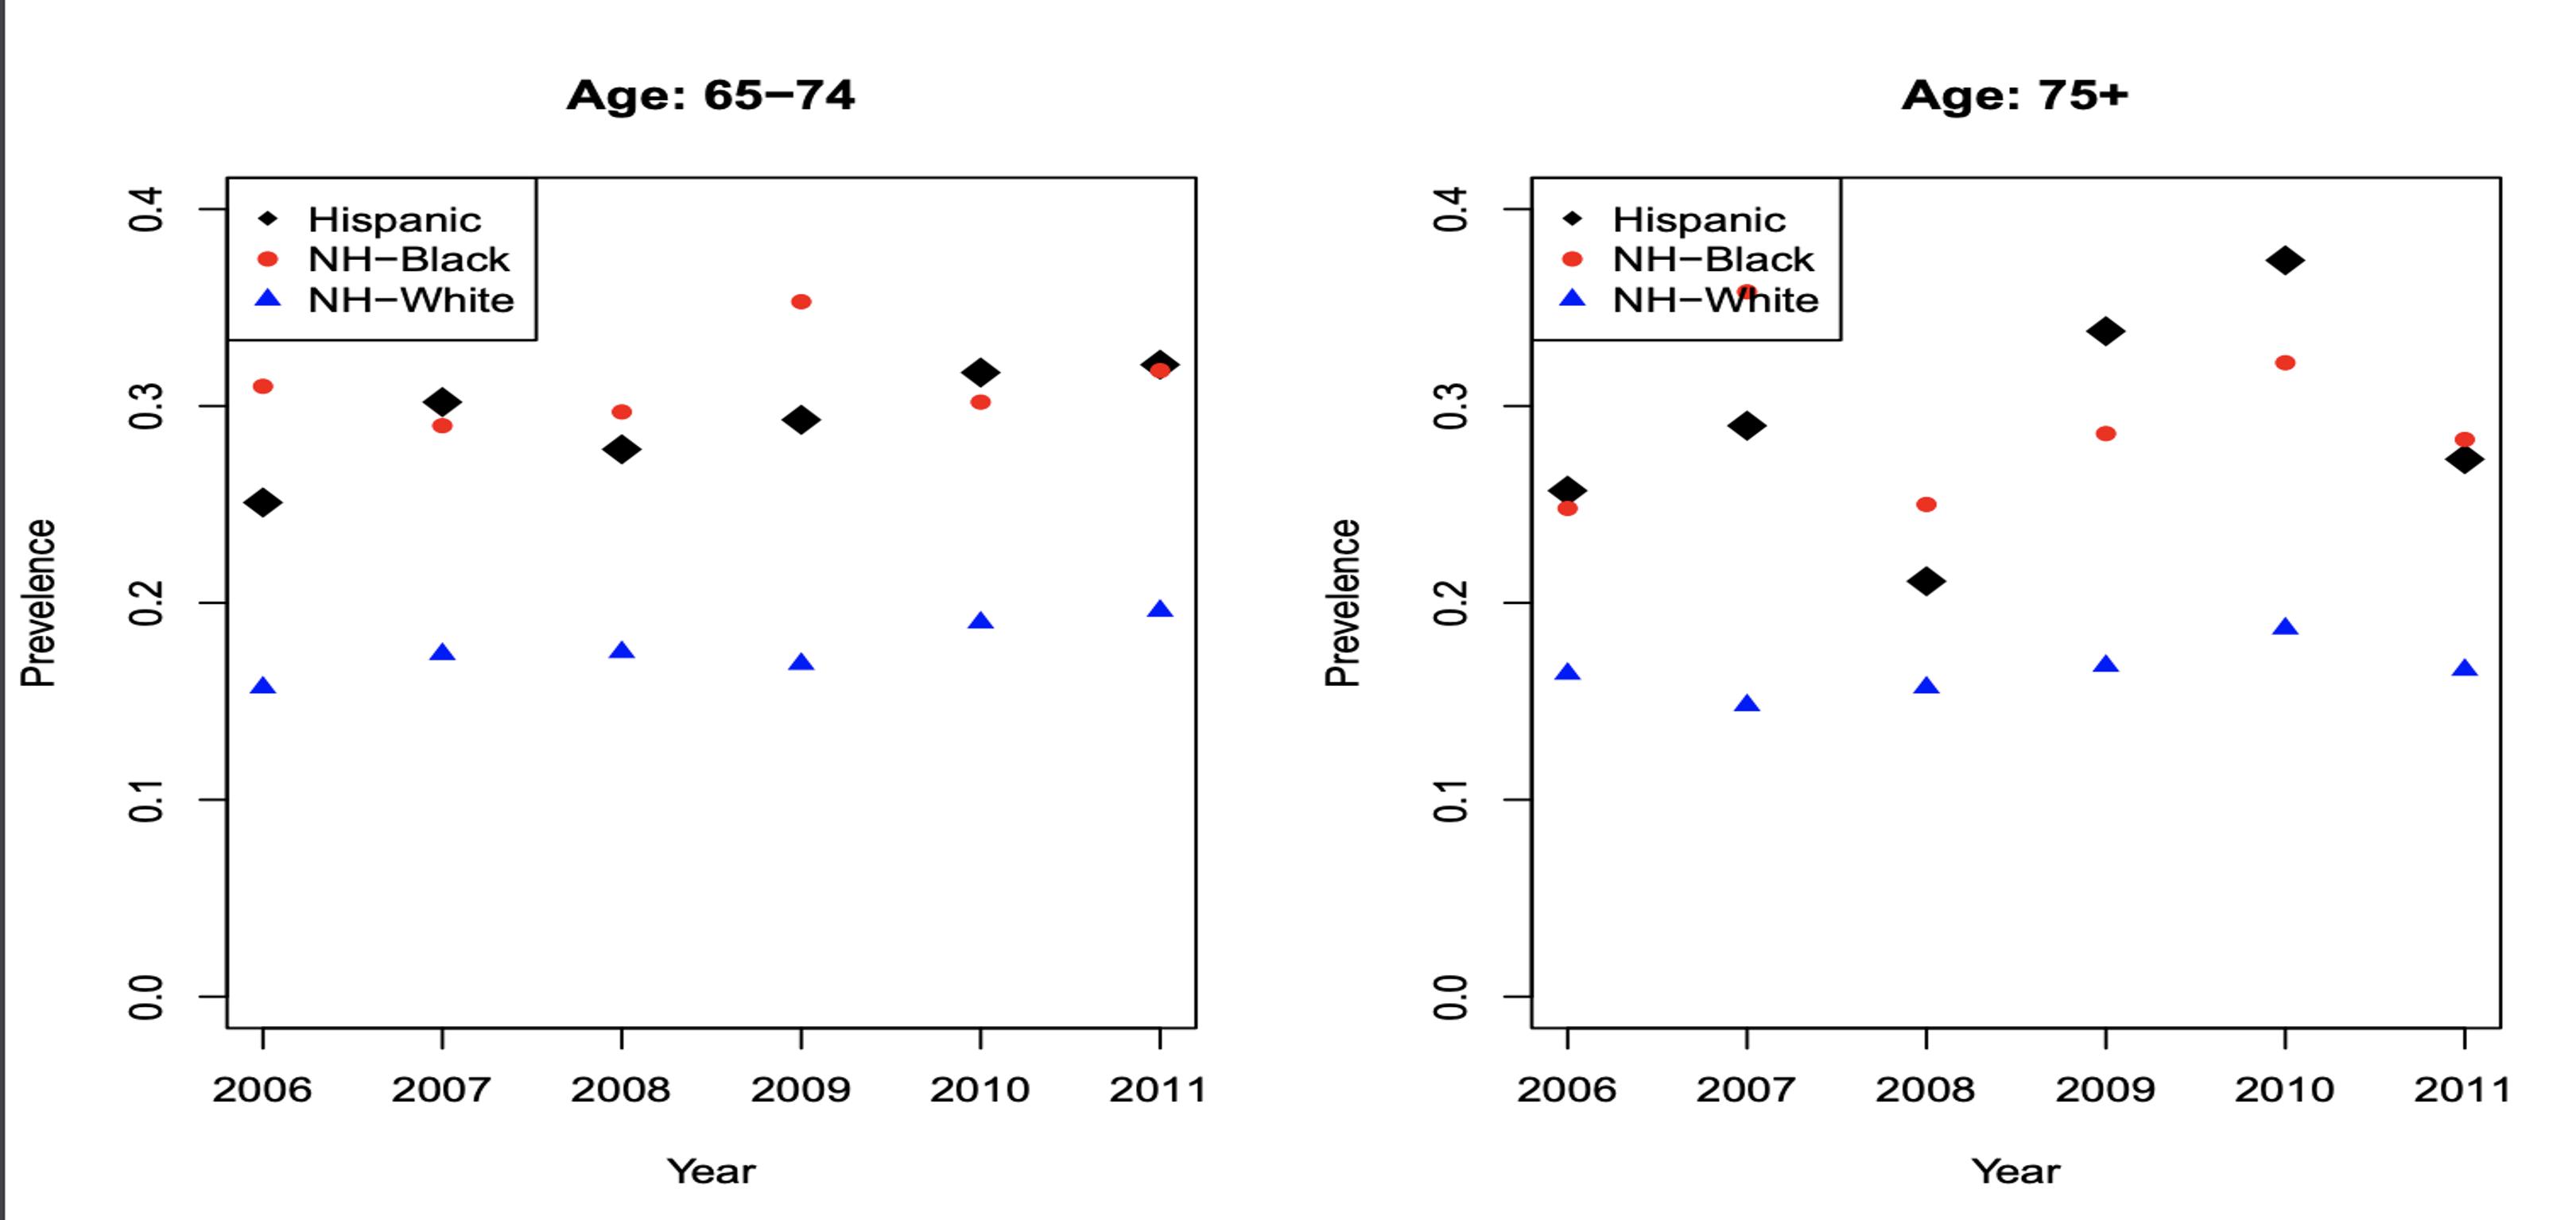
Figures 4a, 4b, 4c and 4d: Multiple Myeloma Incidence
The incidence of myeloma is greater in NHB compared to NHW and Hispanics, especially in the age groups of 65-74 and 75+. MM incidence shows that for 65-74 (Figure 4c) for each 0.3 NHW there are roughly 0.6 NHB patients; there is an absolute difference in rates of 0.3.

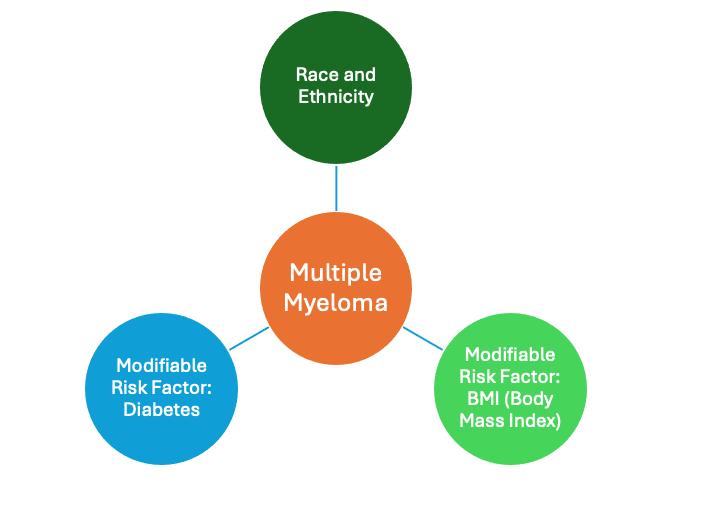
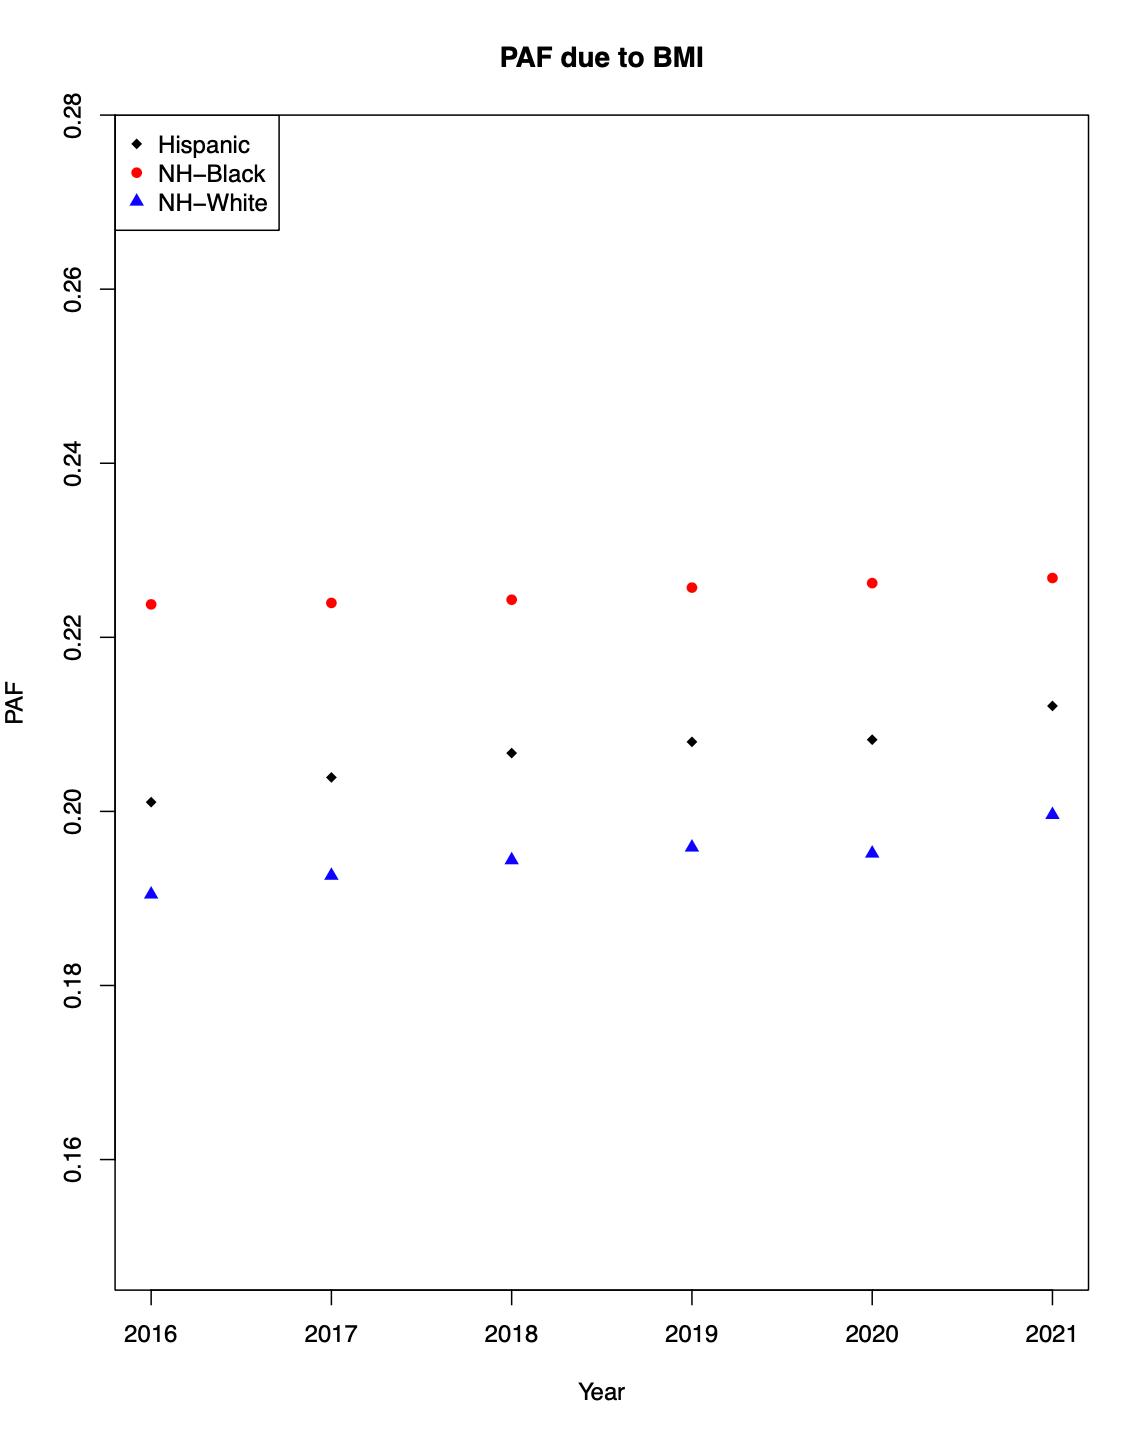
Figure 2: Rationale Behind Study Design MM disproportionately affects Black populations; furthermore, certain modifiable risk factors have been linked to increased risk of MM, such as elevated Body Mass Index (BMI) and Diabetes Mellitus (DM). These risk factors also disproportionately affect Black populations compared to White populations. Thus, we aimed to calculate the population attributable fraction (PAF), which is the proportion of incident MM cases attributable to these risk factors - elevated BMI and DM. We further estimated the degree to which these risk factors contribute to the excess MM risk in non-Hispanic Black (NHB) populations compared to non -Hispanic White (NHW) populations.

Figure 3: Data utilized to calculate the Population Attributable Fraction
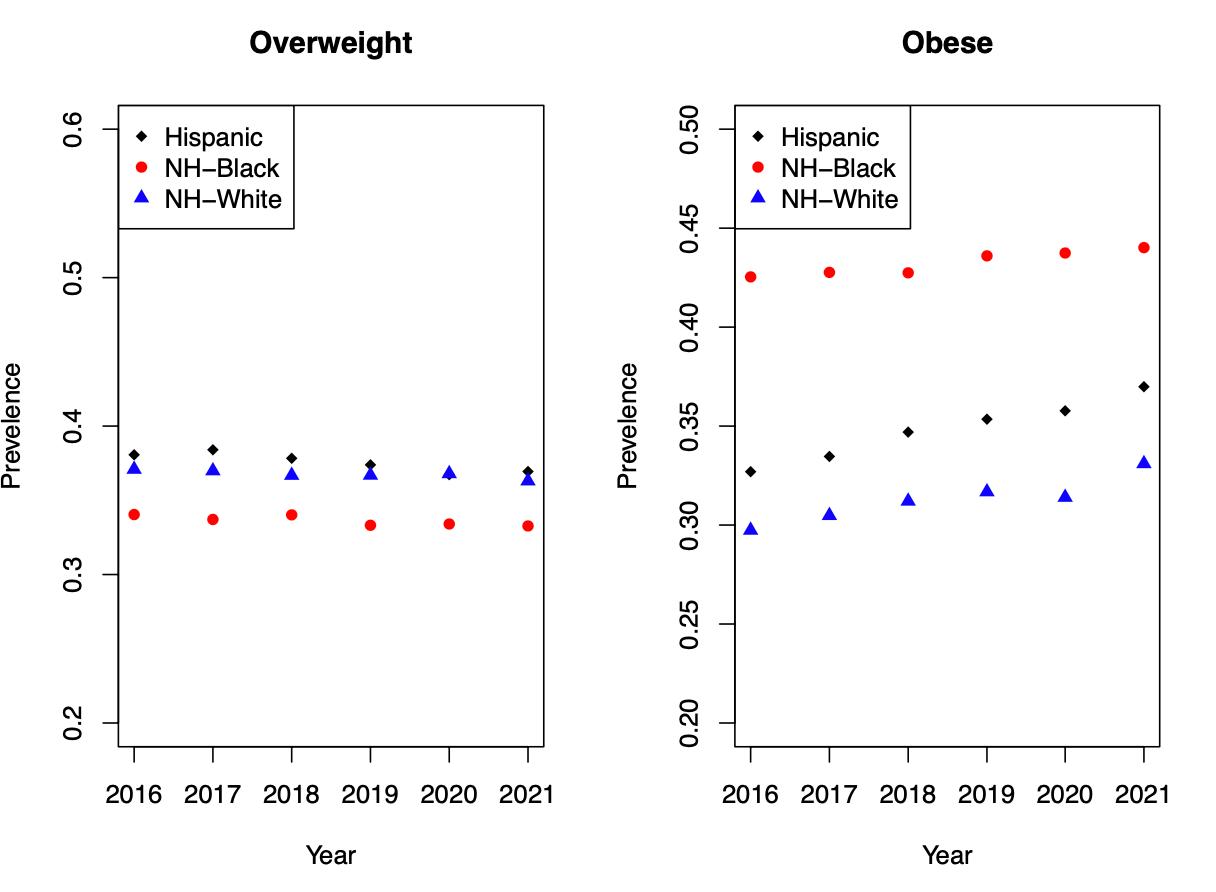
Figures 5a and 5b: BMI Incidence
There was a difference between the incidence of elevated BMI in NHB compared to NHW and Hispanics (the incidence estimates for obesity were approximately 43%, versus 35% for Hispanics and 30% for NHW).
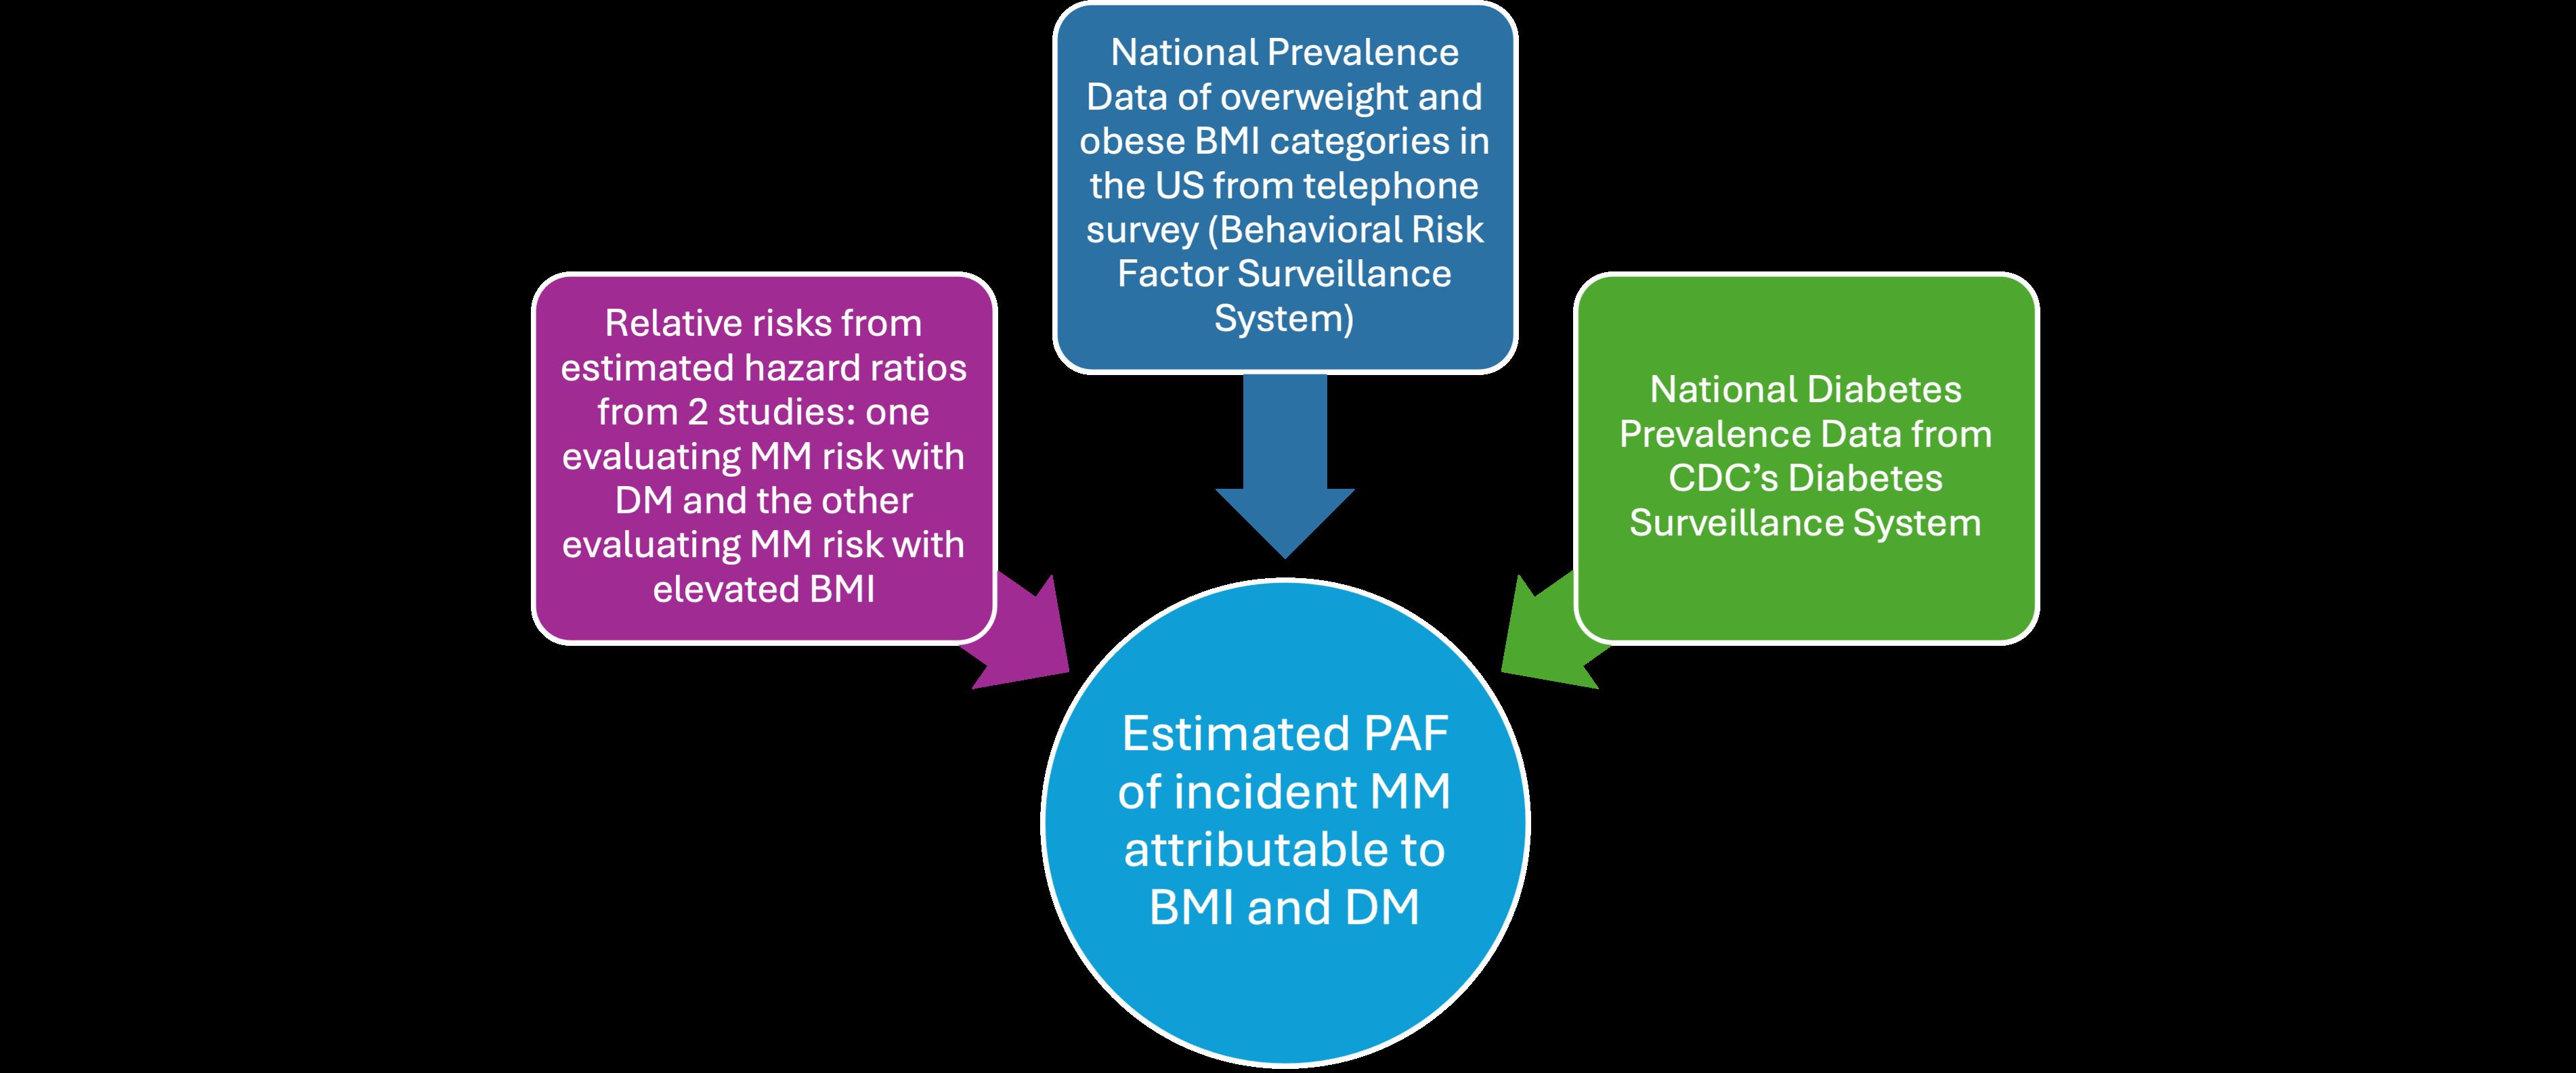
Relative risks (RRs) were obtained from estimates of hazard ratios reported in two large epidemiologic populationbased studies evaluating MM risk with DM (Gong et al. Diabetologia 2021) and with elevated BMI (Hofmann et al AJE 2013). Based on these papers, estimate of MM risk for DM (hazard ratio [HR] 1.09), overweight category (HR 1.09 to 1.25) and obese category (HR 1.26 to 1.55) ranges were utilized.
Furthermore, the incidence of overweight (BMI: 25-30) and obese (BMI:>30) BMI categories per race for the US were obtained from 2016-2021 from the Behavioral Risk Factor Surveillance System (BRFSS), a nationwide telephone survey of adults 18 years or older designed to provide reliable estimates of health-related behavioral risk factors. National level incidence of DM data per race for age groups 18-44, 45-64, 65-74, and 75+ was obtained from the Centers for Disease Control and Prevention through their US Diabetes Surveillance System from the Division of Diabetes Translation for 2000-2022.
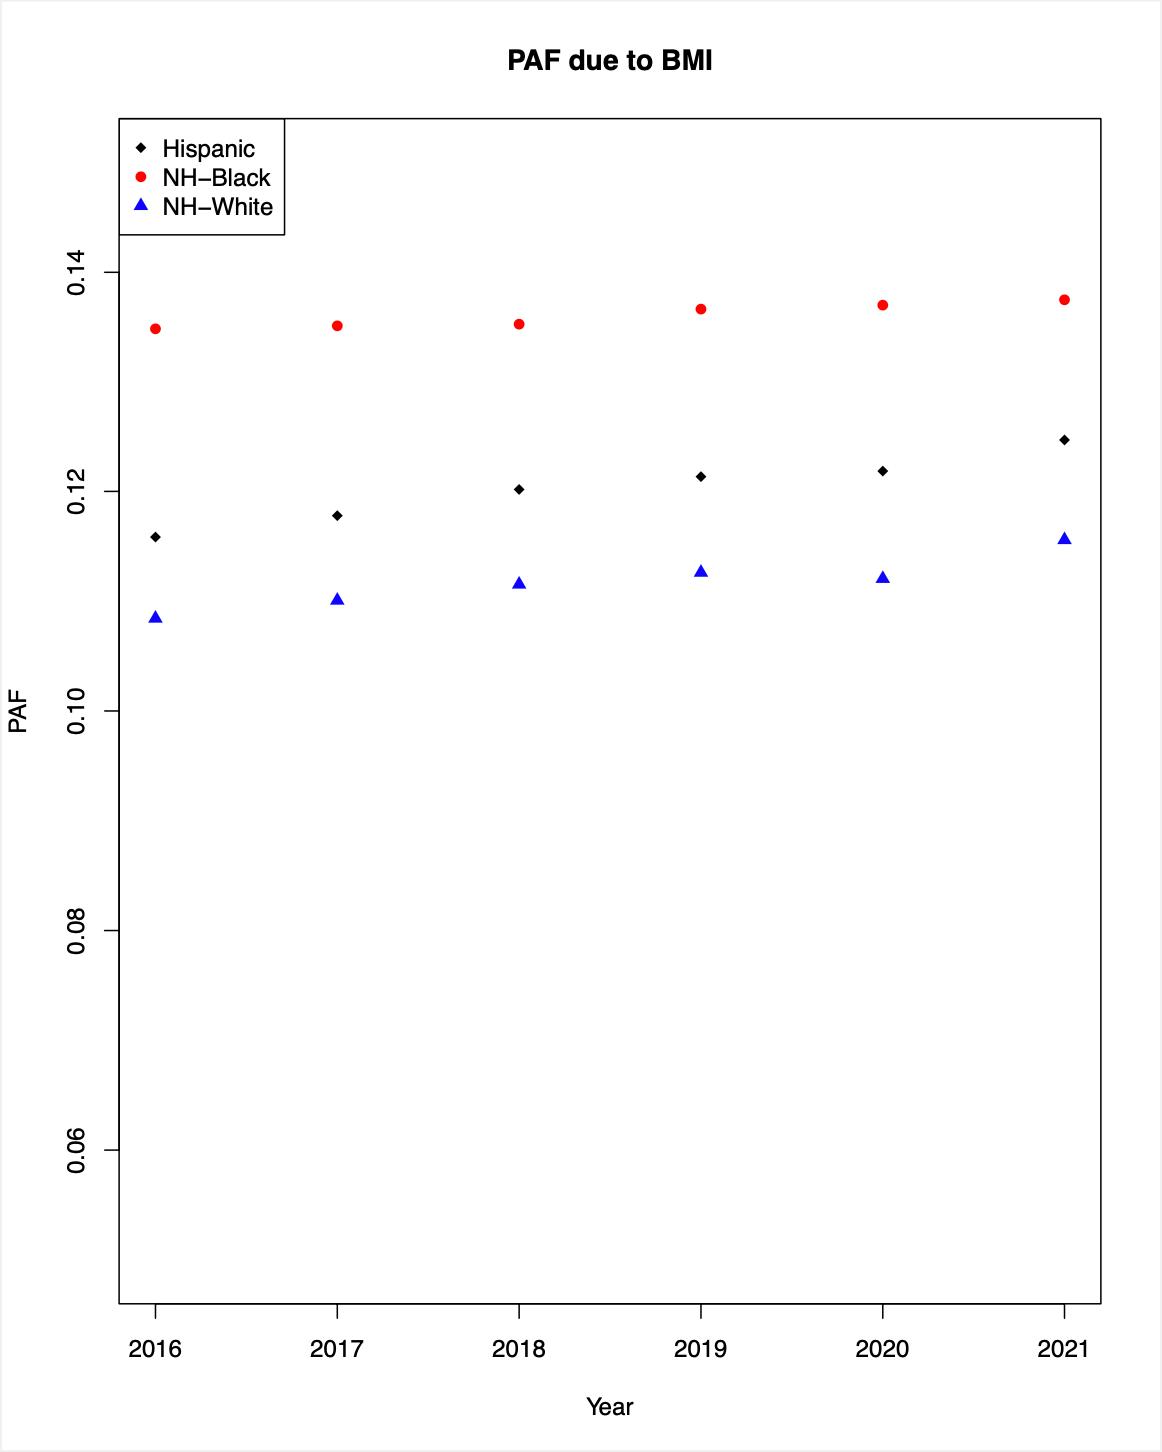
Figures 6a and 6b: BMI Population Attributable Fraction (PAF)
The left diagram (Figure 6a) shows the BMI PAF calculated in a scenario where hazard ratio (HR) for the overweight category was 1.09 and HR for obesity category was 1.25. The right diagram (Figure 6b) shows the BMI PAF calculated where HR was 1.26 for overweight and 1.55 for obesity. From these estimates, we saw that the PAF due to elevated BMI ranged between 11-19.5% for NHW and 13.5-22.5% for NHB. The excess in MM cases due to elevated BMI in NHB compared to NHW ranges between 2.5-3%.
Figures 7a, 7b, 7c and 7d: Diabetes Incidence
For NHW populations, the incidence of DM was similar for ages 18-44 (Figure 7a). For ages 45-64 (Figure 7b), incidence was approximately 10% and NHB was approximately 15%. For ages 65-74 (Figure 7c), incidence was 15% for NHW and 30% for NHB. For ages 75+ (Figure 7d), incidence was 15% for NHW, and approximately 30% for NHB.
Figures 8a, 8b, 8c and 8d: Diabetes Population
Attributable
Fraction
DM explains roughly 3% difference in the rates of MM incidence between NHW and NHB. In other words, if we control for diabetes, the rate will decrease by 3%; this disparity increases with age
The proportion of MM attributable to modifiable risk factors such as DM and elevated BMI (both of which affect black populations disproportionately compared to white populations) is significant. Up to approximately 1 in 5 MM cases in NHW and 1 in 4 MM cases in NHB is estimated by our analysis to be attributable to elevated BMI as a risk factor. This suggests a need for comprehensive intervention strategies to lower BMI and reduce DM Incidence among communities at risk of developing MM, as well as implementing preventive measures to reduce the long-term impact of these chronic conditions.