
3 minute read
costs


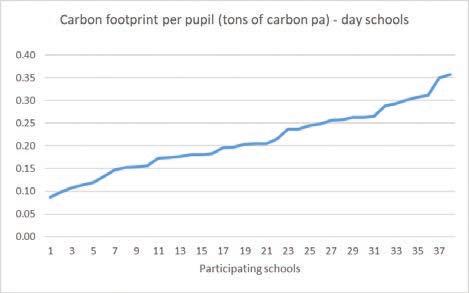
Recommendation: While energyefficiency measures can be a real money pit, my impression is that the better performers have focused on the basic disciplines of cutting wasteful usage and improving insulation within the normal cycle of estate refurbishment. What’s your carbon footprint per pupil? If in the third/fourth quartiles, there will be material gains to be made here without necessarily spending large amounts of unplanned capex.
Cleaning
The cost of cleaning is always a large sum of money, and yet from within the confines of the school it’s hard to assess whether the cost incurred represents good value for money. My preferred KPI is total cleaning cost (labour and materials) per square metre of built estate, on the basis that all areas of the school estate will receive some measure of cleaning. Figure 4 shows the range of values obtained across the ‘all-years’ and senior schools, where again, the difference between the first quartile and fourth quartile averages is plus-230% (£11.2/m2 versus £25.8/m2).
In the vast majority of cases I have encountered, the cleaning function is carried out in-house. Interestingly, and counterintuitively, those 5% that have outsourced this function are all in the first/second quartiles (after paying contractor profit plus VAT). This is not to recommend that schools should outsource their cleaning, but simply evidence that the professionalisation of the cleaning function leads to significant efficiencies. Increasing the management, skills and equipment of the cleaning team can also occur in-house. Recommendation: What’s your cleaning KPI? If materially adrift it would be worth commissioning a ‘time and motion’ study of the cleaning function from experts in the field.
Maintenance Per Square Metre
This KPI looks at what is normally the largest area of school operating expenditure after the teacher payroll. It comprises both the staff and non-staff spend across the maintenance function (excluding grounds), divided by the m2 of the built estate. It obviously excludes any capital projects.
As can be seen from Figure 5, the range of values is even more pronounced, where the fourth quartile average (£48.8/m2) is 250% higher than the first quartile average (19.6/m2). If we recognise that some of those in the first quartile are certainly under-spending due to budget constraints, and some of those in the fourth quartile are having to play expensive catch-up (it’s always more expensive to fix after it’s broken), and thus this 250% range is potentially misleading, even the range between second and third quartiles is revealing (£29.8/m2 versus £38.4/m2, that is, plus-30%).
Having carried out a significant number of subsequent ‘deep-dive’ assignments into how efficiently estates departments are run it’s clear that in general the estates department within schools is often underdeveloped, under-skilled, and focusing too much on the day-to-day ‘reactive’ responses at the expense of longer-term planning (‘proactive’). The upside of this assessment, however, is that there are significant gains to be made in improving the function of the estates team. As an example, if a typical all-years day school has an estate of around 20,000m2, improving its position from the third to the second quartile is worth £170,000 per annum.
Recommendation: Is your estates department reactive or proactive? If you consider that your current budget represents normal course of business, what quartile are you in? If third or fourth quartile, consider engaging with an expert on how to improve performance.
Conclusion
As the above shows, in just three key operating areas (energy, cleaning, maintenance), there are very significant differences between the best and worst performers. The same kind of differences also exist in other large spend items (catering, IT and photocopying, grounds, academic budgets, marketing and administrative functions.)
It’s generally the case that schools in more challenging geographical locations can be expected to be first or second quartile for the big-ticket items, probably because the reality of their parental finances has meant that they’ve had to exercise tight cost control for decades. By contrast, those schools within affluent areas will often be third or fourth quartile, probably because they haven’t faced the same pressures.

What the above, and the full range of benchmarking results both show, is that it’s worth being curious about your own support services KPIs, and tracking how they evolve from one year to the next. There are material sums to be gained by working to improve the efficiency of those KPIs where the school is off the pace of its peers. Improving many of these KPIs is not contingent on spending additional monies, but it does require staff of appropriate seniority and experience to have bandwidth to spend quality time on the issues, sometimes at very precise moments in time, such as contract renewals.


