
UTILIZATION OF WASTE PLASTIC IN FLEXIBLE PAVEMENTS
1Senoir Assistant Professor, Department of Civil Engineering, Gayatri Vidya Parishad College for Degree and PG Courses(A), Rushikonda, Visakhapatnam, A.P, India
2,3,4,5,6B. Tech, Department of Civil Engineering, Gayatri Vidya Parishad College for Degree and PG Courses(A), Rushikonda, Visakhapatnam, A.P, India ***
Abstract - Plastics are non-biodegradable materials and their omnipresence degrades our environment. The waste plastic and its disposal cause environmental pollution and global warming. Plastic waste can be used in flexible pavements by enhancing the bitumen properties and strength. Various defects in Road Pavements i.e., pot holes, corrugation, ruts, etc. can be remedied using waste plastic in the form polyethylene and poly-propylene. A series of tests were performed on the bitumen with conventional and plastic mix with 4%, 5% and 6% of Binder content. The Marshall method of mix design is used for the determination of optimum bitumen content. It is further used for the design of flexible bituminous pavement using VG-30 grade of bitumen. The Results of plastic mix has shown an increase in its stability value when compared with conventional mix. From the results, 5% binder content has the maximum stability value. Hence, it is considered as the optimum bitumen content for the design of flexible pavements.
Key Words: Marshall stability, bituminous mix, nonbiodegradable, waste plastic, flexible pavement, optimum bitumencontent,binder,stability.
1.INTRODUCTION
Plastics are non-biodegradable materials and their omnipresencedegradesourenvironment.Thewasteplastic and its disposal cause environmental pollution and global warming Plastics are a wide range of synthetic or semisyntheticmaterialsthatusepolymersasamainingredient. Theirplasticitymakesitpossibleforplasticstobemoulded, extrudedorpressedintosolidobjectsofvariousshapes.This adaptability,plusawiderangeofotherproperties,suchas being lightweight, durable, flexible, and inexpensive to produce,hasledtoitswidespreaduse.Plasticcanbedivided intotwocategories-thermoplastics&thermosettingplastics. Thermoplastics have high durability, resists humidity and other harsh environments, no chemical reaction occur duringapplicationprocessing.Therefore,canbeprimarily usedinthepavementconstruction.Researcheshaveshowed thatplasticcanbeusedfortheconstructionofbituminous roads as well, in fact Plastics used are high-density polyethylene,polypropylenesince,theyareinexpensiveand exhibit high flexural strength and resistance to moisture. Generally,Pavementfailuresoccurduetoinsufficientquality ofmaterialsorinadequatedrainageandthewaterseepsinto
the pavement layers, makes the material loose and that createspotholesandmanyotherfailures.Plasticswhenused inpavementsproduceshighstability,goodbindingproperty and does not allow water to seep through it and thus becomesasolutionformanypavementfailures. According to the Guidelines on use of Plastic Waste in Road ConstructionbyMinistryofrailways,wasteplasticof6to8 percent of the weight of bitumen is used for bituminous concrete.Marshallstabilitytestswereperformedonthemix withvaryingproportionofbitumentocomparetheresults without plastic and to determine the optimum bitumen content
1.1 Objectives
1) Toutilizetheplasticwasteinconstructionandreduceits impactonenvironment.
2) Toevaluatetheoptimumbitumencontent.
3) To analyze and compare the performance tests like Marshallstabilityvalueforconventionalbituminousmix andmodifiedbituminousmix.
1.2 Scope of work
Thisstudy mainlyfocusesonincreasingthestrength of pavementsothatitcanincreasethelifespanoftheflexible pavementhowevermainscopeofcurrentprojectworkare:
Toeradicatethepavementfailures.
To minimize the plastic waste impact on the environment.
Toreducethemaintenancecostoftheroad.
Toincreasethestabilityofbituminousconcrete.
2. LITERATURE REVIEW
1.Partial replacement of bitumen with plastic waste in flexiblepavements(IRJET)ISSN:2395-0056Volume-7Issue7 [U. Sathish, A. V. Sandeep, K. Shyam Kumar, V. Hari Gopal, K. Hari Krishna and J. Asha Jyothi, 2020] 2. The design of Flexible Pavement using plastic waste [ Devesh ojha et al, 2014] 3. Experimental Investigation of PlasticCoated Aggregate (IJERT) ISSN: 2278-0181 Special Issue2021 [ Yogita Bhiva Alave, Sanika Shekhar Mahimkar,

Ketki Sanjay Patil, Jayprakash Jiyala Gupta, Arbaz Kazi, 2021] 4. UseofPlasticWasteinFlexiblePavement-Green Highway (IJERT) ISSN:2278-0181 Volume-9 Issue-9 [ PrashantSingh,AbhishekKumar,ShushantSingh,Rajeev Rajput, Chhabi Lal Singh,2020] 5. Anapproachtotheusage of polyethylene terephthalate (PET) waste as roadway pavementmaterial [ Metin Guru, M. Kursat Cubuk, Deniz Arslan, S. Ali Farzanian, Ibrahim Bilici, 2014] 6. An OverviewonWastePlasticUtilizationinAsphaltingofRoads ISSN:0976-7916 [ Amit Gawande, G. Zamare, V.C. Renge, Saurabh Tayde, G. Bharsakale]
3. MATERIALS AND METHODOLOGY
A. Materials Used:
1.Aggregatesofsize20mm-2.36mm
2.BitumenofVG-30category
3.Cement(filler)
4.Plasticwaste
Highdensitypolyethylene
Polypropylene
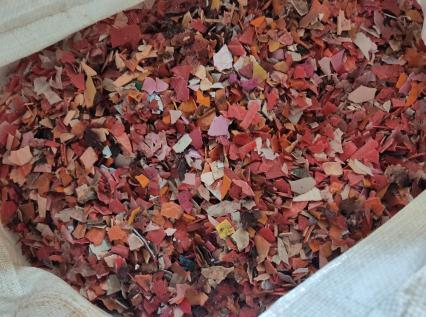
Plasticusediscollectedfromthewasteplasticitemssuch as buckets, jars, bags, covers, bottles,...etc. This collected wasteisshreddedintopiecesofsize10-20mmwiththehelp ofplasticshreddingmachine.Accordingto“Guidelinesonuse of Plastic Waste in Road Construction” by ministry of railways, wasteplastic of 6to 8 %of weightof bitumenis usedforbituminousconcrete.
is polyethylene, polypropylene shredded into pieces and mixedalongwiththehotbituminousmix.Thisbituminous mix undergoes marshall stability test andtheresults were compared with conventional mix to obtain the optimum bitumencontentistheprocessinvolvedinourmethodology. The proposed methodology chart of the project is shown below:
Fig-1 Shredded waste plastic
B. Methodology:
The methodology is the general research stratergy that outlinesthewayinwhichresearchistobeundertakenand, amongotherthings,identifiesthemethodstobeusedinit.A proper organized research plan is required to complete a project with the deadlines and to reach to a conclusion. It begins from the procurement of materials, conducting preliminary tests on the aggregates and bitumen. Experimental investigation of aggregate includes various testslikecrushing,impact,abrasion…etc.andtheplasticused
3.1 Tests on Aggregate
1. Crushing test
Theaggregatecrushingvalueprovidesarelativemeasureof resistancetocrushingundergraduallyappliedcrushingload. ThetestisstandardizedbyIS:2386part-Ⅳ
Table No.: 1 Summary of Crushing Test on Aggregate
SNO Observation Readings
1 Total weight of dry sample(W1)ingm 2890
2 Weight of fines passing 2.36mm sieve(W2)ingm
730
3 Aggregate crushing value=W2/W1*100 25.25
2. Impact test
It is the ability of aggregates that resist sudden impact or shockloadonit.TheAggregateimpacttestiscarriedoutto evaluatetheresistancetoimpactofaggregates.Thetestis standardizedbyIS:2386part-Ⅳ 1963
The specific gravity is usually showed the strength and qualityofthematerial.ThistestisstandardizedbyIS:2386 part3-1963
Abrasion test is the measure of aggregate toughness and abrasion resistance such as crushing, degradation and disintegration.Theabrasiontestofaggregateisdoneasper IS:2386part4-1963.
1 Originalweightof aggregate(W1)in gm
2 Weightofsample retainedon1.7mm ISsieve(W2)ingm
5000
4060
3 Lossinweightdue towear(W1-W2)gm 940
3 Abrasionvalue= (W2-W1)/W1 *100 18.80%
5. Sieve Analysis
TheSieveanalysisofcoarseaggregatetestindicatesthesize distributionofcoarseaggregateparticlesina givencoarse aggregatesample.Thefinenessmodulusistheindicationof themeansizeoftheparticles.Thefinenessmodulusisused to grade the given aggregate. This is done as per IS:3831970.
Finenessmodulusofaggregate=6.3
3.2 Tests on Bitumen
1. Penetration Test
Waterabsorptionofaggregatesisthe%ofwaterabsorbedby anair-driedaggregatewhenimmersedinwaterat27∘Cfora periodof24hours.ThistestisstandardizedbyIS:2386part 3-1963.
It measures the hardness or softness of bitumen by measuring the depth in tenths of a millimeter to which a standardloadedneedlewillpenetrateverticallyin5seconds. ItisdoneinaccordancewithIS:1203-1978.
2. Ductility Test
Ductilityisthepropertyofbitumenthatpermitsittoundergo greatdeformationorelongation.Thistestwascarriedoutin accordancewithIS:208-1978.
3.
Softening point denotes the temperature at which the bitumen attainsa particulardegree of softening under the specifications of test. The test is conducted in accordance withIS:1205-1978.
TheSummaryofresultsobtainedofthevarioustest mentionedaboveisshowninthetablebelow:
Table No.:6 Summary of Test Results Conducted on Bitumen
Preparation of Test Specimen
1. 1200 grams of aggregate blended in the desired proportionsismeasuredandheatedintheoventothe mixingtemperature.
2. Bitumenisaddedatthemixingtemperaturetoproduce viscosityof170±centi-stokesatvariouspercentages.
3. The materials are mixed in a heated pan with heated mixingtools.
4. Themixtureisreturnedtotheovenandreheatedtothe compacting temperature (to produce viscosity of 280±30centi-stokes).
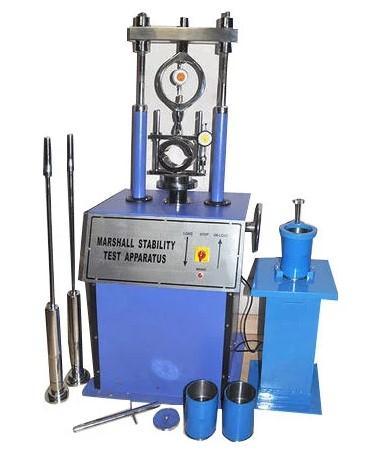
3.3 Marshall Stability Test
ThedetailedprocedureoffindingstabilityandFlowofthe bitumenusingmarshalstabilitytestasperIRC111:2009is presentedbelow:
Requirements:
Cylinder:Día=101.6mm,Height=63.5mm
Hammer
MSTloadapplicationmachine
Weighingmachine
Specimenextractor
Waterbath
Oven
5. ThemixtureisthenplacedinaheatedMarshallmould withacollarandbaseandthemixtureisspadedaround thesidesofthemould.Afilterpaperisplacedunderthe sampleandontopofthesample.
6. The mould is placed in the Marshall Compaction pedestal.
7. The material is compacted with 75 blows of the hammer,andthesampleisinvertedandcompactedin theotherfacewithsamenumberofblows.
8. Aftercompaction,themouldisinverted.Withcollaron the bottom, the base is removed and the sample is extractedbypushingitouttheextractor.
9. Thesampleisallowedtostandforthefewhourstocool.
10. Themassofthesampleinairandwhensubmergedis usedtomeasurethedensityofspecimen,soastoallow, calculationofthevoidproperties.
Marshall Test Procedure
1. Specimensareheatedto60±1°Ceitherinawaterbath for 30 - 40 minutes or in an oven for minimum of 2 hours.
2. The specimens are removed from the water bath or ovenandplaceinlowersegmentofthebreakinghead. Theuppersegmentofthebreakingheadofthespecimen is placed in position and the complete assembly is placedinpositiononthetestingmachine.
3. The flow meter is placed over one of the posts and is adjustedtoreadzero.
4. Loadisappliedatarateof50mmperminuteuntilthe maximumloadreadingisobtained.
5. ThemaximumloadreadinginNewtonisobserved.At thesameinstanttheflowasrecordedontheflowmeter inunitsofmmwasalsonoted.
6. Marshallstabilityvalue=InitialMarshallstabilityvalue *correctionfactor
3.4 Conclusion for Aggregate and Bitumen Tests
The various tests on Aggregates have shown favorable results and they are proven to be strong according to the codalrecommendations.Apartthebitumenobtainedfrom thesourceisVG30whichisbeingconfirmedbycomparing resultswithISstandards.
3.5 Conclusion for Marshall stability Test
Marshall stability test is conducted on 4%, 5% and 6% bitumen content, 3 specimens were prepared for each percentage and tested. The test is done on conventional samples without plastic and same process is repeated by adding 8% of plastic to the weight of binder content. The resultsof stabilityandflowvalueswerecompared
4. RESULTS AND DISCUSSION
Afterevaluatingtheresultsofmarshalstabilitytest,thenext stepwastofindthepropertiesofthemixlikebulkspecific gravity, percent air voids…etc. These properties should be calculated for each specimen and results were verified to obtain the optimum bitumen content. The parameters obtainedfor5%bituminousmixareshownbelow,similar steps were done finding parameters of other remaining contentswithandwithoutplastic.
Weightofsampleinair(Wa)=1150gm
Weightofsampleinwater(Ww)= 690gm
Weightofcoarseaggregate(W1)=1200gm
Weightoffiller(W2)=48gm
Weightofbitumen(Wb)=60gm
Specificgravityofcoarseaggregate(G1)=2.77
Specificgravityoffiller(G2)=3.1
Specificgravityofbitumen(Gb)=1.01
1. Theoreticalspecificgravityofthemix(Gt)
Gt = W1 +W2 +Wb
W1 +W2 +Wb
G1 +G2 + Gb = 1200+48+60
1200/2.77+48/3.1+60/1.01 = 2.57
2. Bulkspecificgravityofthemix(Gmb)
Gm = Wm
Wm -Ww = 1150 1150-690 = 2.5
3. Percentage air voids (Vv)
Vv = (Gt –Gm)100
Gt = (2.57-2.5)100
2.57 = 2.72 %
4. Percent volume of bitumen (Vb)
Wb
Vb = Gb
W1 +W2 +Wb
Gm = 60 × 2.5
1.01 1308
5. Voidsinmineralaggregate(VMA)
=VV+Vb = 2.72+11.3 = 14.02%
6. Voidsfilledwithbitumen(VFB)
= Vb *100
= 11.3 × 100 14.02 = 80.59%
Thesameprocedureisappliedtocalculatethepropertiesof plasticmixbyconsideringweightandspecificgravityofthe plasticalso.TheresultswereshowninTable-11
Theaverageiscalculatedfromtheresultsof3specimensfor eachpercentageandrepresentedinthetablebelow.
gradually.Thatmaximumstabilityvalueisnotedandtobe consideredforobtainingtheoptimumbitumencontent. Table
4.1
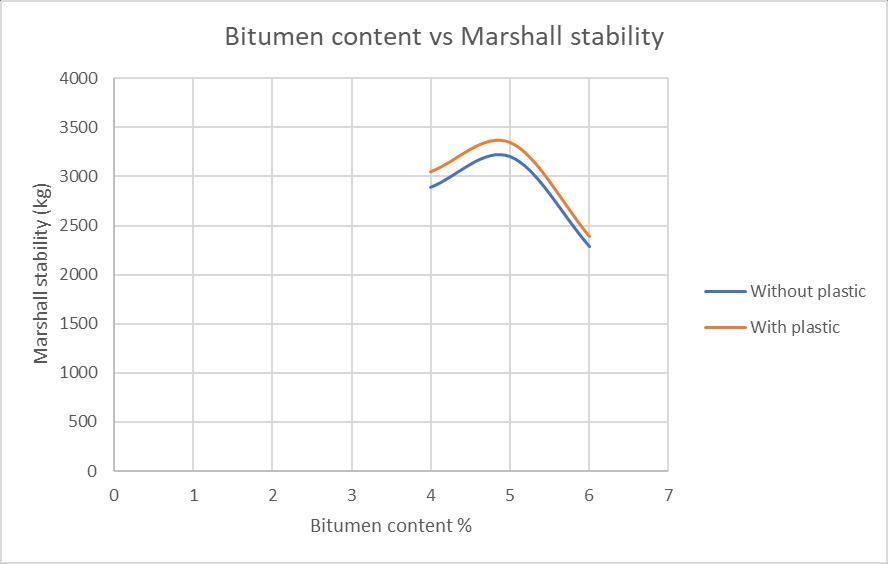
TheMarshallstabilityvaluegraduallyriseswiththeincrease inbindercontent uptoacertainpointandthendecreases
Followinggraphsshowthevariationintestwiththevariation inbitumenandalsothecomparisonofdifferentpropertiesof nominalandplasticbituminousmix.
Fig-3 shows the variation in Marshall stability with percentage of bitumen where it is seen that 5% bitumen contentgavethehigherstabilityvalueandalsothestability increasedcomparativelyintheplasticmix.
Fig-4 showsthevariationinMarshallflowwithpercentageof bitumen where it is seen that flow value is increased in plasticwhencomparedwithconventionalbituminousmix.
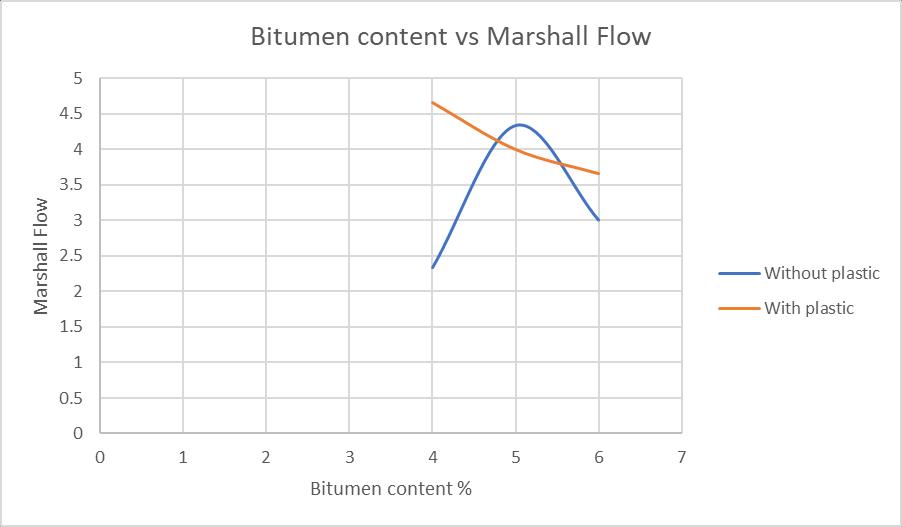
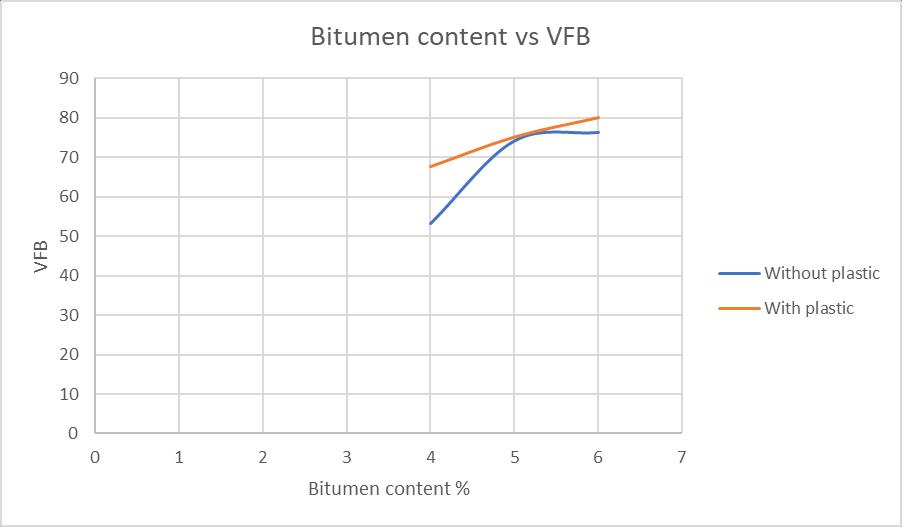
Fig-6showsthevariationinVoidsfilledwithbitumen(VFB) withpercentageofbitumenwhereitis seenanincreasein theVFBwithincreasingthebitumencontent.
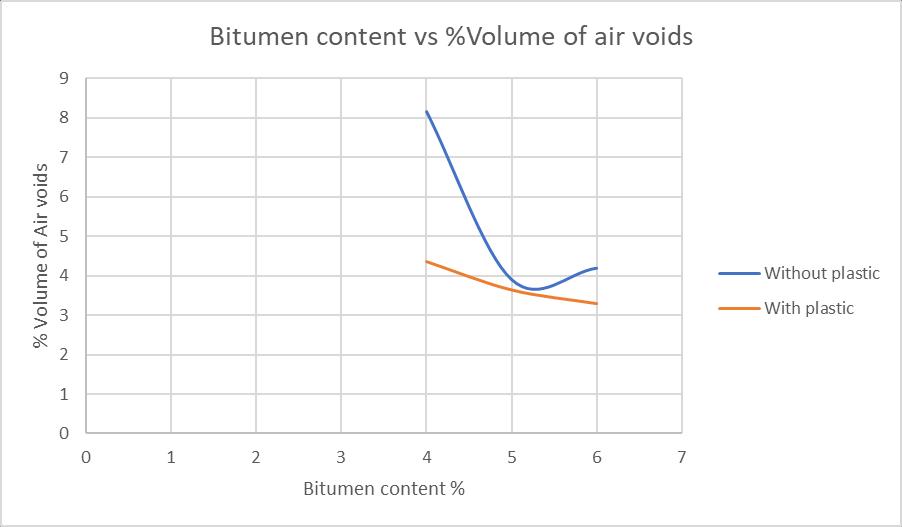
Fig-5 shows the variation in volume of air voids with percentageofbitumenwhereitisseenagradualreductionof airvoidswithincreaseinbitumen.
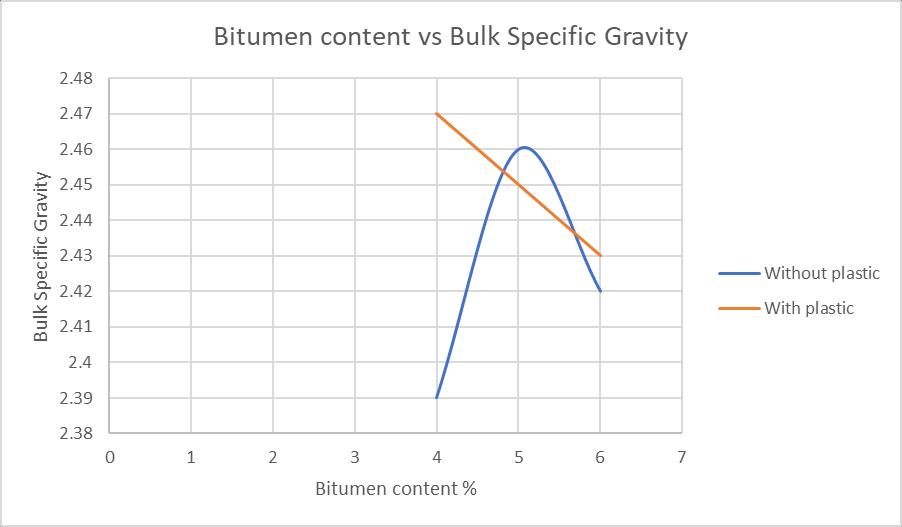
Fig-7 shows the variation in bulk specific gravity with bitumen content where it seen that usually a decreasing trendisfollowedwithincreaseinbitumencontent.
To determine the optimum binder content for the mix design by taking average value of the following three bitumen contents found from the graphs obtained in the previousstep.
1. Bindercontentcorrespondingtomaximumstability
2. Bindercontentcorrespondingtomaximumbulkspecific gravity(Gm)
3. Bindercontentcorrespondingtothemedianofdesigned limitsofpercentairvoids(Vv)inthetotalmix.
Optimum bitumen content = (5+5+5) / 3 = 5 %
Herethemixhashigherpropertiesat5%bitumencontentin both nominal and plastic mix also. The stability value is increasedinadditionofplastic. Afterfindingtheoptimum bitumencontentforthedesignmix,nextstepistocheckthe stabilityvalue,flowvalue,andVFBwithMarshallmixdesign specificationchartgiveninTablebelow.
Table No.: 11 IRC 94-1966 Specification
REFERENCES
[1] U. Sathish, A. V. Sandeep, K. Shyam Kumar, V. Hari Gopal, K. Hari Krishna and J. Asha Jyothi, “Partial replacement of bitumen with plastic waste in flexible pavements”,(IRJET)ISSN:2395-0056Volume-7Issue-7 ,2020
[2] Devesh ojha et al ,“The design of Flexible Pavement usingplasticwaste”,2014
[3] Yogita Bhiva Alave, SanikaShekharMahimkar,Ketki Sanjay Patil, Jayprakash Jiyala Gupta, Arbaz Kazi, “ExperimentalInvestigationofPlastic-CoatedAggregate” (IJERT)ISSN:2278-0181SpecialIssue-2021
[4] Prashant Singh, Abhishek Kumar, Shushant Singh, Rajeev Rajput, Chhabi Lal Singh, “UseofPlasticWaste in Flexible Pavement-Green Highway” (IJERT) ISSN:2278-0181Volume-9Issue-9[2020]
4. CONCLUSIONS
1. Recycledplasticalongwithaggregatesisusedforbetter performance of roads. Usage of waste plastic in the bituminousconcreteincreasedthestabilitysothatthe loadcarryingcapacityoftheroadwillalsogetincreased.
2. Plasticwhenmixedwiththehotbituminousmixitgets softenedandactsasagoodbinder.Thus,permeability reduceswhich means thatthemixture becomesmore intactthus providing a solutionupto some extentfor stagnationofwater.
3. Accordingtothegraphsitis proventhatusingplastic increasedthevoidsfilledwithbitumen
4. Thedecreaseinairvoidspercentageisalsoobservedin the plastic mix thus, preventing the pavement from minorfailures.
5. The Results have shown higher stability value at 5% bindercontent.Hence,itisconsideredastheoptimum bitumencontentforthedesignofbituminousconcrete mix along with 8% plastic to the weight of bitumen. Thisdesignmixisusedtoconstructaflexiblepavement
6. Theincreasingplasticwastecanbereducedefficiently by using it in construction of flexible pavements, but experimental study should be properly carried out beforecomingtoaconcreteconclusion
[5] Metin Guru, M. Kursat Cubuk, Deniz Arslan, S. Ali Farzanian, Ibrahim Bilici,“Anapproachtotheusageof polyethylene terephthalate (PET) waste as roadway pavementmaterial”.[2014]
[6] Amit Gawande, G. Zamare, V.C. Renge, Saurabh Tayde, G. Bharsakale, “AnOverviewonWastePlastic UtilizationinAsphaltingofRoads”ISSN:0976-7916