
ProducedbyFloridaRealtors®withdataprovidedbyFlorida'smultiplelistingservices.StatisticsforeachmonthcompiledfromMLSfeedsonthe15thdayofthefollowingmonth. DatareleasedonThursday,August18,2022.NextdatareleaseisWednesday,September21,2022. Economists' note : ClosedSalesareoneofthesimplest—yetmost important—indicatorsfortheresidentialrealestatemarket. When comparingClosedSalesacrossmarketsofdifferentsizes,we recommendcomparingthepercentchangesinsalesratherthanthe numberofsales. ClosedSales(andmanyothermarketmetrics)are affectedbyseasonalcycles,soactualtrendsaremoreaccurately representedbyyear-over-yearchanges(i.e.comparingamonth'ssales totheamountofsalesinthesamemonthinthepreviousyear),rather thanchangesfromonemonthtothenext. June 2022 11,796 -20.9%-14.4%-27.0%May 2022 13,265 April 2022 13,711 21.1% October 2021 11,433 September 2021 11,845 -11.4%13.1%-5.6%4.9%-3.6%0.3%5.4%6.7%August 2021 12,550 July 2021 13,481 December 2021 12,789 November 2021 11,598 March 2022 14,631 February 2022 10,975 January 2022 10,25299.5% 0.5% 13 Days 15 Days -13.3% July 2022 Median Time to Contract 529,765DaysMedian Time to Sale New Pending Sales New Listings Month 13,442 Pending Inventory 15,965 Inventory (Active Listings) 25,372 Months Supply of Inventory 2.1 -8.8% 12,857 -24.0% Percent Year-over-YearChange $253,000 20.6% $3.9 Billion $5.0 Billion -22.7% $414,445 $371,530 11.6% July 2021 Percent Year-over-YearChange 4,773 6,794 -29.7% 9,341 13,481 -30.7% Summary Statistics Closed Sales Paid in Cash 100.0% July 2022 $305,000Median Sale Price Average Sale Price Dollar MedianVolumePercent of Original List Price Received Year-to-Date 83,971 -16.0% -30.7% 14,507 -7.3% Closed Sales 9,341 5720,993Days -24.0% 23,180 9.5% 1.8 16.7% 2018 2019 2020 2021 2022 J F M A M J J A S O N D J F M A M J J A S O N D J F M A M J J A S O N D J F M A M J J A S O N D J F M A M J J Monthly Market Detail - July 2022 TownhousesFlorida and Condos Closed Sales The number of sales transactions which closed during the month 20,00015,00010,0005,0000SalesClosed


ProducedbyFloridaRealtors®withdataprovidedbyFlorida'smultiplelistingservices.StatisticsforeachmonthcompiledfromMLSfeedsonthe15thdayofthefollowingmonth. DatareleasedonThursday,August18,2022.NextdatareleaseisWednesday,September21,2022. 50.4% 18.9% October 2021 50.2% November 2021 5,886 20.3% October 2021 5,889 22.9% August 2021 6,256 12.8%32.9% September 2021 49.7% Economists' note : Thisstatisticissimplyanotherwayofviewing CashSales. TheremainingpercentagesofClosedSales(i.e.thosenot paidfullyincash)eachmonthinvolvedsomesortoffinancing,suchas mortgages,owner/sellerfinancing,assumedloans,etc. Economists' note : CashSalescanbeausefulindicatoroftheextentto whichinvestorsareparticipatinginthemarket. Why? Investorsare farmorelikelytohavethefundstopurchaseahomeavailableupfront, whereasthetypicalhomebuyerrequiresamortgageorsomeother formoffinancing. Thereare,ofcourse,manypossibleexceptions,so thisstatisticshouldbeinterpretedwithcare. Year-to-Date 55.1% 8.9% Month Percent of Closed Sales Paid in Cash Percent Year-over-YearChange August 2021 49.8% 17.5% July 2021 July 2021 6,794 44.0% September 2021 17.2% March 2022 56.2% 12.4% February 2022 55.6% 8.6% January 2022 52.9% 12.3% December 2021 50.4% 13.5% November 2021 50.8% 14.2% May 2022 56.7% 9.2% April 2022 57.4% 13.4% July 2022 51.1% 1.4% June 2022 53.8% 3.7% 5,741 6.5% 7,864 -10.3% March 2022 8,219 -0.6% December 2021 6,444 13.8% February 2022 6,106 4.8% January 2022 5,420 19.9% April Month2022 Cash Sales Percent Year-over-YearChange July 2022 4,773 -29.7% June 2022 6,344 -24.3% May 2022 7,522 -6.5% Year-to-Date 46,248 -8.6% J F M A M J J A S O N D J F M A M J J A S O N D J F M A M J J A S O N D J F M A M J J A S O N D J F M A M J J J F M A M J J A S O N D J F M A M J J A S O N D J F M A M J J A S O N D J F M A M J J A S O N D J F M A M J J 70%60%50%40%30%20%10%0%SalesClosedofPct. CashinPaid 10,0008,0006,0004,0002,0000SalesCash Monthly Market Detail - July 2022 2018 2019 2020 2021 2022 TownhousesFlorida and Condos Cash Sales The number of Closed Sales during the month in which buyers exclusively paid in cash 2018 2019 2020 2021 2022 Cash Sales as a Percentage of Closed Sales The percentage of Closed Sales during the month which were Cash Sales
ProducedbyFloridaRealtors®withdataprovidedbyFlorida'smultiplelistingservices.StatisticsforeachmonthcompiledfromMLSfeedsonthe15thdayofthefollowingmonth. DatareleasedonThursday,August18,2022.NextdatareleaseisWednesday,September21,2022. 19.0%$457,040Year-to-Date Economists' note : MedianSalePriceisourpreferredsummary statisticforpriceactivitybecause,unlikeAverageSalePrice,Median SalePriceisnotsensitivetohighsalepricesforsmallnumbersof homesthatmaynotbecharacteristicofthemarketarea. Keepinmind thatmedianpricetrendsovertimearenotalwayssolelycausedby changesinthegeneralvalueoflocalrealestate. Mediansalepriceonly reflectsthevaluesofthehomesthat sold eachmonth,andthemixof thetypesofhomesthatsellcanchangeovertime. Economists' note : Usually,wepreferMedianSalePriceoverAverage SalePriceasasummarystatisticforhomeprices. However,Average SalePricedoeshaveitsuses—particularlywhenitisanalyzed alongsidetheMedianSalePrice. Forone,therelativedifference betweenthetwostatisticscanprovidesomeinsightintothemarketfor higher-endhomesinanarea. August 2021 $363,533 18.9% July 2021 $371,530 28.1% October 2021 $359,675 19.6% September 2021 $361,304 18.7% March 2022 $474,540 25.5% February 2022 $445,528 19.0% January 2022 $417,544 19.6% December 2021 $423,794 24.6% November 2021 $395,190 22.4% May 2022 $482,557 19.2% April 2022 $465,656 16.4% July 2022 $414,445 11.6% June 2022 $475,395 21.6% July 2021 $253,000 20.5% Month Average Sale Price Percent Year-over-YearChange September 2021 $255,000 17.2% August 2021 $252,500 16.1% November 2021 $273,270 19.9% October 2021 $260,000 17.6% $310,000 24.0% March 2022 $308,000 27.3% December 2021 $285,000 23.9% June 2022 $324,900 26.4% May 2022 $322,000 28.8% February 2022 $290,000 24.3% January 2022 $285,000 23.9% April Month2022 Median Sale Price Percent Year-over-YearChange July 2022 $305,000 20.6% Year-to-Date $306,000 24.9% J F M A M J J A S O N D J F M A M J J A S O N D J F M A M J J A S O N D J F M A M J J A S O N D J F M A M J J J F M A M J J A S O N D J F M A M J J A S O N D J F M A M J J A S O N D J F M A M J J A S O N D J F M A M J J $600K$500K$400K$300K$200K$100K$0KPriceSaleAverage $350K$300K$250K$200K$150K$100K$50K$0KPriceSaleMedian Monthly Market Detail - July 2022 2018 2019 2020 2021 2022 TownhousesFlorida and Condos Median Sale Price The median sale price reported for the month (i.e. 50% of sales were above and 50% of sales were below) 2018 2019 2020 2021 2022 Average Sale Price The average sale price reported for the month (i.e. total sales in dollars divided by the number of sales)
ProducedbyFloridaRealtors®withdataprovidedbyFlorida'smultiplelistingservices.StatisticsforeachmonthcompiledfromMLSfeedsonthe15thdayofthefollowingmonth. DatareleasedonThursday,August18,2022.NextdatareleaseisWednesday,September21,2022. 99.5% 4.1% October 2021 99.2% November 2021 $4.6 Billion 29.0% October 2021 $4.3 Billion 24.5% August 2021 $4.6 Billion 34.5%3.3% September 2021 99.3% Economists' note : TheMedianPercentofOriginalListPriceReceived isusefulasanindicatorofmarketrecovery,sinceittypicallyrisesas buyersrealizethatthemarketmaybemovingawayfromthemand theyneedtomatchthesellingprice(orbetterit)inordertogeta contractonthehouse. Thisisusuallythelastmeasuretoindicatea markethasshiftedfromdowntoup,soitiswhatwewouldcalla lagging indicator. Economists' note : DollarVolumeissimplythesumofallsaleprices inagiventimeperiod,andcanquicklybecalculatedbymultiplying ClosedSalesbyAverageSalePrice. Itisastrongindicatorofthehealth oftherealestateindustryinamarket,andisofparticularinterestto realestateprofessionals,investors,analysts,andgovernmentagencies. Potentialhomesellersandhomebuyers,ontheotherhand,willlikely bebetterservedbypayingattentiontotrendsinthetwocomponents ofDollarVolume(i.e.salesandprices)individually. 2.5%100.0%MonthYear-to-Date Med. Pct. of Orig. List Price Received Percent Year-over-YearChange August 2021 100.0% 4.3% July 2021 July 2021 $5.0 Billion 55.1% September 2021 3.4% March 2022 100.0% 3.1% February 2022 100.0% 3.7% January 2022 100.0% 4.0% December 2021 99.4% 3.4% November 2021 99.3% 3.1% May 2022 100.0% 1.7% April 2022 100.0% 2.5% July 2022 100.0% 0.5% June 2022 100.0% 1.0% $4.1 Billion 12.9% April 2022 $6.4 Billion -7.9% March 2022 $6.9 Billion 11.2% February 2022 $4.9 Billion 14.8% January 2022 $4.3 Billion 27.7% December 2021 $5.4 Billion 25.0% June 2022 $5.6 Billion -11.2% May 2022 $6.4 Billion 2.1% Month Dollar Volume Percent Year-over-YearChange July 2022 $3.9 Billion -22.7% Year-to-Date $38.4 Billion 0.0% J F M A M J J A S O N D J F M A M J J A S O N D J F M A M J J A S O N D J F M A M J J A S O N D J F M A M J J J F M A M J J A S O N D J F M A M J J A S O N D J F M A M J J A S O N D J F M A M J J A S O N D J F M A M J J 120%100%80%60%40%20%0%Orig.ofPct.Med. ReceivedPriceList $8$6$4$2$0BBBBVolumeDollar Monthly Market Detail - July 2022 2018 2019 2020 2021 2022 TownhousesFlorida and Condos Dollar Volume The sum of the sale prices for all sales which closed during the month 2018 2019 2020 2021 2022 Median Percent of Original List Price Received The median of the sale price (as a percentage of the original list price) across all properties selling during the month
ProducedbyFloridaRealtors®withdataprovidedbyFlorida'smultiplelistingservices.StatisticsforeachmonthcompiledfromMLSfeedsonthe15thdayofthefollowingmonth. DatareleasedonThursday,August18,2022.NextdatareleaseisWednesday,September21,2022. July 2021 57 Days -42.4% Economists' note : TimetoSaleisameasureofthelengthofthehome sellingprocess,calculatedasthenumberofdaysbetweentheinitial listingofapropertyandtheclosingofthesale. Median TimetoSaleis theamountoftimethe"middle"propertysellingthismonthwason themarket. Thatis,50%ofhomessellingthismonthtook less timeto sell,and50%ofhomestook more timetosell. MedianTimetoSale givesamoreaccuratepicturethanAverageTimetoSale,whichcanbe skewedupwardbysmallnumbersofpropertiestakinganabnormally longtimetosell.
September 2021 55 Days -30.4% August 2021 56 Days -34.1% November 2021 56 Days -28.2% October 2021 55 Days -28.6% April 2022 50 Days -24.2% March 2022 50 Days -29.6% February 2022 53 Days -32.1% January 2022 60 Days -25.9% December 2021 56 Days -27.3% June 2022 50 Days -15.3% May 2022 49 Days -21.0% Month Median Time to Sale Percent Year-over-YearChange July 2022 52 Days -8.8% -22.4%52 DaysAugustYear-to-Date2021 15 Days -66.7% July 2021 15 Days -73.7% 15 Days -59.5% September 2021 14 Days -63.2% October 2021 March 2022 11 Days -65.6% February 2022 14 Days -63.2% January 2022 16 Days -59.0% December 2021 16 Days -55.6% November 2021 15 Days -58.3% Month Median Time to Contract Percent Year-over-YearChange July 2022 13 Days -13.3% 12 Days -52.0%JuneYear-to-Date2022 12 Days -29.4% May 2022 10 Days -47.4% April 2022 10 Days -58.3% J F M A M J J A S O N D J F M A M J J A S O N D J F M A M J J A S O N D J F M A M J J A S O N D J F M A M J J J F M A M J J A S O N D J F M A M J J A S O N D J F M A M J J A S O N D J F M A M J J A S O N D J F M A M J J 120100806040200toTimeMedian Sale 706050403020100toTimeMedian Contract Monthly Market Detail - July 2022 2018 2019 2020 2021 2022 TownhousesFlorida and Condos Median Time to Contract The median number of days between the listing date and contract date for all Closed Sales during the month 2018 2019 2020 2021 2022 Median Time to Sale The median number of days between the listing date and closing date for all Closed Sales during the month
Economists' note : LikeTimetoSale,TimetoContractisameasureof thelengthofthehomesellingprocesscalculatedforsaleswhichclosed duringthemonth. ThedifferenceisthatTimetoContractmeasures thenumberofdaysbetweentheinitiallistingofapropertyandthe signingofthecontractwhicheventuallyledtotheclosingofthesale. WhenthegapbetweenMedianTimetoContractandMedianTimeto Salegrows,itisusuallyasignoflongerclosingtimesand/ordeclining numbersofcashsales.
ProducedbyFloridaRealtors®withdataprovidedbyFlorida'smultiplelistingservices.StatisticsforeachmonthcompiledfromMLSfeedsonthe15thdayofthefollowingmonth. DatareleasedonThursday,August18,2022.NextdatareleaseisWednesday,September21,2022. Year-to-Date 103,100 -2.9% August 2021 14,010 1.4% March 2022 16,124 -3.4% February 2022 13,950 -3.3% January 2022 13,786 -7.4% December 2021 July 2021 14,507 4.6% October 2021 13,303 -9.0% September 2021 13,238 -7.3% 10,485 -6.4% November 2021 12,065 -6.9% May 2022 15,488 3.4% April 2022 14,834 -6.8% July 2022 13,442 -7.3% June 2022 15,476 4.7% July 2021 12,857 0.6% Month New Listings Percent Year-over-YearChange September 2021 12,629 -3.0% August 2021 13,183 3.7% November 2021 12,607 5.9% October 2021 13,430 0.4% January 2022 14,200 -7.3% April 2022 13,483 -23.9% March 2022 15,381 -30.1%-21.3%May 2022 12,322 -25.1% February 2022 14,235 -17.1% Economists' note : NewListingstendtoriseindelayedresponseto increasingprices,sotheyareoftenseenasalaggingindicatorof markethealth. Aspricesrise,potentialsellersraisetheirestimations ofvalue—andinthemostrecentcycle,risingpriceshavefreedup manypotentialsellerswhowerepreviouslyunderwaterontheir mortgages. Notethatinourcalculations,wetakecaretonotinclude propertiesthatwererecentlytakenoffthemarketandquicklyrelisted, sincethesearenotreally new listings. Economists' note : Becauseofthetypicallengthoftimeittakesfora saletoclose,economistsconsiderPendingSalestobeadecent indicatorofpotentialfutureClosedSales. Itisimportanttobearin mind,however,thatnotallPendingSaleswillbeclosedsuccessfully. So,theeffectivenessofPendingSalesasafutureindicatorofClosed Salesissusceptibletochangesinmarketconditionssuchasthe availabilityoffinancing forhomebuyersandtheinventoryof distressedpropertiesforsale. Month New Pending Sales Percent Year-over-YearChange July 2022 9,765 -24.0% Year-to-Date 89,614 -21.2% December 2021 11,399 -2.4% June 2022 10,228 J F M A M J J A S O N D J F M A M J J A S O N D J F M A M J J A S O N D J F M A M J J A S O N D J F M A M J J J F M A M J J A S O N D J F M A M J J A S O N D J F M A M J J A S O N D J F M A M J J A S O N D J F M A M J J 20,00015,00010,0005,0000ListingsNew 25,00020,00015,00010,0005,0000SalesPending Monthly Market Detail - July 2022 2018 2019 2020 2021 2022 TownhousesFlorida and Condos New Pending Sales The number of listed properties that went under contract during the month 2018 2019 2020 2021 2022 New Listings The number of properties put onto the market during the month
ProducedbyFloridaRealtors®withdataprovidedbyFlorida'smultiplelistingservices.StatisticsforeachmonthcompiledfromMLSfeedsonthe15thdayofthefollowingmonth. DatareleasedonThursday,August18,2022.NextdatareleaseisWednesday,September21,2022. June 2022 23,005 2.4% May 2022 18,725 -20.5% Month Inventory Percent Year-over-YearChange July 2022 25,372 9.5% 18,696 -34.5%YTD (Monthly Avg) -37.9% March 2022 15,483 -48.5% February 2022 15,461 -55.7% April 2022 21,29916,284 -54.2% January 2022 16,539 -58.0% December 2021 17,869 -57.4% November 2021 19,977 -56.0% October 2021 July 2022 2.1 16.7% June 2022 1.9 11.8% May 2022 1.5 -21.1% April 2022 1.3 -43.5% March 2022 1.2 -57.1% February 2022 1.2 -64.7% January 2022 1.2 -69.2% December 2021 1.3 -67.9%-69.0%November 2021 1.5 -68.1% October 2021 1.6 -67.3% July 2021 23,180 -53.7% September 2021 22,599 -52.2% August 2021 22,928 -52.4% Economists' note : Thereareanumberofwaystodefineandcalculate Inventory. Ourmethodistosimplycountthenumberofactivelistings onthelastdayofthemonth,andholdthisnumbertocomparewiththe samemonththefollowingyear. InventoryriseswhenNewListingsare outpacingthenumberoflistingsthatgooff-market(regardlessof whethertheyactuallysell). Likewise,itfallswhenNewListingsaren't keepingupwiththerateatwhichhomesaregoingoff-market. Economists' note : MSIisausefulindicatorofmarketconditions. The benchmarkforabalancedmarket(favoringneitherbuyernorseller)is 5.5monthsofinventory. Anythinghigheristraditionallyabuyers' market,andanythinglowerisasellers'market. Thereisnosingle acceptedwayofcalculatingMSI. Acommonmethodistodivide currentInventorybythemostrecentmonth'sClosedSalescount,but thiscountisausuallypoorpredictoroffutureClosedSalesdueto seasonalcycles. Toeliminateseasonaleffects,weusethe12-month averageofmonthlyClosedSalesinstead. YTD (Monthly Avg) 1.5 -40.0% Month Months Supply Percent Year-over-YearChange July 2021 1.8 -67.9% September 2021 1.7 -66.7% August 2021 1.7 J F M A M J J A S O N D J F M A M J J A S O N D J F M A M J J A S O N D J F M A M J J A S O N D J F M A M J J J F M A M J J A S O N D J F M A M J J A S O N D J F M A M J J A S O N D J F M A M J J A S O N D J F M A M J J 7.06.05.04.03.02.01.00.0ofSupplyMonths Inventory 70,00060,00050,00040,00030,00020,00010,0000Inventory Monthly Market Detail - July 2022 2018 2019 2020 2021 2022 TownhousesFlorida and Condos Inventory (Active Listings) The number of property listings active at the end of the month 2018 2019 2020 2021 2022 Months Supply of Inventory An estimate of the number of months it will take to deplete the current Inventory given recent sales rates
ProducedbyFloridaRealtors®withdataprovidedbyFlorida'smultiplelistingservices.StatisticsforeachmonthcompiledfromMLSfeedsonthe15thdayofthefollowingmonth. DatareleasedonThursday,August18,2022.NextdatareleaseisWednesday,September21,2022. $100,000 - $149,999 676 -59.6% Sale Price Closed Sales Percent Year-over-YearChange Less than $50,000 17 -76.7% $50,000 - $99,999 177 -77.2% $150,000 - $199,999 1,185 -45.3% $200,000 - $249,999 1,180 -37.7% $50,000 - $99,999 16 Days -42.9% $100,000 - $149,999 $400,000 - $599,999 1,596 -3.2% $600,000 - $999,999 818 -12.3% 15 Days -21.1% Economists' note: Closed Sales are one of the simplest—yet most important—indicators for the residential real estate market. When comparing Closed Sales across markets of different sizes, we recommend comparing the percent changes in sales rather than the number of sales. Closed Sales (and many other market metrics) are affected by seasonal cycles, so actual trends are more accurately representedbyyear-over-yearchanges(i.e.comparingamonth'ssales totheamountofsalesinthesamemonthinthepreviousyear),rather thanchangesfromonemonthtothenext. Sale Price Median Time to Contract Percent Year-over-YearChange Less than $50,000 35 Days 25.0% $1,000,000 or more 452 -27.2% $250,000 - $299,999 1,256 -17.9% $300,000 - $399,999 1,984 -8.4% Economists' note : LikeTimetoSale,TimetoContractisameasureof thelengthofthehomesellingprocesscalculatedforsaleswhichclosed during the month. The difference is that Time to Contract measures the number of days between the initial listing of a property and the signing of the contract which eventually led to the closing of the sale. When the gap between Median Time to Contract and Median Time to Salegrows,itisusuallyasignoflongerclosingtimesand/ordeclining numbersofcashsales. $150,000 - $199,999 13 Days 8.3% $200,000 - $249,999 13 Days 8.3% $250,000 - $299,999 $400,000 - $599,999 14 Days -12.5% 12 Days 9.1% $300,000 - $399,999 12 Days 0.0% $600,000 - $999,999 17 Days -29.2% $1,000,000 or more 23 Days -48.9% 0 5 353025201510 40 5045 Less$50,000than $50,000 $99,999- $100,000 $149,999- $150,000 $199,999- $200,000 $249,999- $250,000 $299,999- $300,000 $399,999- $400,000 $599,999- $600,000 $999,999- $1,000,000 or more ContracttoTimeMedian July 2021 July 2022 0 5 353025201510 40 5045 0 500 2,5002,0001,5001,000 Less$50,000than $50,000 $99,999- $100,000 $149,999- $150,000 $199,999- $200,000 $249,999- $250,000 $299,999- $300,000 $399,999- $400,000 $599,999- $600,000 $999,999- $1,000,000 or more SalesClosed July 2021 July 2022 0 500 2,5002,0001,5001,000 Monthly Market Detail - July 2022 TownhousesFlorida and Condos Closed Sales by Sale Price The number of sales transactions which closed during the month Median Time to Contract by Sale Price The median number of days between the listing date and contract date for all Closed Sales during the month
ProducedbyFloridaRealtors®withdataprovidedbyFlorida'smultiplelistingservices.StatisticsforeachmonthcompiledfromMLSfeedsonthe15thdayofthefollowingmonth. DatareleasedonThursday,August18,2022.NextdatareleaseisWednesday,September21,2022. Initial Listing Price New Listings Percent Year-over-YearChange Less than $50,000 28 -36.4% $50,000 - $99,999 187 -69.9% $100,000 - $149,999 724 -53.9% Economists' note: New Listings tend to rise in delayed response to increasing prices, so they are often seen as a lagging indicator of market health. As prices rise, potential sellers raise their estimations of value—and in the most recent cycle, rising prices have freed up many potential sellers who were previously underwater on their mortgages. Note that in our calculations, we take care to not include propertiesthatwererecentlytakenoffthemarketandquicklyrelisted, sincethesearenotreally new listings. $150,000 - $199,999 1,472 -37.5% $200,000 - $249,999 1,510 -26.8% $250,000 - $299,999 1,730 -2.9% $300,000 - $399,999 2,867 22.5% $400,000 - $599,999 2,664 42.3% $600,000 - $999,999 1,359 21.1% $1,000,000 or more 901 22.3% Current Listing Price Inventory Percent Year-over-YearChange Less than $50,000 18 -66.7% $50,000 - $99,999 246 -77.1% $100,000 - $149,999 982 -51.6% Economists' note : Thereareanumberofwaystodefineandcalculate Inventory. Ourmethodistosimplycountthenumberofactivelistings onthelastdayofthemonth,andholdthisnumbertocomparewiththe samemonththefollowingyear. InventoryriseswhenNewListingsare outpacing the number of listings that go off-market (regardless of whethertheyactuallysell). Likewise,itfallswhenNewListingsaren't keepingupwiththerateatwhichhomesaregoingoff-market. $150,000 - $199,999 2,081 -22.8% $200,000 - $249,999 2,148 -7.8% $250,000 - $299,999 2,560 15.5% $300,000 - $399,999 4,424 39.8% $400,000 - $599,999 5,278 52.0% $600,000 - $999,999 3,851 36.6% $1,000,000 or more 3,784 13.8% 6,0005,0004,0003,0002,0001,0000 Less$50,000than $50,000 $99,999- $100,000 $149,999- $150,000 $199,999- $200,000 $249,999- $250,000 $299,999- $300,000 $399,999- $400,000 $599,999- $600,000 $999,999- $1,000,000 or more Inventory July 2021 July 2022 0 500 3,5003,0002,5002,0001,5001,000 Less$50,000than $50,000 $99,999- $100,000 $149,999- $150,000 $199,999- $200,000 $249,999- $250,000 $299,999- $300,000 $399,999- $400,000 $599,999- $600,000 $999,999- $1,000,000 or more ListingsNew July 2021 July 2022 3,5003,0002,5002,0001,5001,00050006,0005,0004,0003,0002,0001,0000 Monthly Market Detail - July 2022 TownhousesFlorida and Condos New Listings by Initial Listing Price The number of properties put onto the market during the month Inventory by Current Listing Price The number of property listings active at the end of the month
Closed MedianClosedMedianClosedMedianSalesSalePriceSalesSalePriceSalesSalePrice ProducedbyFloridaRealtors®withdataprovidedbyFlorida'smultiplelistingservices.StatisticsforeachmonthcompiledfromMLSfeedsonthe15thdayofthefollowingmonth. DatareleasedonThursday,August18,2022.NextdatareleaseisWednesday,September21,2022. July 2022 July 2021 Percent Year-over-YearChange Traditional 9,289 13,396 -30.7% $305,000 $254,000 20.1% Foreclosure/REO 45 61 -26.2% $265,000 $196,550 34.8% Short Sale 7 24 -70.8% $183,000 $215,000 -14.9% $350K$300K$250K$200K$150K$100K$50K$0KPriceSaleMedian 80%70%60%50%40%30%20%10%0% 90% 100% SalesClosed Traditional Foreclosure/REO Short Sale J F M A M J J A S O N D J F M A M J J A S O N D J F M A M J J A S O N D J F M A M J J A S O N D J F M A M J J J F M A M J J A S O N D J F M A M J J A S O N D J F M A M J J A S O N D J F M A M J J A S O N D J F M A M J J Monthly Distressed Market - July 2022 TownhousesFlorida and Condos 2018 2019 2020 2021 2022 2018 2019 2020 2021 2022

Closed Sales Paid in Cash Median Sale Price Average Sale Price Dollar Volume Med. Pct. of Orig. List Price Received Median Time to Contract Median Time to Sale New Pending Sales New InventoryPendingListingsInventory(ActiveListings) ProducedbyFloridaREALTORS®withdataprovidedbyFlorida'smultiplelistingservices.StatisticsforeachmonthcompiledfromMLSfeedsonthe15thdayofthefollowingmonth. DatareleasedonThursday,August18,2022.NextdatareleaseisWednesday,September21,2022. Months Supply of Inventory 2.2 1.2 83.3% 37,958 46,511 -18.4% 100.0% 100.0% 0.0% 12 Days 9 Days 33.3% $562,611 $502,541 12.0% $13.3 Billion $15.4 Billion -13.7% 7,431 9,233 -19.5% $412,303 $355,000 16.1% July 2022 July 2021 Percent Year-over-YearChange 23,705 30,740 -22.9% 5261,453Days 5136,687Days 67.5%2.0%23,585 29,191 -19.2% 35,989 34,835 3.3% 0 20,000 40,000 60,000 80,000 100,000 120,000 Inventory J F M A M J J A S O N D J F M A M J J A S O N D J F M A M J J A S O N D J F M A M J J A S O N D J F M A M J J 2018 2019 2020 2021 2022 $0K $100K $200K $300K $400K $500K PriceSaleMedian 0 5,000 10,000 15,000 20,000 25,000 30,000 35,000 40,000 SalesClosed Monthly Market Summary - July 2022 J F M A M J J A S O N D J F M A M J J A S O N D J F M A M J J A S O N D J F M A M J J A S O N D J F M A M J J SingleFloridaFamily Homes 2018 2019 2020 2021 2022 J F M A M J J A S O N D J F M A M J J A S O N D J F M A M J J A S O N D J F M A M J J A S O N D J F M A M J J


Closed MedianClosedMedianClosedMedianSalesSalePriceSalesSalePriceSalesSalePrice ProducedbyFloridaREALTORS®withdataprovidedbyFlorida'smultiplelistingservices.StatisticsforeachmonthcompiledfromMLSfeedsonthe15thdayofthefollowingmonth. DatareleasedonThursday,August18,2022.NextdatareleaseisWednesday,September21,2022. Short Sale 25 84 -70.2% $271,000 $248,000 9.3% Foreclosure/REO 111 155 -28.4% $327,501 $241,000 35.9% July 2022 July 2021 Percent Year-over-YearChange Traditional 23,569 30,501 -22.7% $414,250 $355,000 16.7% $0K $50K $100K $150K $200K $250K $300K $350K $400K $450K PriceSaleMedian 0% 10% 20% 30% 40% 50% 60% 70% 80% 90% 100% SalesClosed Traditional Foreclosure/REO Short Sale J F M A M J J A S O N D J F M A M J J A S O N D J F M A M J J A S O N D J F M A M J J A S O N D J F M A M J J J F M A M J J A S O N D J F M A M J J A S O N D J F M A M J J A S O N D J F M A M J J A S O N D J F M A M J J Monthly Distressed Market - July 2022 SingleFloridaFamily Homes 2018 2019 2020 2021 2022 2018 2019 2020 2021 2022
interest rate or a ...... =- ear ixe..-,t e same mont~ a ear ear ier.

T.,.....e statewi~e me~ ian sa es omes in u was ;412,....., _....,, u = 1 =.1 % ram t.,.....e : revious ear. Last mont ~'s statewi _ e me:ian was ....,. ....... _s, , u: 2_.~% over t.,.....e so or more, a or ess. n t ....... e su - = si:•e o t ....... e mar et, t e tren:: o easinto a 2.2-mont.,.....s' su _ - w ....... i e ~ro: erties are at a 2.1-mont ....... s' SU •

~reat ::osition, wit.,..... t ~e :u o t estate's mi ennia s movinome ..,..._,.urc.,.....ases, not to mention u ers, w et er t e ~e investors, retirees or untet.,.....ere war ers." ~,' ___ on nor sai:. ''Rents aroun~ t estate .,.....ave increase~ su ~stantia , as we , so it's not more attractive re ative to mar et, an~ we s ou _ ex"'""'ect re ect t at as a resu t overt e next severa mont.,.....s."

.......... own com ~are_ tot e same ie Economist Dr. Bra...,,. '""""' ~on nor""""" ointe: out: ''It's s ou """ a so ac now e _=~et at t is u , we saw ewer ..-...ome sa es t..-...an we :i _ in u o 2_1 ~, ~e ore t..-...e ~an :em ic. T..-... is ea r's wit ........ a continuation o ast ear's num""" er o com~ ete""" transactions t is summer."

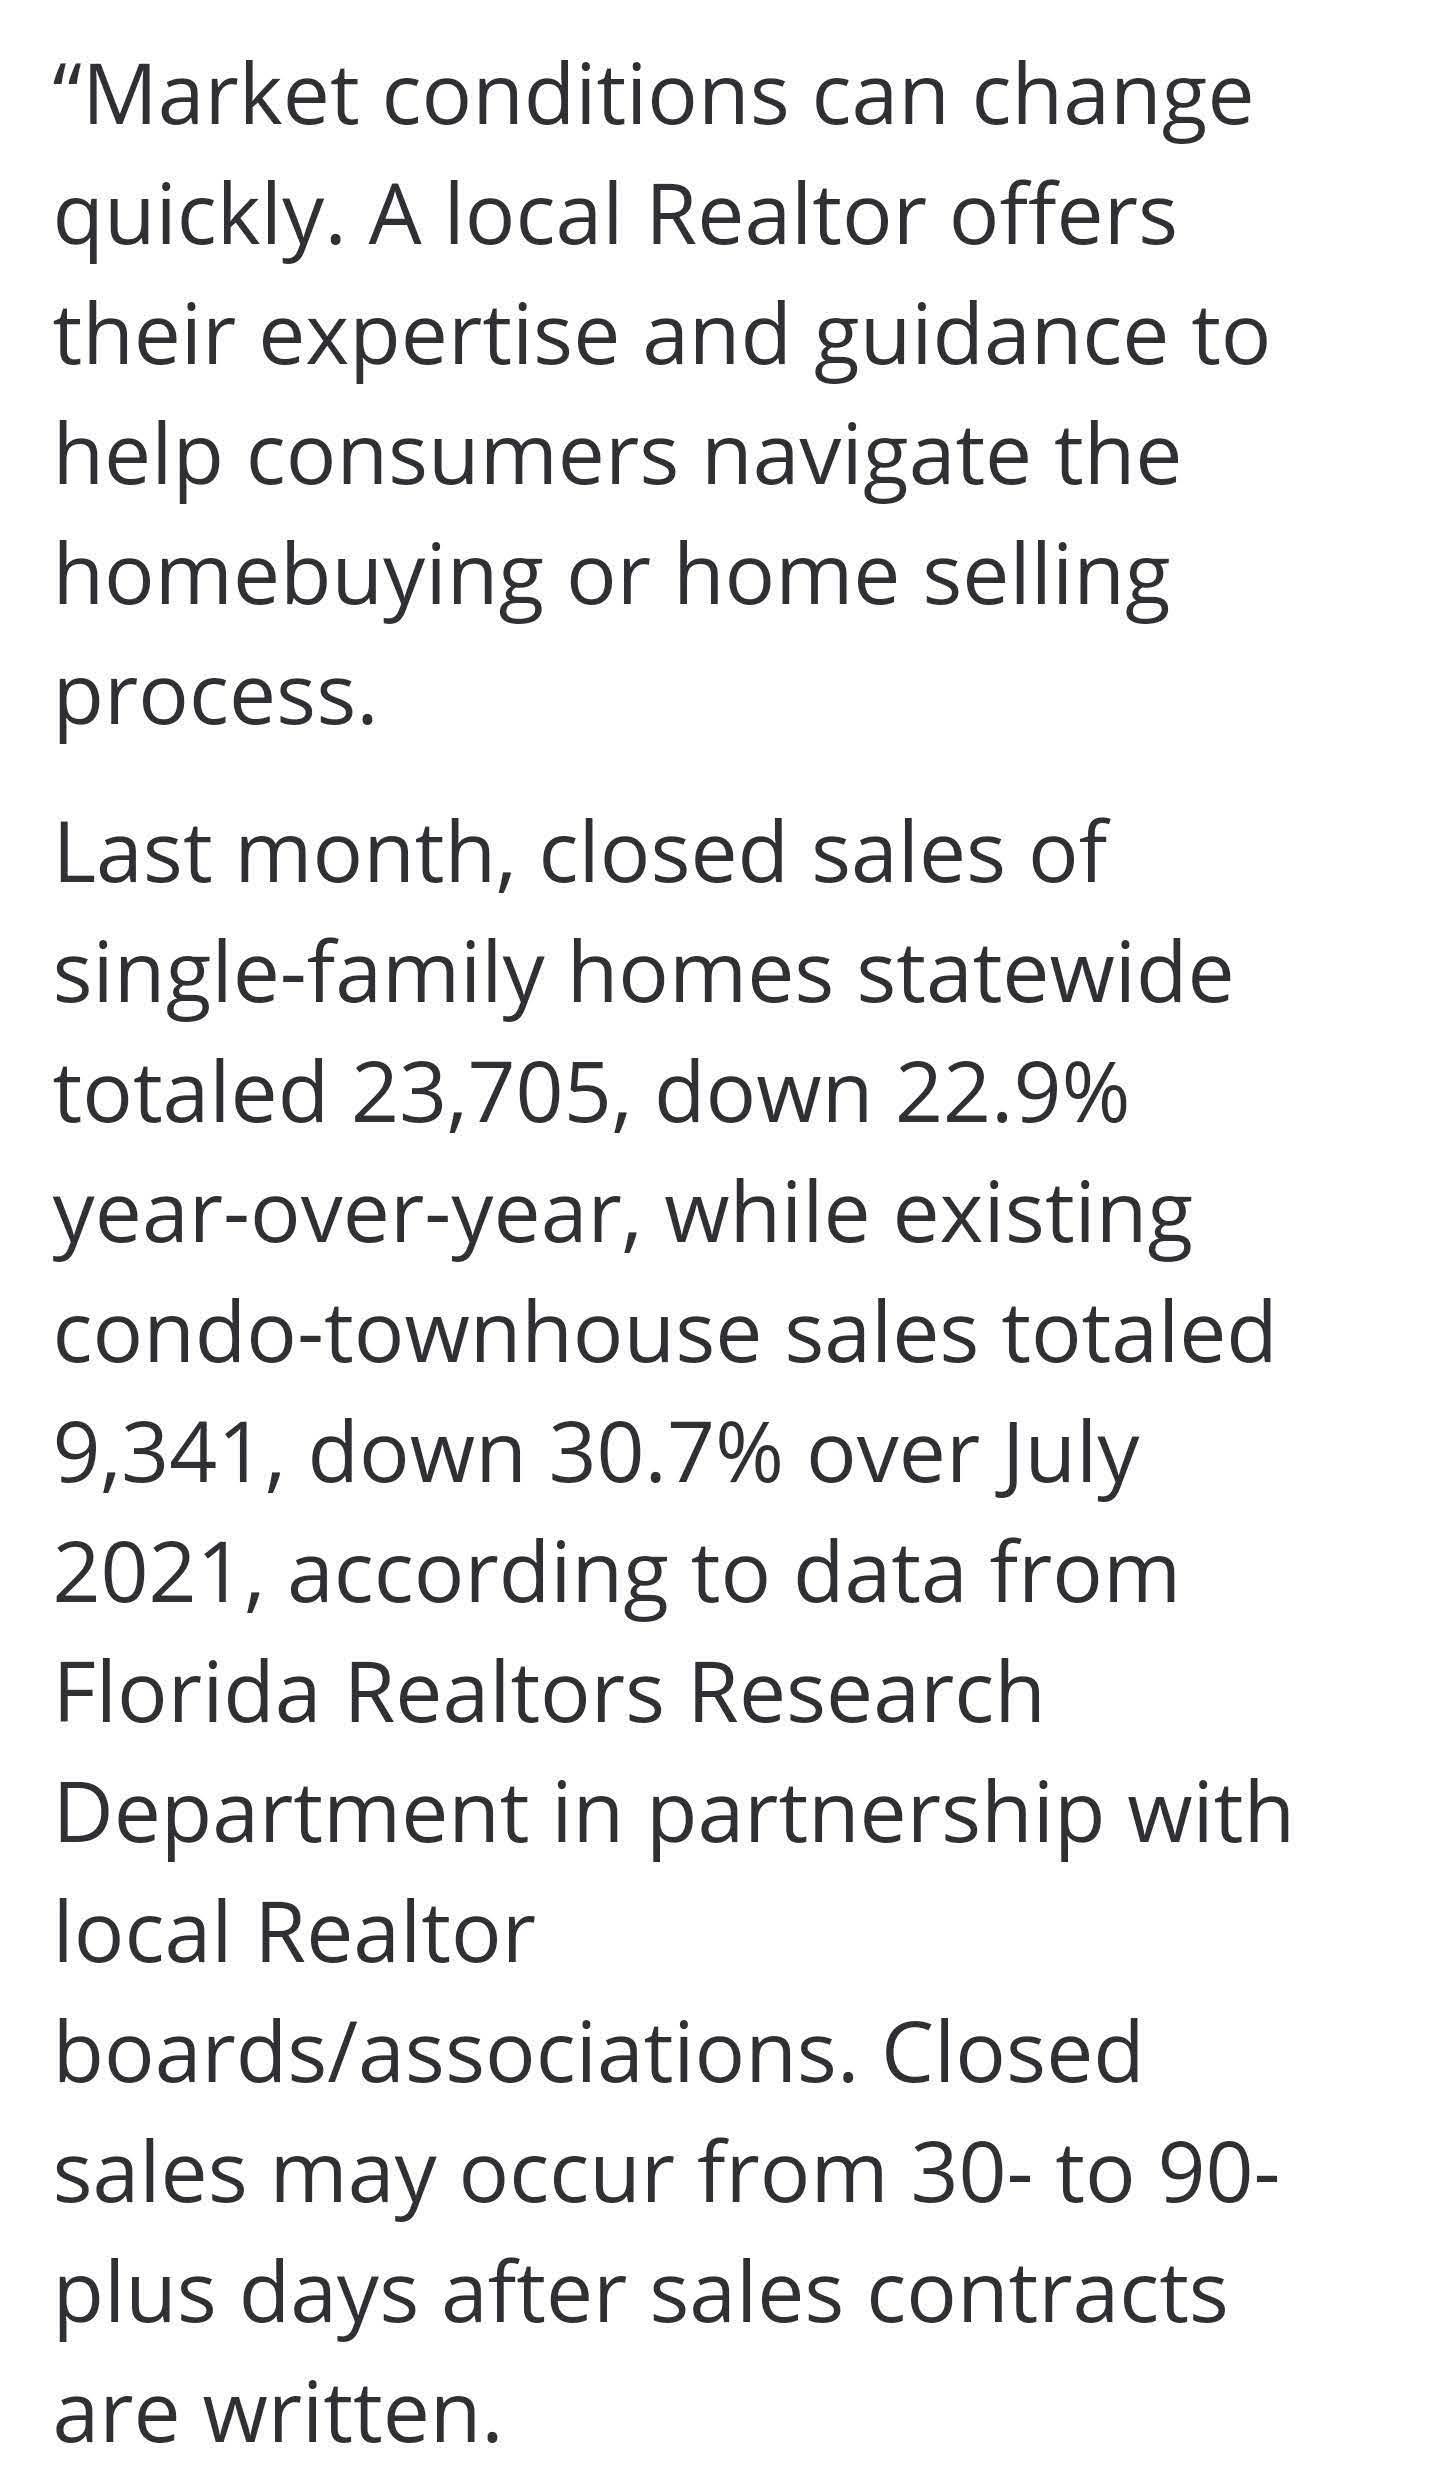
......... uic . A oca Rea tor o .......... ers e = consumers navi;:-ate t ....... e . ,... ....... .omertt..l'u 1n=- or ome se in;,-,,.. ~rocess. Last mont , c ose: sa es o tota e:: 2....,, 7 5, _ own 22.~% ear-over- ear, w ....... i e existin~ F ori~a Rea tors Researc De-:artment in _ artners ....... i _ wit oca Rea tor ~oar_ s/associations. ___ ose __... sa es ma occur ram ....,_- to ""' us ......... a s a ter sa es contracts are written. -
''T e tren: o im - ravine,... or-sa e inventor continue_ in u , . .,.,.. .W.,.,.. IC O e U WI a so e~LI ers," sai: 2_22 F ori:a Rea tors Presi:ent ___ .,.,..ristina Pa.,.....U"'llr,..,ii as, vice resi .......... ent o t ~e Ke es Fami o ___ om anies in Miami. ''However, omes are '"""uic : T.,.,..e me ........ ian time to 12 = a s com.,.....are: to nine _ a s com - are""" to 15 in u 2_21.

a.'s u ar e : • , I • ous1n • ous1n • • e 1an rices • u as1n , a. - ori a's ar e re or e • • 1• er e 1an rices, a • • • rise• 1n ne 1s 1n so • • • ex1s• 1n sin e- a 1 • • o es an con 1nue s1 ns • o eas1n su • • cons rain s 1n u are o a ear a o, • • accor 1n o or1 a ea ors R' a es • ous1n • • a a. o ever, 1n a 10n • an I er or a e • •1n eres ra es con 1nue o • I ac sa es.
