
CountyReal Estate Report
st Quarter 2024 Janetleap@boulderco.com | 720.938.4197 | www.janetleap.com
Boulder
1
* 30-Year Fixed Rate Mortgage Average in the United States cMoRTGAGE3ousi


Datain this graph are copyrighted. Pleasereview the copyrightinformation in the series notes before sharing.
11:01
Units: Percent, NotSeasonally Adjusted FRED d - 30-Year Fixed Rate MortgageAverageinthe United States 20.0 17.5 15.0 12.5 10.0 a. 7.5 5.0 2.5 1975 1980 1985
Frequency Weekly Ending Thursday 1990 1995 Source: Freddie Mac
Observation: 2024-03-28: 6.79 (+ more) Updated: Mar 28, 2024
AM CDT
Shaded areas indicate U.S. recessions
2000 lYI SYI l0YI Max 1971-04-02 2005 to 2024-03-28 2010 ·+IMiHi-9 ·HE@iii·i 2015 2020 fred.stlouisfedorg

3.Boulder, CO
Home to the University of Colorado’s flagship campus, Boulder ranks third-best for housing market growth and stability. Between 1998 and 2022, home prices rose 256.48%, 33rd-most out of the 400 metro areas. While Boulder hasn’t experienced quite the same population spike as the top two cities for housing and growth, it hosts offices of Google and IBM and has a reputation as a startup city.

Local Housing Statistics By Area

Single-Family


County
Boulder County Year 2024 % Change Year 2023 2 yr. Change Year 2022 Total Active Listings 514 16.6% 441 67.4% 307 Median Sales Price $910,000 1.1% $900,000 4.3% $872,750 Average Sales Price $1,142,126 -6.4% $1,219,687 -1.5% $1,159,510 SP/LP Ratio 97.8% -0.2% 98.0% -5.9% 103.9% Average Market Time 69 -4.2% 72 76.9% 39 Number of Sales YTD 430 22.5% 351 -7.7% 466 Expired Listings 159 29.3% 123 169.5% 59 Months of Inventory 3.6 -5.3% 3.8 89.5% 1.9 % Under Contract 37% -7.5% 40% -48.6% 72% 30 Year Mortgage 6.79% 7.4% 6.32% 62.8% 4.17% From IRES MLS 4/3/2024
Boulder
Single Family Q1

City
Year 2024 % Change Year 2023 2 yr. Change Year 2022 Total Active Listings 168 3.1% 163 147.1% 68 Median Sales Price $1,425,000 2.3% $1,392,500 -2.3% $1,458,355 Average Sales Price $1,774,303 -0.8% $1,788,831 3.1% $1,720,931 SP/LP Ratio 97.2% -1.5% 98.7% -6.5% 104.0% Average Market Time 77 32.8% 58 67.4% 46 Number of Sales YTD 107 9.2% 98 -7.8% 116 Expired Listings 54 92.9% 28 285.7% 14 Months of Inventory 4.7 -6.0% 5 161.1% 1.8 % Under Contract 26% -21.2% 33% -58.7% 63% 30 Year Mortgage 6.79% 7.4% 6.32% 62.8% 4.17% From IRES MLS 4/3/2024
Boulder County Single Family Q1
of Boulder

Year 2024 % Change Year 2023 2 yr. Change Year 2022 Total Active Listings 32 68.4% 19 166.7% 12 Median Sales Price $957,500 5.2% $910,000 -4.3% $1,000,000 Average Sales Price $1,077,766 2.5% $1,051,012 -1.8% $1,097,331 SP/LP Ratio 98.1% 0.9% 97.2% -9.3% 108.1% Average Market Time 58 -14.7% 68 132.0% 25 Number of Sales YTD 24 26.3% 19 -14.3% 28 Expired Listings 9 125.0% 4 350.0% 2 Months of Inventory 4 33.3% 3 207.7% 1.3 % Under Contract 38% -34.5% 58% -54.2% 83% 30 Year Mortgage 6.79% 7.4% 6.32% 62.8% 4.17% From IRES MLS 4/3/2024
Boulder County Single Family Q1 City of Louisville

Year 2024 % Change Year 2023 2 yr. Change Year 2022 Total Active Listings 45 55.2% 29 95.7% 23 Median Sales Price $917,500 4.0% $882,500 17.3% $782,500 Average Sales Price $969,886 3.9% $933,595 -3.0% $1,000,050 SP/LP Ratio 99.3% 0.5% 98.8% -8.7% 108.8% Average Market Time 60 -13.0% 69 53.8% 39 Number of Sales YTD 38 90.0% 20 26.7% 30 Expired Listings 13 8.3% 12 550.0% 2 Months of Inventory 3.6 -18.2% 4.4 56.5% 2.3 % Under Contract 47% 23.7% 38% -39.7% 78% 30 Year Mortgage 6.79% 7.4% 6.32% 62.8% 4.17% From IRES MLS 4/3/2024
Boulder County Single Family Q1 City of Lafayette

Year 2024 % Change Year 2023 2 yr. Change Year 2022 Total Active Listings 126 14.5% 110 53.7% 82 Median Sales Price $577,000 -5.1% $608,000 -4.3% $603,000 Average Sales Price $636,973 -5.0% $670,836 -4.0% $663,265 SP/LP Ratio 99.8% 0.5% 99.3% -6.4% 106.6% Average Market Time 60 -3.2% 62 122.2% 27 Number of Sales YTD 128 16.4% 110 -16.9% 154 Expired Listings 26 -25.7% 35 188.9% 9 Months of Inventory 3 0.0% 3 87.5% 1.6 % Under Contract 48% -12.7% 55% -44.8% 87% 30 Year Mortgage 6.79% 7.4% 6.32% 62.8% 4.17% From IRES MLS 4/3/2024
Boulder County Single Family Q1 City of Longmont

Suburban Plains Year 2024 % Change Year 2023 2 yr. Change Year 2022 Total Active Listings 80 -4.8% 84 48.1% 54 Median Sales Price $980,000 -5.2% $1,033,500 4.2% $940,500 Average Sales Price $1,126,233 -23.2% $1,467,204 -14.7% $1,320,998 SP/LP Ratio 96.9% 0.3% 96.7% -3.1% 100.0% Average Market Time 76 7.0% 71 52.0% 50 Number of Sales YTD 88 51.7% 58 -2.2% 90 Expired Listings 29 20.8% 24 190.0% 10 Months of Inventory 2.7 -37.2% 4.3 50.0% 1.8 % Under Contract 45% 28.6% 35% -32.8% 67% 30 Year Mortgage 6.79% 7.4% 6.32% 62.8% 4.17% From IRES MLS 4/3/2024
Boulder County Single Family Q1

Suburban
Year 2024 % Change Year 2023 2 yr. Change Year 2022 Total Active Listings 48 41.2% 34 77.8% 27 Median Sales Price $769,000 -23.5% $1,005,000 -32.3% $1,136,000 Average Sales Price $1,066,494 -19.0% $1,316,109 -22.9% $1,383,881 SP/LP Ratio 97.2% 1.0% 96.3% -3.1% 100.3% Average Market Time 84 -46.5% 157 44.8% 58 Number of Sales YTD 33 0.0% 33 6.5% 31 Expired Listings 25 108.3% 12 38.9% 18 Months of Inventory 4.4 41.9% 3.1 69.2% 2.6 % Under Contract 23% -20.7% 29% -52.1% 48% 30 Year Mortgage 6.79% 7.4% 6.32% 62.8% 4.17% From IRES MLS 4/3/2024
Boulder County Single Family Q1
Mountains

Year 2024 % Change Year 2023 2 yr. Change Year 2022 Total Active Listings 22 100.0% 11 144.4% 9 Median Sales Price $920,000 -0.1% $920,500 2.5% $897,500 Average Sales Price $995,062 7.5% $926,013 0.6% $988,656 SP/LP Ratio 99.0% 0.6% 98.4% -10.5% 110.6% Average Market Time 64 12.3% 57 178.3% 23 Number of Sales YTD 22 83.3% 12 37.5% 16 Expired Listings 6 20.0% 5 200.0% 2 Months of Inventory 3 9.1% 2.75 76.5% 1.7 % Under Contract 45% 25.0% 36% -42.3% 78% 30 Year Mortgage 6.79% 7.4% 6.32% 62.8% 4.17% From IRES MLS 4/3/2024
Boulder County Single Family Q1 Town of Superior

Broomfield Year 2024 % Change Year 2023 Total Active Listings 149 15.5% 129 Median Sales Price $640,500 -9.2% $705,500 Average Sales Price $723,462 -6.2% $771,151 SP/LP Ratio 99.1% 0.1% 99.1% Average Market Time 61 24.5% 49 Number of Sales YTD 152 -5.0% 160 Expired Listings 24 -33.3% 36 Months of Inventory 2.9 20.8% 2.4 % Under Contract 53% -8.6% 58% 30 Year Mortgage 6.79% 7.4% 6.32% From IRES and RECO MLS 4/3/2024
Boulder County Single Family Q1 City of
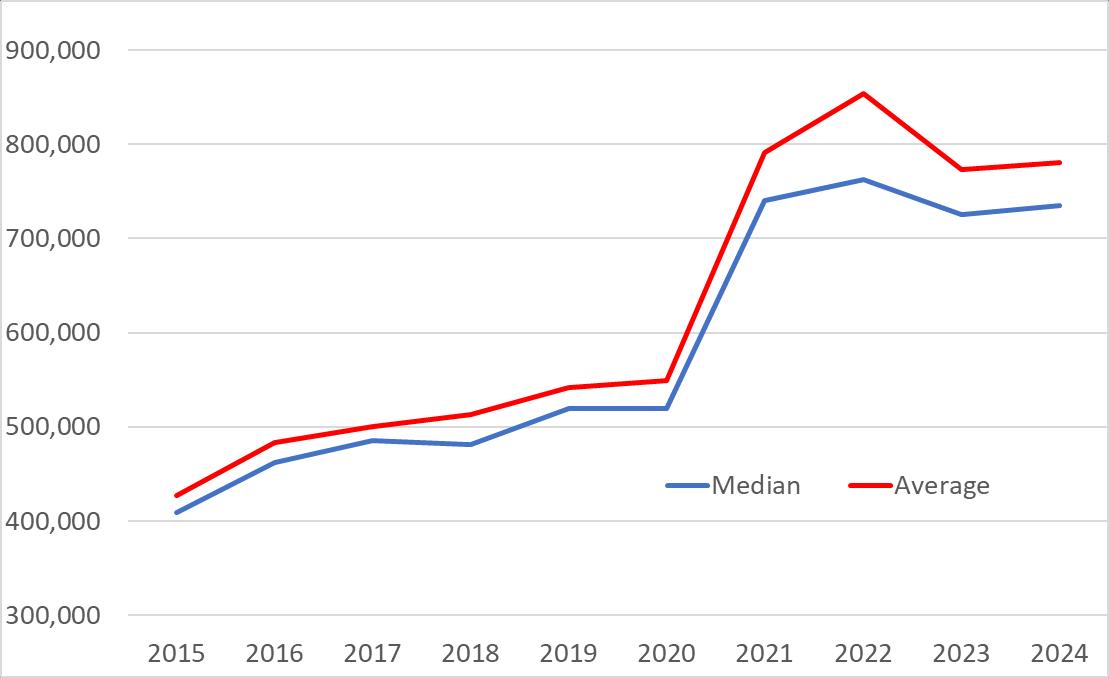
Year 2024 % Change Year 2023 Total Active Listings 171 -5.5% 181 Median Sales Price $735,000 1.3% $725,450 Average Sales Price $780,505 1.0% $772,957 SP/LP Ratio 98.4% 0.0% 98.4% Average Market Time 58 0.0% 58 Number of Sales YTD 187 87.0% 100 Expired Listings 21 -4.5% 22 Months of Inventory 2.7 -50.0% 5.4 % Under Contract 46% -14.8% 54% 30 Year Mortgage 6.79% 7.4% 6.32% From IRES and RECO MLS 4/3/2024
Boulder County Single Family Q1 Town of Erie

Single-Family Recap
of Single-Family Homes Sold - 1st Qtr 2024 2020 2021 2022 2023 2024 Boulder 141 136 116 98 107 Louisville 34 30 28 19 24 Lafayette 54 52 30 20 38 Longmont 247 190 154 110 128 Sub. Plains 120 87 90 58 88 Sub. Mtns 33 55 31 33 33 Superior 26 13 16 12 22 Bldr County 661 567 466 351 430 Broomfield 160 152 Erie 100 187
Number
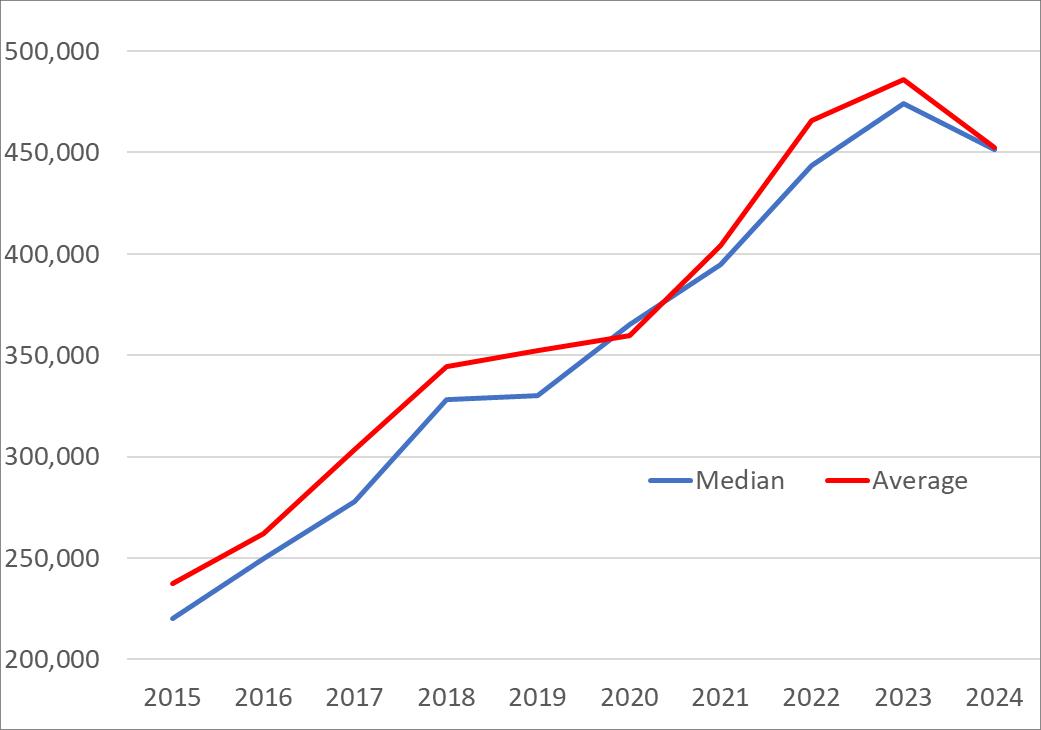
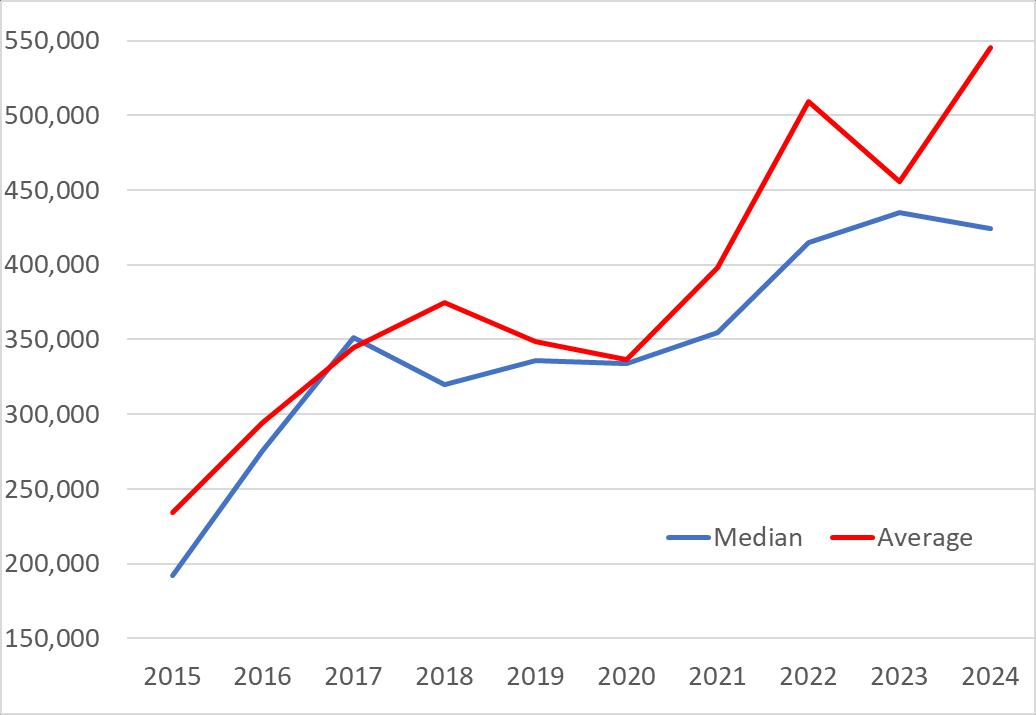
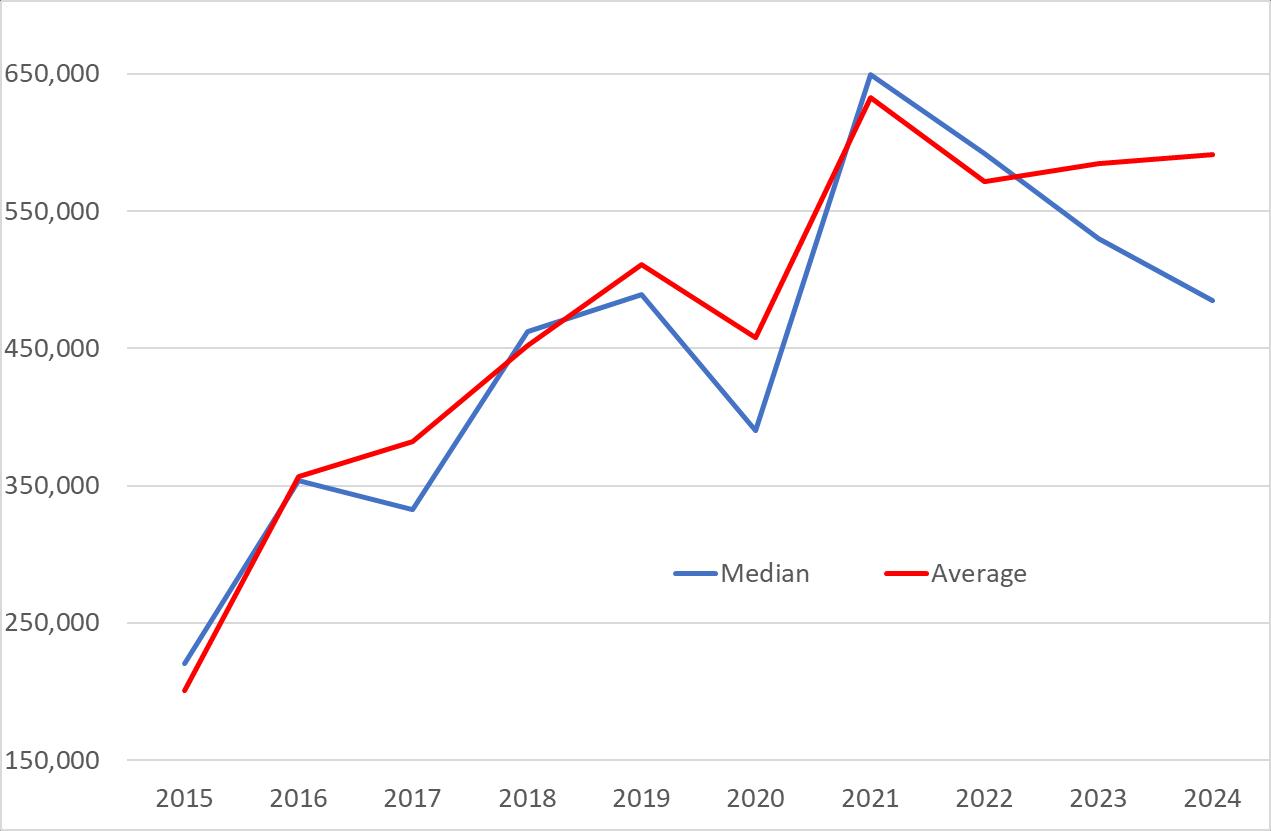
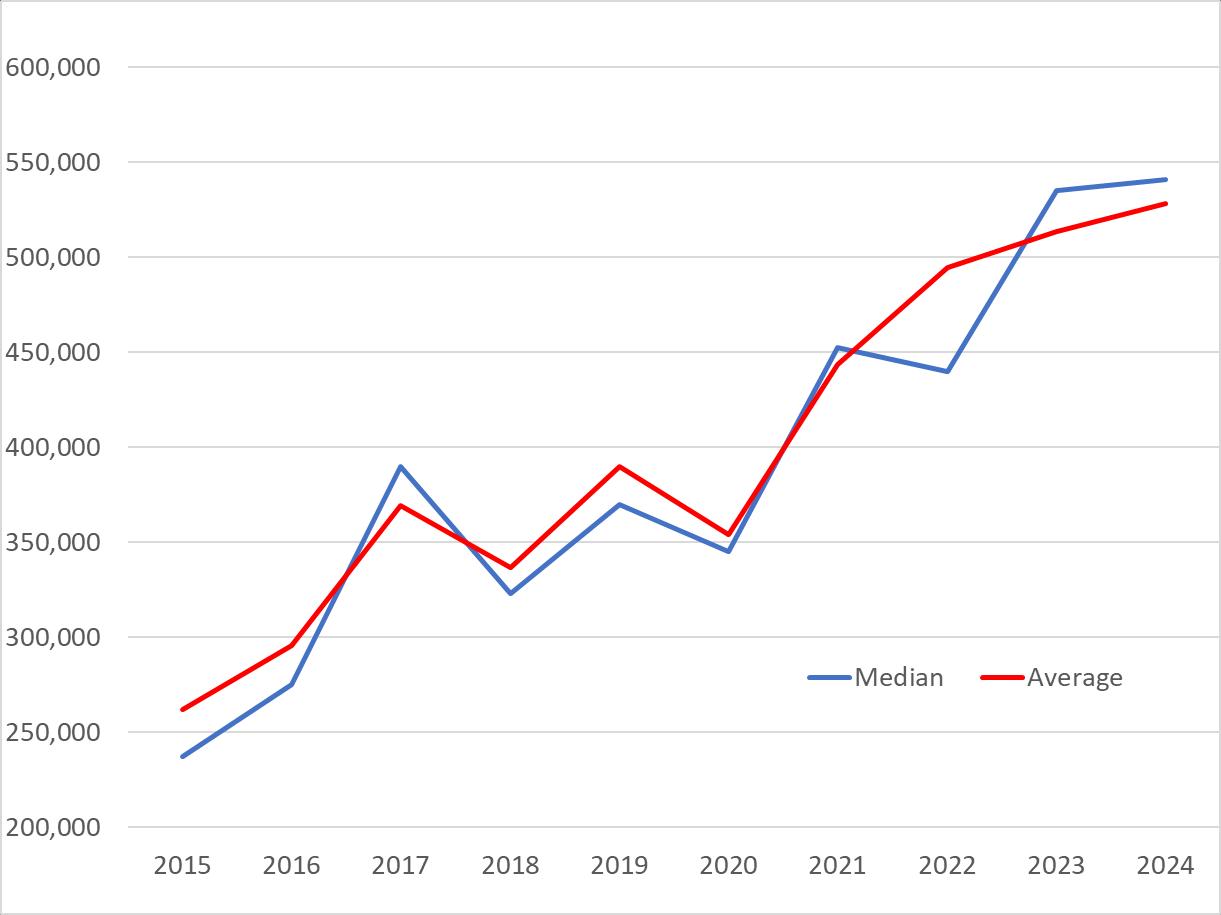
Single Family Median Price by Area - Qtr 1 2024
2020 2021 2022 2023 2024 Boulder $1,000,000 $1,362,500 $1,458,355 $1,392,500 $1,425,000 Louisville 669,500 821,250 1,000,000 910,000 957,500 Lafayette 546,000 675,750 782,500 882,500 917,500 Longmont 455,000 497,500 603,000 608,000 577,000 Sub. Plains 666,000 925,000 940,500 1,033,500 980,000 Sub. Mtns 650,000 870,000 1,136,000 1,005,000 769,000 Superior 632,000 838,000 897,500 920,500 920,000 Bldr County 609,000 760,000 872,750 900,000 910,000 Broomfield 570,000 635,000 690,050 705,500 640,500 Erie 520,000 740,000 762,500 725,450 735,000
Single Family Average Sales Price - 1st Qtr 2024
2020 2021 2022 2023 2024 Boulder $1,236,000 $1,534,485 $1,720,931 $1,788,831 $1,774,303 Louisville 764,875 902,675 1,097,331 1,051,012 1,077,766 Lafayette 582,870 703,371 1,000,050 933,595 969,886 Longmont 489,516 531,234 663,265 670,836 636,973 Plains 892,005 1,331,109 1,320,998 1,467,204 1,126,233 Mountains 866,530 1,052,812 1,383,881 1,316,109 1,066,494 Superior 659,675 861,736 988,656 926,013 995,062 Boulder Cnty 770,114 989,990 1,159,510 1,219,687 1,142,126 Broomfield 621,470 707,439 759,671 771,151 723,462 Erie 548,680 791,170 853,992 772,957 780,505
Percent of Single-Family Homes U/C - 1st Qtr 2024 2020 2021 2022 2023 2024 Boulder 36% 58% 63% 33% 26% Louisville 50% 71% 83% 58% 38% Lafayette 63% 80% 78% 38% 47% Longmont 66% 84% 87% 55% 48% Plains 50% 74% 67% 35% 45% Mountains 26% 57% 48% 29% 23% Superior 61% 91% 78% 36% 45% Boulder County 51% 71% 72% 40% 37%


Rolling Years – April 1 through March 31
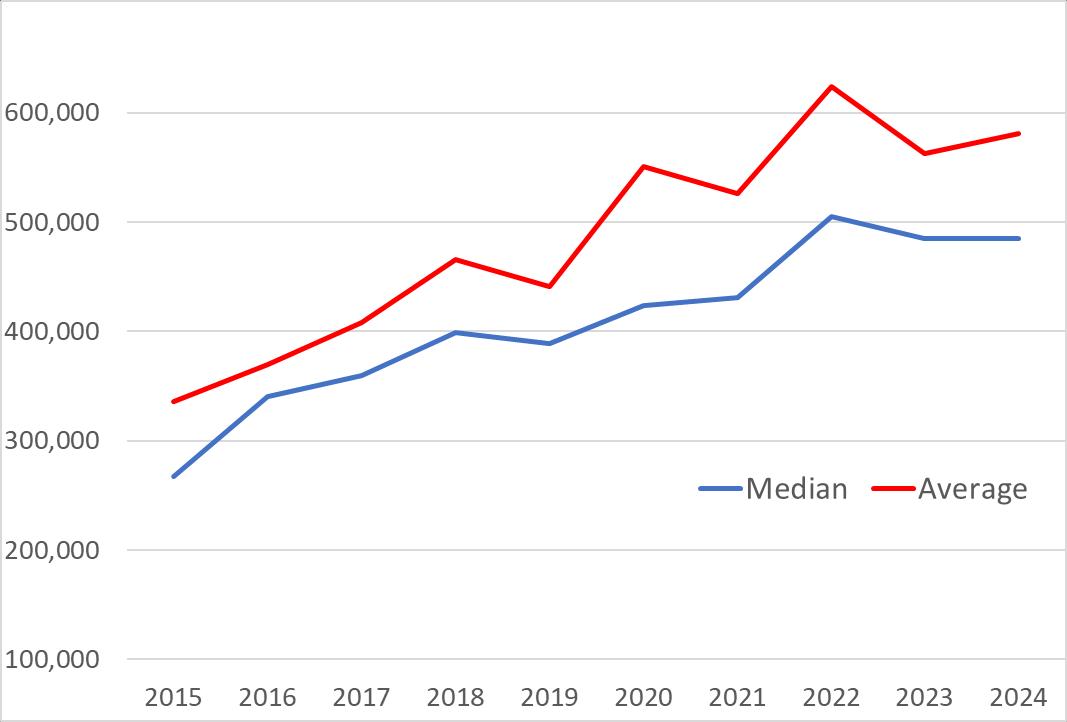
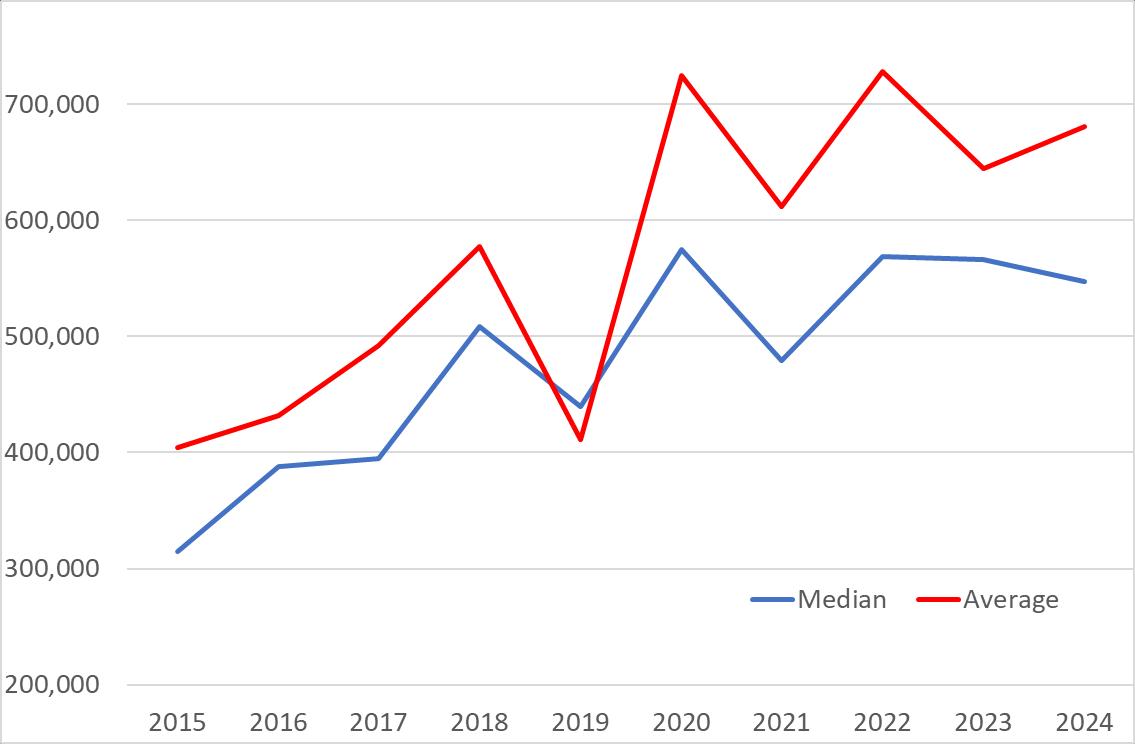
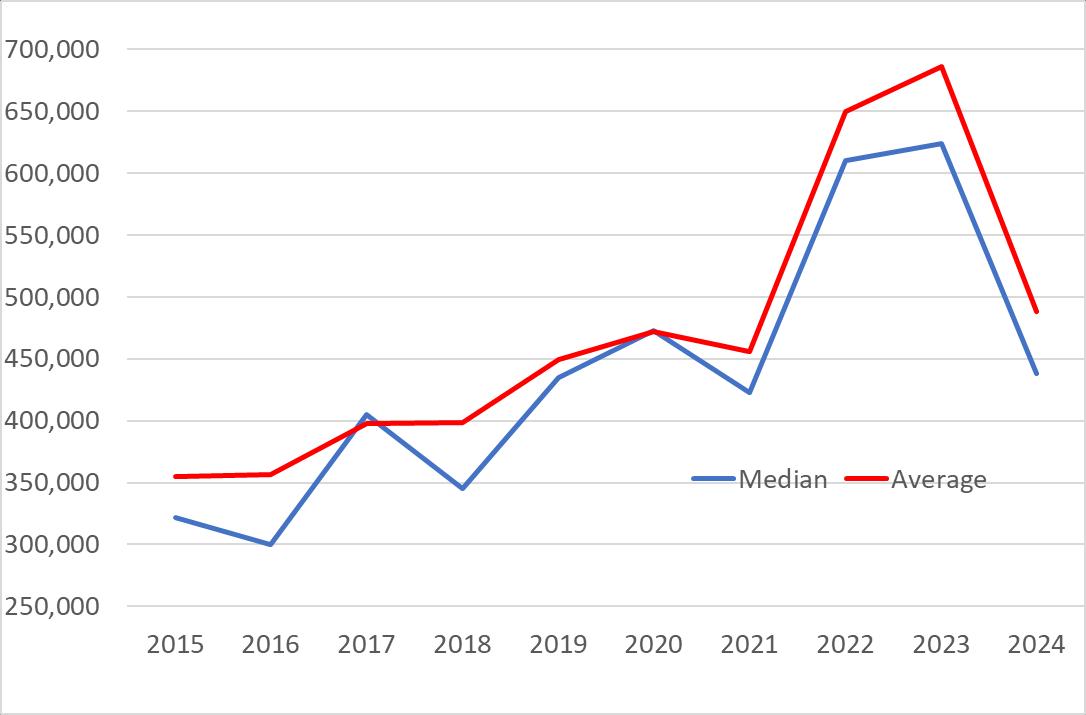
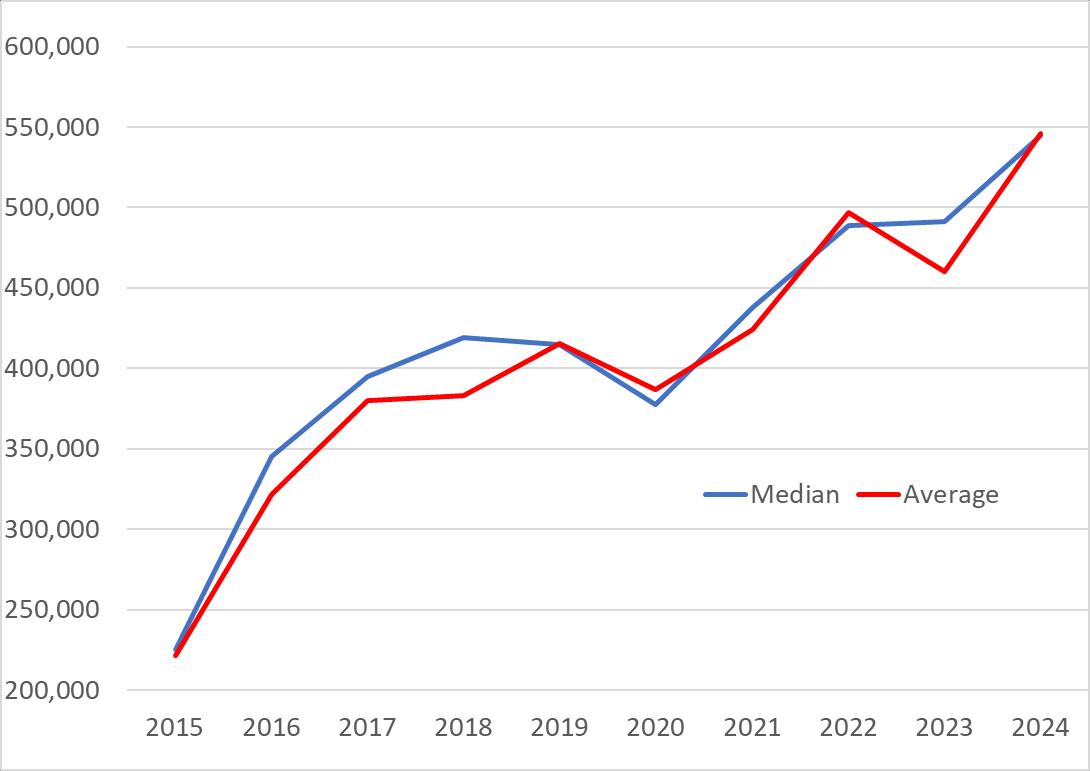
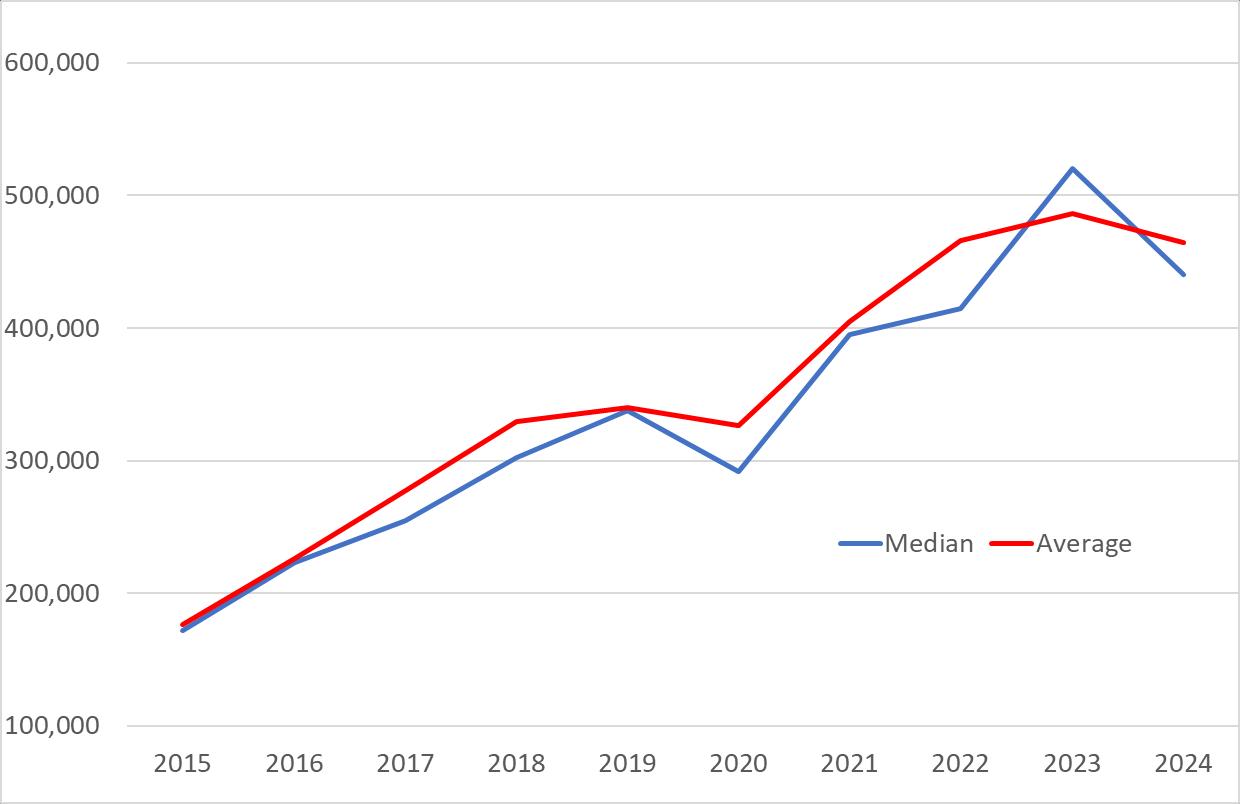
2014 2015 2016 2017 2018 2019 2020 2021 2022 2023 2024 # of Sales Boulder 793 724 693 624 705 593 700 706 731 519 514 Louisville 233 189 193 195 223 207 224 208 175 139 128 Lafayette 310 309 290 239 286 272 306 317 231 184 144 Longmont 1105 1141 1204 1085 1194 1119 1233 1214 1017 697 646 Suburban Plains 579 590 636 623 653 637 610 628 560 399 366 Mountain 238 269 321 266 266 265 254 319 455 315 210 Superior 139 124 129 135 101 99 143 114 88 77 80 Boulder County 3399 3353 3469 3172 3441 3208 3502 3540 3150 2261 2099 Broomfield 803 659 Ires and RECO Erie 612 696 Ires and RECO Median Price Boulder 637 706 819 887 920 985 976 1075 1350 1450 1425 Louisville 459 507 528 610 642 655 654 740 870 935 902 Lafayette 376 415 445 495 539 585 588 610 770 940 865 Longmont 262 280 318 363 400 430 440 470 560 612 605 Suburban Plains 473 505 556 620 640 681 669 779 923 972 995 Mountain 425 445 480 525 600 610 652 691 840 849 870 Superior 450 466 553 595 610 635 675 713 978 973 920 Boulder County 415 434 478 536 562 595 609 662 835 884 870 Broomfield 687 675 Ires and RECO Erie 751 739 IRES and RECO Average Price Boulder 771 854 971 1076 1134 1237.4 1232 1352 1650 1757 1778 Louisville 511 534 572 642 687 744 725 791 978 1061 1029 Lafayette 411 443 496 554 586 619 629 676 854 993 923 Longmont 288 310 350 396 427 465 465 515 615 663 660 Suburban Plains 596 624 655 748 806 847 846 990 1254 1310 1259 Mountain 526 514 578 684 653 791 816 863 1039 1090 1221 Superior 487 503 598 614 630 675 708 747 1039 982 971 Boulder County 505 531 585 660 698 748 756 837 1074 1149 1149 Broomfield 760 777 IRES and RECO Erie 821 802 IRES and RECO
Single Family
Single-Family Rolling Years April 1 Through March 31
Average Sales Price Median Sales Price 2022 2023 2024 % Diff. High 2022 2023 2024 % Diff. High Boulder 1650 1757 1778 1.2% 2024 1350 1450 1425 -1.7% 2023 Louisville 978 1061 1029 -3.0% 2023 870 935 902 -3.5% 2023 Lafayette 854 993 923 -7.0% 2023 770 940 865 -8.0% 2023 Longmont 615 663 660 -0.5% 2023 560 612 605 -1.1% 2023 Plains 1254 1310 1259 -3.9% 2023 923 972 995 2.4% 2024 Mountains 1039 1090 1221 12.0% 2024 840 849 870 2.5% 2024 Superior 1039 982 971 -1.1% 2022 978 973 920 -5.4% 2022 Boulder County 1074 1149 1149 0.0% 2024 835 884 870 -1.6% 2023 Broomfield 732 760 777 2.2% 2024 670 687 675 -1.7% 2023 Erie 749 821 802 -2.3% 2023 695 751 739 -1.6% 2023
This representation is based in whole or in part on data supplied by IRES MLS for the time period above Prepared by RE/MAX of Boulder, Inc. For Boulder County on April 4, 2024 PRICE RANGE # SOLD # ON MARKET MONTHS OF INVENTORY # Listed 1st Qtr 2024 $0 - $99,999 1 0 0 0 $100,000 - 149,999 0 0 0 0 $150,000 - 199,999 0 0 0 0 $200,000 - 249,999 0 0 0 0 $250,000 - 299,999 1 0 0 4 $300,000 - 349,999 2 0 0 6 $350,000 - 399,999 1 4 12 12 $400,000 - 449,999 13 0 0 12 $450,000 - 499,999 21 4 1 16 $500,000 - 549,999 22 5 1 13 $550,000 - 599,999 20 11 2 20 $600,000 - 649,999 27 5 1 6 $650,000 - 699,999 27 18 2 9 $700,000 - 749,999 20 10 2 4 $750,000 - 799,999 19 8 1 6 $800,000 - 849,999 21 2 0 3 $850,000 - 899,999 16 10 2 4 $900,000 - 949,999 23 8 1 7 $950,000 - 999,999 17 8 1 2 $1,000,000 - 1,099,999 24 7 1 0 $1,100,000 - 1,199,999 21 16 2 7 $1,200,000 - 1,299,999 29 15 2 3 $1,300,000 - 1,399,999 12 9 2 2 $1,400,000 - 1,499,999 15 11 2 0 $1,500,000 - 1,599,999 9 11 4 0 $1,600,000 - 1,699,999 12 12 3 2 $1,700,000 - 1,799,999 12 8 2 1 $1,800,000 - 1,899,999 5 8 5 0 $1,900,000 - 1,999,999 0 5 --- 3 $2,000,000 - 40 134 10 5 TOTALS: 430 329 2.30 147


