
Consumer Healthcare SUBSECTORS TO WATCH 2022

For healthcare, consumer, and retail investors, crossing sector lines has long been appealing. As today’s more sophisticated consumers continue to demand better service, a more modern experience, and trusted brand names, leading providers will combine expertise in healthcare, retail, and technology to win share.
Here, senior bankers from the Harris Williams Consumer Group, Healthcare & Life Sciences Group, and Technology Group share insights and data on key subsectors within this promising space.
Table of Contents
DERMATOLOGY ..................................................................... 2 - 7
VISION .................................................................................... 8 - 11
FERTILITY .......................................................................... 12 - 15
OB/GYN .............................................................................. 16 - 19
DENTAL ........................................................................................ 20 - 23
VISION, DENTAL, AND VETERINARY CARE .................................. 24 - 27
PHYSICAL THERAPY ............................................................. 28 - 31
MEDICAL SPA .................................................................................. 32 - 35
GASTROENTEROLOGY ................................................................. 36 - 39
UROLOGY .................................................................................... 40 - 43
1
Dermatology
Dermatology is a ~$20 billion sector comprising core medical and surgical services and a rapidly growing aesthetic market opportunity.
Core Dermatology Sector Today
The core medical dermatology sector is expected to grow at a steady ~4% CAGR through 2023P, driven by strong long-term market fundamentals
Dermatopathology $0.8B
› Emerging aesthetic dermatology opportunity allows platforms to inflect same clinic and de novo organic growth by tapping into a broader addressable market
Core Medical and Surgical Dermatology $6.2B
› Dermatopathologists provide critical pathology support for dermatologists
› Core medical and surgical dermatology represents the entry point into the dermatology ecosystem and generates downstream referrals for other ancillary dermatology services
› In-house, centralized labs are a key differentiator and create the ability to provide integrated care and realize meaningful revenue synergies from acquired practices
SECTOR SPOTLIGHT
2
Aesthetic Procedures
$0.7B
Nascent Aesthetic Dermatology Opportunity $12B+ ~18% CAGR THROUGH 2023P
Total Dermatology Industry Opportunity
~20B
› The broader ~$20 billion dermatology ecosystem is expected to grow at a ~13% CAGR through 2023P, driven by the rapidly growing aesthetic dermatology market opportunity
› Many providers perform aesthetic procedures in addition to general dermatology services
› Rapidly emerging opportunity for medical/ surgical-focused platforms to expand their service offerings
› Aesthetic procedures continue to comprise a larger share of sector revenue as more dermatologists begin to offer aesthetics
› Rapidly emerging opportunity for medical/ surgical-focused platforms to expand their service offerings and maximize the revenue opportunity from their captive patient populations
IBISWorld and American Med Spa Association. 3
Dermatology
Organic Growth Levers
Immense organic growth opportunity, with many platforms just starting to develop the scale and capabilities needed to maximize their growth potential
De Novos
Service Expansion
Patient Engagement
› Drive volume growth and optimize provider utilization through digital marketing, online scheduling, and other initiatives
Provider Recruitment
› Accelerate recruitment of board-certified dermatologists
› Increase utilization of midlevel providers to create clinical leverage
Payor Contracting
› Implement payor contracting strategy and negotiate favorable rates by proving out the ability to improve quality of care and save costs
› Launch new clinic locations targeting underserved markets with limited access
› Increase Mohs and laboratory pathology
› Expand penetration of aesthetics and plastic surgery
SECTOR SPOTLIGHT
LEVEL OF INVESTMENT NEEDED TO SUPPORT A SCALED STRATEGY VALUE CREATION OPPORTUNITY AT SCALE
4
Given the attractiveness of the underlying structural dynamics in the dermatology sector, investors can drive value creation through diverse organic and M&A growth levers.
M&A Growth Levers
Synergies
Increased Density
› Acquire addons withinexisting markets to build additional density and enhance network effects
› Extract cost synergies by leveraging shared services
› Realize revenue synergies from payor rates, pathology, and internal referrals
Geographic Expansion
› Expand into directly adjacent markets
› Enter new markets to “land and expand”
›
Transformational Acquisitions
Rapidly expand geographic footprint and build density
› Leverage existing shared services infrastructure to extract significant synergies
CONTINUUM OF VALUE CREATION
5
Dermatology
Dermatology is a highly attractive physician practice management (PPM) sector with a long runway for investors to be successful. It has strong fundamentals common to most PPM sectors, and it has evolved significantly to offer even more opportunity in the future. This approximately $20 billion sector is expected to grow by around 13% per year over the next several years, with core medical-surgical dermatology services growing about 4% annually and cosmetic dermatology services growing about 18% annually.1
Here, Harris Williams professionals Corey Benjamin, a managing director in the Consumer Group, as well as Geoff Smith, managing director, and Charles Busch, vice president, in the Healthcare & Life Sciences Group, share their thoughts on why dermatology is appealing to buyers and investors, as well as key attributes of high-quality dermatology platforms.
Why are buyers and investors interested in the dermatology sector?

Smith: The dermatology sector has several attractive characteristics. Growing awareness around the importance of skin care is driving sustainable demand for medical-surgical dermatology, especially as the population continues to age over time. As a result, demand for medically necessary dermatology services is both recession and pandemic resistant. In addition, payor coverage for medical-surgical dermatology is expected to remain stable for the foreseeable future. There’s also a rapidly growing market for cosmetic dermatology, such as Botox, fillers, and laser treatments, providing a significant growth opportunity for medical- and surgical-focused platforms.
Benjamin: While the sector has traditionally been focused on medical-surgical procedures, like other consumer healthcare verticals, it’s evolving in response
FEATURED ARTICLE
6
to shifting patient and consumer preferences. For example, dermatology practices are responding to the notable uptick in consumer demand for cosmetic services over the last five years by expanding their service offerings, creating a larger addressable market opportunity.
Busch: Another key emerging trend is greater utilization of physician associates and nurse practitioners. The scarce supply of board-certified dermatologists has historically been a challenge to sector growth. However, an increasing number of practices are employing a higher ratio of physician associates and nurse practitioners to better leverage their physicians. Successful physician associate and nurse practitioner recruitment strategies not only create significant organic growth opportunities but also allow practices to address underserved patient demand.
Smith: The dermatology landscape is an ideal environment for platforms of scale to thrive. The sector is still in the early innings of its evolution relative to other PPM sectors such as dental or physical therapy. It remains highly fragmented, with the largest platforms still comprising less than 20% of the industry. Structural forces are naturally driving independent practices toward larger groups, as investments in supporting resources allow platforms of scale to alleviate key pain points for dermatologists and unlock growth opportunities that are less accessible to independent practices. Furthermore, many platforms are still only scratching the surface on a diverse array of value creation opportunities, which signals much upside growth potential.
Which attributes should buyers prioritize in the sector?
Smith: Two high-quality dermatology platforms that Harris Williams recently advised—Forefront Dermatology and Dermatologists of Central States (DOCS)—are representative of attributes that are important for success as the industry matures.
Benjamin: Clinically, Forefront is incredibly strong. Culturally, it is very provider-centric. The company provides all of the supporting resources to create the ideal ecosystem for providers to thrive and practice at the top of their licensure. One of Forefront’s biggest differentiators is that it has always invested in infrastructure ahead of its growth. This has allowed it to drive substantial growth over time while remaining tightly integrated.
Forefront also has developed and refined a highly efficient partnership strategy. The company has been very methodical about expanding its footprint in ways that allow it to leverage the benefits of geographic density. Forefront is actively driving organic growth by opening new de novo locations that fill in its existing footprint and recruiting new providers into existing clinics. Additionally, it is executing a thoughtful strategy to drive cosmetic service expansion and take full advantage of that opportunity. Centralized infrastructure and shared services are the backbone of Forefront’s strategy and enable it to successfully achieve scalable growth both organically and via new partnerships.
Smith: DOCS has more than 85 locations across the Midwest. As it has grown, it has maintained its reputation for clinical excellence. It also has a very provider-centric culture. Fostering a supportive and collaborative environment for providers has been a core mission for DOCS dating back to the founding practices, and those values remain fundamental to everything the company does today. As a result, DOCS has been highly successful at attracting best-inclass providers to the practice.
Busch: The company has also been very deliberate with its growth strategy. DOCS has entered new geographies by partnering with local market leaders that are very much aligned with its strong clinical quality and provider-centric philosophy, which has allowed it to propagate its culture and reputation across a broader footprint. It has also focused on contiguous markets to build core market density. The result is a strong, integrated foundation that makes DOCS well positioned for continued growth. In addition to continuing to drive growth through new partnerships and provider recruitment, DOCS views cosmetics as a significant area for expansion and has a strategy in place to tap into the opportunity.
What advice do you have for prospective buyers and investors interested in dermatology?
Smith: Favorable trends will continue to drive growth in dermatology, and the sector offers substantial opportunity to build platforms of scale. Buyers and investors should keep in mind that scarcity of board-certified dermatologists means being an employer of choice is critical to growth. A physiciancentric culture and excellent clinical quality are fundamental to recruiting and retention. A purpose-built infrastructure will support these objectives as well as provide significant operating leverage. Also, density matters in fully realizing the benefits of building a platform. Finally, most practices are dominantly focused on medical-surgical dermatology today, but those with a strategy to pursue cosmetic dermatology will likely find significant untapped growth opportunity.
1. IBIS World and American Med Spa Association. 7
Vision
Vision represents a ~$48 billion sector composed of the services and sale of corrective eye glasses and lenses with steady expected growth of ~3-5%.1,2
Steady growth of vision care services driven by the following key market trends:
✓ Aging population
✓ Growing coverage for vision care
✓ Increase in digital screen usage and asthenopia (eye strain)
✓ Technological innovation resulting in new products
✓ Increasing prevalence of chronic disease
Ophthalmology growing more rapidly at 4-5% driven by the increasing incidence of conditions such as glaucoma, cataracts, and macular degeneration requiring medical/surgical procedures2
In addition to positive secular trends driving long-term growth, the vision market exhibits highly stable demand due to:
› Nondeferrable nature of the service and corrective device purchases
› The limited instance of excess utilization providing for stable reimbursement
SECTOR SPOTLIGHT
8
Independent Optometrists1 $ in billions 3.3% CAGR (2020-2025P) ~$17 billion market 2020 $16.6 2021P $17.2 2023P $18.6 2022P $18.0 2024P $19.1 2025P $19.6 Mass Retailers1 $ in billions 3.1% CAGR (2020-2025P) ~$12 billion market 2020 $11.8 2021P $12.3 2023P $13.1 2022P $12.7 2024P $13.4 2025P $13.8 Ophthalmologists2 ~$19 billion market › ~$1.5 billion refractive surgery market2 › ~$7.5 billion comprehensive ophthalmology market2 › ~$10 billion ASC market related to ophthalmology procedures2 U.S. VISION CARE GROWTH 1. IBIS Reports: Optometrists in the U.S., Eye Surgery Clinics, Eyeglasses & Contact Lens Stores in the U.S., Ophthalmologists in the U.S., and Glasses & Contact Lens Manufacturing in the U.S. 2. HW internal estimates. 9
Vision
› Eye care services include exams and treatment for dry eye, glaucoma, cataracts, diabetes, and macular degeneration
› A prescription issued within the past one to two calendar years, depending on the state, is required for the purchase of prescription eyewear and contact lenses; as a result, the relationship between patients and eye care professionals heavily influences buying decisions
Differentiated patient relationships, service quality, earlier technology adoption, and clinical and product knowledge enable strong independent market share positions:
› Independents perform 68% of all patient eye care service, with share remaining stable1
› Despite lower service share, chains capture 46% of all primary eye care revenue driven by higher sales of eyeglasses and contact lenses1
Growth in eye care professionals will be driven by a steady increase in optometrists (ODs), while growth in ophthalmologists is expected to remain stable
› ODs are licensed practitioners who have obtained a Doctor of Optometry degree from an accredited optometry school (four-year postgraduate program) and who have passed both a written and clinical state board examination
Independent eye care providers control a significant portion of the patient population.
SECTOR SPOTLIGHT
10
Primary Eye Care Provider Share1 Percentage of Patients and Revenue (%) Mass Retail Independent ODs Other Eye Care Professionals Breakdown2 Projected Growth in Ophthalmologists and Optometrists Patient Assessment of Eye Care1 Patient Satisfaction Percentages (%) Independent Mass Retail Higher capture of corrective device sales by mass retailers Revenue 42% 12% 46% Patients 53% 15% 32% Overall Satisfaction 58% 45% Likelihood to Return 71% 53% Likelihood to Recommend 61% 39% Service drives differentiation for eye care providers 1. Latest available Jobson estimates. Note: The primary eye care market includes revenue from prescription eyewear, contact lenses, and eye exams offered by eye care professionals. 2. Jobson, Essilor Report (2018). 0.2% CAGR ('20 - '25) 1.1% CAGR ('20 - '25) 0.9% CAGR ('20 - '25) 16,847 45,546 62,393 2020 17,023 65,214 48,191 2025 Optometrists Ophthalmologists 11
Fertility
The U.S. fertility market is estimated to be $8B across in-vitro fertilization (“IVF”), genetic testing, reproductive tissue storage, and donor services.
› Growing awareness of IVF and related services is creating an ever-larger addressable market opportunity; U.S. IVF services alone are estimated at >$3B and projected to grow at a ~10%+ CAGR through 2025P
Strong, long-term demand drivers including:
› Cultural shift to having children later in life, as well as lifestyle and health issues increasing incidences of infertility
› One of few healthcare service sectors in which clinical outcomes data are measured and reported, providing potential benefit to best-in-class providers
› Significant private pay component provides highly attractive reimbursement profile and insulation from pricing pressures relative to other healthcare sectors
› Highly recession-resistant demand due to parents’ desire to build families and the ticking of the biological clock
Highly fragmented provider landscape primarily comprising local/regional clinics; platforms of scale are able to leverage best practices, invest in leading technology, attract new physician partners and scientists, and improve operations
1. HW internal estimates based on data from Allied Market Research, Cision PR Newswire, and Global Market Insights.
2. Represents Prenatal and New-Born Genetic Testing market.
3. CDC historical cycle data.
Investors are highly interested in the fertility services sector due to its large size, fragmentation, and growth opportunities.
SECTOR SPOTLIGHT
12
Global Fertility Services Market1 (2019 $ in U.S. billions) $34B $1.9B $3.3B $2.5B $8B Strong, Recession-Resistant Demand3 ART Cycles Performed in the U.S. 350,000 300,000 250,000 200,000 150,000 100,000 50,000 Rest of World U.S. Reproductive Tissue Storage and Donor Services Highly recession-resistant with strong market expansion IVF Genetic Testing2 20 01 20 02 20 03 20 04 20 05 20 06 20 07 20 08 20 09 20 10 20 11 20 12 20 13 20 14 20 15 20 16 20 17 20 18 20 19 U.S. Fertility Services Market1 (2019 $ in U.S. billions) 13
Fertility
Favorable trends will continue to drive strong growth in the fertility market.
Growth Drivers
1 2 3
Increasing Awareness & Accessibility
› Increasing awareness of fertility treatments as well as advancements in technology and genetic testing are increasing success rates and lowering total average costs to make treatment more accessible
Cultural Shifts
Increase in Chronic Health Conditions
Reimbursement & Benefit Trends
› Shifting cultural dynamics to have children later in life are driving people to use more IVF services as well as elective fertility preservation services
› Growing population of same-sex couples desiring children driving additional demand
› Increasing prevalence of chronic conditions and health issues driving increasing rates of infertility and demand for IVF services
› Significant private pay component, despite moderately increasing insurance coverage and employee benefits for IVF and genetic testing services
1. HW internal estimates based on data from Allied Market Research, CDC, and Global Market Insights (all figures stated prior to the impact of COVID-19).
2. Represents Prenatal and Newborn Genetic Testing market.
SECTOR SPOTLIGHT
4
14
IVF Services U.S. Market1 Genetic Testing U.S. Market1,2 Reproductive Tissue Storage & Donor Services U.S. Market1 DRIVING SUSTAINED GROWTH 2017 2018 2019 2020 2021 2022E 2023P 2024P 2025P 2017 2018 2019 2020 2021 2022E 2023P 2024P 2025P 2017 2018 2019 2020 2021 2022E 2023P 2024P 2025P $2.7 $2.0 $1.7 $3.0 $2.2 $1.8 $3.3 $2.5 $1.9 $3.6 $2.8 $2.0 $4.0 $3.1 $2.1 $4.5 $3.5 $2.2 $4.9 $3.9 $2.4 $5.5 $4.4 $2.5 $6.2 $5.0 $2.6 2017-2025P CAGR: 7.2% 2017-2025P CAGR: 12.0% 2017-2025P CAGR: 5.5% For the Years Ended and Ending December 31, 2017 – 2025P ($ in U.S. billions)
Market Overview
› Estimated $34 billion+ market size, averaging $400/visit2
› ~$350 per new patient visit3
› ~$315 per well-woman exam3
› ~$480 per routine pregnancy visit3
› Highly fragmented market with ~45,000 licensed OB/GYNs2
OB/GYN Service Segmentation1
Chronic Problem Pre- or PostSurgery or Injury
New
Preventive
› Well-woman
› Prenatal
› Postpartum
81 million annual OB/GYN visits1
Problem
Care
exams
exams
exams 71%16% 7% 6% SECTOR SPOTLIGHT OB/GYN 16
OB/GYN is a highly fragmented, $34+ billion market that frequently serves as the patient entry and referral point to a wide variety of other women’s health sectors. The OB/GYN sector benefits from a number of demand and supply drivers as well as long-term trends that will drive strong, sustainable expansion.
OB/GYN Demand and Supply Drivers... ...Support Underlying Sector Growth Trends That Benefit Sophisticated Providers Demand Drivers Stability and Strong Growth Later Age of Women at Childbirth Increasing Prevalence of Obesity in Women Increased Insurance Coverage for Women Lower Marriage and Birth Rates Increased Preventive Care Payors Seeking Value-Based Care Expanding Vertical Care Models 1. IBIS World Report. 2. Market size based on extrapolations of total OB/GYN visits in 2015 and average cost of visit (NAMCS, Statista, Doximity). 3. MDSave. 17
Strong, stable demand for OB/GYNs is being driven by various cultural trends and increased insurance coverage.
Later Age of Women at Childbirth
U.S. Birth Rates by Age of Women (Rate per Thousand Women Indexed at 100)
300 200 100
250% increase 185% increase 139% increase 56% increase 9% decrease 34% decrease 61% decrease
› Rising need for more frequent and complex services around higherrisk pregnancies due to increased age of women at childbirth1
› The average age of women at childbirth in 1985 was 23.7 years old vs. 26.9 years old in 20181
1985-1990
2010-2015
2005-20102000-2005 2015-2020
0
1955-2000
1990-1995
20-24 years15-19 years 25-29 years 30-34 years 35-39 years 40-44 years 45-49 years SECTOR SPOTLIGHT OB/GYN 18
ovary syndrome, which often results in
issues, affects 1/10 women of childbearing age2
Annually, more than 84,000 women in the U.S. are diagnosed with some
of gynecologic
CDC.
Women’s Health.
Kaiser Family Foundation (2018).
Child Trends, 2017.
National Survey of Family Growth.
Guttmacher Institute.
1.
2.
3.
4.
5. 2021
6.
Increased Insurance Coverage Prevalence of Obesity Increases Risk of Health Problems Lower Marriage and Birth Rates ~2M U.S. Marriages Annually1 Steady decline since the 1980s; 32-year low in 2018 ~60 Births per 1,000 Women Annually4 118 births per 1,000 women in 1960 65% of Women Aged 15-49 Currently Use Contraception5 Only 56% of women used a contraceptive method in 19826 › The U.S. continues to face declining marriage rates, which have contributed to the lowest birth rates in decades › However, the associated increase in demand for contraception is favorable for the OB/GYN sector as it is necessary to maintain an ongoing OB/GYN relationship for prescription oral and implantable contraceptives % of Women Over Age 20 Defined as Obese Risk Factors Associated With Obesity › Polycystic
fertility
›
type
cancer1,2 Growing prevalence of obesity, which has been identified as a risk factor for diseases like polycystic ovary syndrome and gynecologic cancer, reinforces the need for open dialogue with OB/GYNs around screenings and preventive measures 1988-1994 2017-2018 26% 42% Women’s Health Insurance Coverage1 29.6% 5% 6% 57% Medicare Medicaid or CHIP/ SCHIP Private Insurance Other No Insurance Uninsured Rates Among U.S. Women3 2008 2018 18% 11% 28% 13% 36% 21% Low-Income Women <200% FPLWomen 19-64 Women 19-25 19
The overall dental addressable market is a massive $136+ billion market, growing 6% annually, and comprises 200,000+ dentists across ~197,000 practices, of which dental support organizations (DSOs) represent a growing component with significant room for expansion.
Why
Fragmented market with significant consolidation opportunity remaining
Opportunity to add specialties and ancillary services in dense markets
Healthcare-lite reimbursement profile, relative to many other physician practice management models
Highly recession resistant demand with proven ability to recover from pandemic
Reasons Why
Focus on patient care; significantly reduced administrative burden
Ability to overcome significant debt burdens out of school while retaining equity opportunity
Access to greater talent pool
Opportunity for greater equity appreciation as part of scale platform
SECTOR SPOTLIGHT Dental
Dental Market Stats1 Reasons
Investors Love DSOs
Dentists Love DSOs $136B+ 2021 U.S. Market Size 6.2% Projected Annual Market Growth (2021-2027) 200,000+ Number of Dentists in U.S.
1. Stax. 2. Pitchbook. 3. Health Policy Institute and American Dental Association.20
Steady Number of DSO M&A Transactions by Year2... Dental Healthcare Provider Private Equity Buyout Count by Type as of 12/31/2021 2016 80 70 60 50 40 30 20 10 0 2017 2018 2019 2020 2021 Add-on % of Buyout Add-on Platform 84.1% 84.2% 86.2% 88.2% ...With Significant Runway for Growth3 Percentage of Dentists Affiliated With a DSO 2015 2019 Outstanding consolidation opportunity reamins as only 10.4% of dentists were affiliated with a DSO in 2019 76% 71.8% 7.4% 10.4% 21
SECTOR SPOTLIGHT Dental DENTAL MARKET DRIVERS Untapped Whitespace in Dental Treatment Market1... Platforms with sophisticated marketing functions will be well positioned to gain market share from under-penetrated geographies ~65% Of Adults with a Dental Visit in the Past Year ~26% Of Adults with Untreated Dental Cavities ~86% Of Children with a Dental Visit in the Past Year 13%+ Of Children with Untreated Dental Cavities ...Will Be Served by Expanding Pool of Dentists per Capita2 Growing dental school graduate pool from 2005 to 2020 is producing an increasing number of dentists per capita 8,000 6,000 4,000 2,000 2005 54.3 2010 54.4 2020 53.9 2025 54.1 2015 54.8 2030 55.4 2035 56.9 2040 58.3 U.S. Dental School Graduates per Year # of Dentists per 100,000 PeopleAdjusted for Patient Visits Several key themes present an opportunity for prolonged investment and support further dental market growth and expanding DSO consolidation. 22
...With Growing Dentist Excitement for DSO Affiliation4 Percentage of Dentists Affiliated With a DSO by Age Cohort 2017 2019 21-34 35-49 50-64 65+ 2015 16.3% 9.8% 3.4% 2.5% 17.9% 20.4% 11.3% 13.3% 4.5% 5.4% 3.4% 4.0% 1. CDC National Center for Health Statistics. 2. Health Policy Institute and American Dental Association. 3. Harris Williams Analysis. 4. Stax. Extensive Remaining DSO Fragmentation3... Percentage of Practices Affiliated With PE-Backed DSOs, Ranked by Size 2.5% 1.0% 1.2% 1.2% 0.6% 93.6% Despite the fact that there are 100+ PE-backed DSOs today, 93%+ of practices remain unconsolidated by PE Top 5 Non-PE Backed Practices 21-506-10 51-100 11-20 DSO CONSOLIDATION DRIVERS 23
Vision, Dental, and Veterinary Care
Well before the COVID-19 crisis, many healthcare, consumer, and retail investors recognized the value-creation potential at the intersection of these three essential industries. Now that consumer healthcare has shown its resilience, investor interest has only intensified. Here, senior bankers from the Harris Williams Consumer and Healthcare & Life Sciences Groups discuss opportunities in three specific subsectors in which they have collaborated.

FEATURED ARTICLE
24
Five Key Criteria
The consumer healthcare sector includes several specialties, from dental and dermatology to physical therapy, urgent care, and vision. As we describe in Consumer Healthcare: Creating Value by Crossing Industries, Harris Williams has identified five major criteria that influence the degree to which sectors exhibit consumer healthcare characteristics:
1. Choice
In consumer healthcare, patients have some degree of choice (as opposed to being referred to a specific specialist).
2. Interaction Model
Businesses modeled on consumer healthcare can engage in recurring patient relationships or in situations where the need is more acute, but convenience and brand awareness must be decision drivers.
3. Location
Most consumer healthcare providers operate in freestanding, highly visible retail environments or via a “store-in-store” model.
4. Branding and Patient Experience
Consumer healthcare businesses emphasize branding, consumer awareness, and customer experience more than pure healthcare providers do.
5. Payor Dynamics
Consumer healthcare businesses tend to have a higher degree of patient/cash pay and commercial insurance, with less government pay than other healthcare businesses.
“Our more recent experience confirms that deal volume is growing, and likely will continue to accelerate through 2022,” notes Corey Benjamin, a managing director in the Harris Williams Consumer Group.
Here, we highlight the vision, dental, and veterinary subsectors and profile four recent acquisitions that exemplify the continued opportunity for investors in these areas.
A Keen Eye on the Vision Segment
The U.S. medical vision sector presents a significant growth opportunity, supported by strong, resilient demand and a fragmented market landscape ripe for consolidation. The total vision sector is estimated to be about a $48 billion market, with medical vision accounting for approximately $10 billion. Medical vision is expanding more rapidly than the broader industry, with 3% to 5% annual growth.1
Growth is primarily being driven by the aging population and increasing prevalence of chronic ocular conditions: Individuals aged 65 or older account for the vast majority of spending on medical vision services.2
By age 75, approximately half of all Americans have cataracts,3 and glaucoma incidence is projected to increase nearly 50% by 2032.4
The segment’s resilience is driven by a number of factors. Patients typically have work done on their eyes when they need it, regardless of the economic cycle. Furthermore, a general shortage of ophthalmologists drives high physician utilization and provides for a stable reimbursement environment, which is underpinned by a growing prevalence of insurance coverage for vision care. Low-acuity surgical ophthalmic procedures, such as cataract surgery, are also well suited for ambulatory surgery centers (ASCs), which larger and more sophisticated operators can establish and configure to be vision specific. Doing so helps optimize physician and patient workflows, improve outcomes, and generate cost efficiencies.
It’s also an attractive space for consolidators, says Andy Dixon, a managing director in the Harris Williams Healthcare & Life Sciences Group. “Historically, the ophthalmology specialty was extremely fragmented, with very little private equity investment,” he says. “In the last four to five years, consolidation has meaningfully accelerated, and we expect that trend to continue and even accelerate. While some platforms are building scale within general (anterior) ophthalmology, others are vertically integrating downstream into medical optometry as well as upstream into retina and other sub-specialties to capture referrals.” Dixon notes that while private equity firms have completed more than 30 platform investments in the vision industry since 2014, the sector continues to be fragmented, with a limited number of providers of scale.
Consolidation also provides the opportunity to drive greater provider utilization, says Dixon. As platforms come together, ophthalmologists are in environments where they can be more efficient, focusing more of their time on surgery and other “top-of-license” activities, allowing preand post-operative and other types of care to be provided by medical optometrists and other clinicians. Many small physician-owned practices want to become platform add-ons to broaden their networks, expand access to patients and referral networks, modernize their practices, and relinquish administrative duties.
25
Case in Point: NVISION
NVISION® Eye Centers, a leading provider of ophthalmology services, is an excellent example of the investment opportunity in the vision sector. “Its business has more than fully rebounded from the impacts of COVID-19, and it has the strategy and infrastructure in place to fuel continued rapid growth,” says Cheairs Porter, a managing director in the Harris Williams Healthcare & Life Sciences Group. Harris Williams recently advised NVISION on its sale to the Ontario Teachers’ Pension Plan.

NVISION is a leading vision practice in the western U.S. with 43 locations, including eight ASCs. It employs a hub-and-spoke model to build density in core markets, thereby improving brand equity, efficiencies, and utilization at its ASCs. The company prioritizes secondary metropolitan areas with favorable demographics and competitive dynamics. It has developed a highly successful acquisition model, having integrated 31 clinics and ASCs via acquisition from its launch in 2010 through 2019.
With its roots as a refractive practice, NVISION has expanded its services over time into performing cataract surgeries and other medical services and now offers a diverse, medically focused service mix that provides a highly stable revenue base.
Its heritage operating in a consumer-driven refractive services market enabled it to develop unique capabilities to engage customers and effectively broaden its base. For example, NVISION can use refractive procedures to fine-tune or “touch up” cataract surgery, which removes the cataract while restoring a person’s vision to 20/20, improving residual nearsightedness, farsightedness, and astigmatism. “NVISION has a much higher success rate than the industry average in completing the surgery effectively the first time, which benefits the patient as well as the business,” adds Dixon.
The Increasingly Healthy Dental Segment
Historically noncyclical before COVID-19, the dental sector was one of the consumer healthcare segments hit hardest by the pandemic. However, patient demand rebounded quickly for high quality businesses that proved they can operate safely and effectively in the COVID-19 environment.
The dental segment is an approximately $136+ billion market, with a projected annual growth of 6%+ through 2027.5 Investment by institutional capital over more than a decade has led to the creation of larger platforms in the vertical. However, consolidation opportunities remain: Independently owned clinics still account for 10.4% of the sector, creating substantial acquisition-based growth opportunities.6
Multisite dental service organizations (DSOs) bring benefits to patients and staff that independent dental offices are less able to provide. For example, sophisticated DSOs often can invest in more sophisticated patient marketing, as well as engagement and scheduling tools. They are increasingly seen as employers-of-choice for dentists, as they generally offer a better work-life balance, fewer administrative burdens, and greater financial security. Such platforms are also poised to scale, using existing infrastructure to spur growth.
Case in Point: Midwest Dental
Midwest Dental, one of the largest DSOs in the country, has more than 230 offices located primarily in the upper Midwest and New England regions, built over more than 40 years. “This is a great example of high-quality businesses drawing investor interest in the multisite dental space,” says James Clark, a managing director in the Harris Williams Healthcare & Life Sciences Group.
Harris Williams recently advised Midwest Dental on its sale to Smile Brands, a portfolio company of Gryphon Investors. The combined company is now one of the largest DSOs in the country, representing 650 offices and over 8,000 employees, including 2,200 dentists and hygienists operating in 30 states.


“Midwest Dental stands out for its significant scale, density in attractive markets, and long track record of growth,” notes Dixon. “Its recurring, hygiene-driven model and focus on building long-term patient relationships has driven a high patient retention rate and loyalty.”
Dixon says add-on acquisitions are a core focus and competency, with a proven partnership model for dentists. At its founding and during early stages of growth, the company operated in smaller communities, affiliating with practices to provide support and ultimately an exit strategy for founding dentists. Over time, Midwest Dental expanded to larger markets, where it continues to focus its strategy today.
Midwest Dental has a collaborative approach and true partnership with dentists, making it the dentist-preferred partner among DSOs, says Clark. “The company has made strategic investments in infrastructure and practice management culture to lay the groundwork for future growth. Its sophisticated marketing is highly successful at attracting new patients, helping Midwest Dental to grow at an above-market rate.”
26
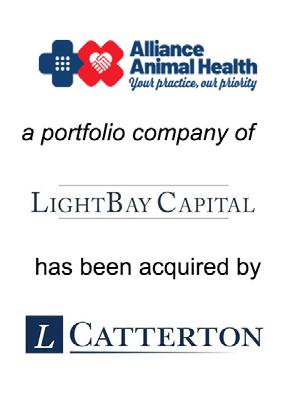
The Booming Veterinary Segment
As of 2021, veterinary services was a $52 billion market, growing at a projected CAGR of 4% through 2023.7 It is a highly resilient segment due to pet owners’ propensity to spend despite financial challenges. Demand for veterinary services actually accelerated in 2020, spurred by a significant increase in new pet ownership as people found themselves with more time at home.8 In addition to their inherent resilience, veterinary services are largely private pay, an attractive characteristic for investors. They are also less subject to the malpractice concerns facing human healthcare providers.
With these tailwinds at their backs, investors are building sophisticated platforms with significant scale. Some are taking an integrated veterinary services approach, combining general practitioners, specialty veterinary services, emergency services, and retail. However, even with these trends, the market remains highly fragmented, with substantial opportunity remaining to consolidate the subsector.
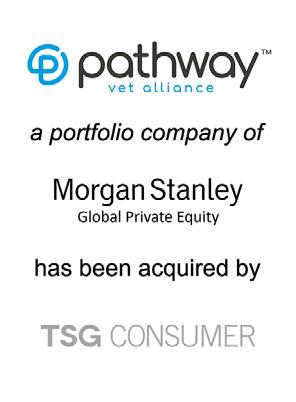
Case in Point: Pathway Vet Alliance
Founded in 2003, Pathway Vet Alliance has grown from a single veterinary practice to include over 270 general, specialty, and emergency practice locations, as well as more than 85 THRIVE Affordable Vet Care locations. It also includes the management services organization Veterinary Growth Partners, which supports over 5,500 affiliated and unaffiliated member hospitals with education, training, and coaching services. Harris Williams recently advised Pathway, a portfolio company of Morgan Stanley Capital Partners (MSCP), on its transaction with TSG Consumer Partners (TSG).
Pathway has differentiated itself by focusing on the unique needs of each practice, partnering with local teams to implement their vision and work with their values. It has also built an integrated pet care ecosystem that meets the needs of pets, pet families, and pet care providers nationwide. “Through its integrated platform, Pathway is well positioned to capture greater share of customer wallet and serve pet owners’ comprehensive needs over their pet’s lifetime,” says Geoff Smith, a managing director in Harris Williams’ Healthcare & Life Sciences Group. “Given the company’s strong and growing national footprint, integrated service offering, and consumer focus, we believe Pathway is poised for tremendous continued success.”

Case in Point: MedVet Associates
MedVet is a growing nationwide network of more than 30 specialty and emergency services veterinary hospitals. Its specialty focus allows MedVet to provide the best possible clinical care. It also gives specialists the opportunity to work among other specialists, and, as new specialties are brought into each location, there’s continued opportunity for organic growth. Harris Williams recently advised MedVet on its investment from entities affiliated with the Goldman Sachs Merchant Banking Division and SkyKnight Capital. The company had previously received minority investments, which supported its expansion from five hospitals to its portfolio of over 30 hospitals today.
“The transaction is indicative of the strong interest and activity that we’re seeing from investors in the veterinary services sector,” says Smith. “We are excited for MedVet’s management, veterinarians, and employees, and look forward to following the company’s bright future.”

The Outlook
The vision, dental, and veterinary specialty subsectors within the multisite healthcare sector have nuances that make them unique. However, they share strong fundamentals that make them attractive investment opportunities. They have weathered the pandemic, with many businesses returning to higher year-over-year volumes. While at different stages of consolidation, these subsectors are still highly fragmented, providing the opportunity to build sizeable platforms and drive substantial growth.
1.
2. University of Chicago - Cost of Vision Problems Study.
3. National Eye Institute.
4. Prevent Blindness - Future of Vision Report.
Stax.
Ibid.
World;
Street Research.
The Washington Post.
IBIS Industry Reports, National Eye Institute data, HW proprietary data and internal estimates.
5.
6.
7. IBIS
Wall
8.
27
Physical Therapy
Rehabilitation services represent a ~$56 billion market in the U.S., encompassing a wide range of patient needs in a variety of clinical care settings.
› Patients seek treatment from physical therapy providers for a variety of reasons, including general pain management, rehabilitation from injury, recovery from surgery, and ongoing wellness and injury prevention
› Since treatment needs are wide-ranging, individual therapists may choose to specialize and focus on the demands of a specific patient demographic
› Rehabilitation takes place in a variety of clinical care settings, including traditional outpatient and inpatient provider sites, third-party sites that rely on contract physical therapy providers, as well as in the patient’s home
Orthopedic
Treatment of musculoskeletal disorders and injuries
Sports
Treatment tailored to recreational and professional athletes
Pediatric
Rehabilitation services focused on conditions impacting infants and children
Outpatient Clinics ~$34B Market1
Physical therapy services provided in an ambulatory setting not requiring an overnight stay
✓ Effective treatment of both chronic and acute medical home health conditions; typically less medically complex than inpatient cases
✓ Reduces need for high-cost surgical procedures and diagnostic tests, and/or speeds recovery
✓ Customizable treatment, limiting time away from work and family
x Limited patient oversight outside of treatment sessions
SECTOR SPOTLIGHT
28
TREATMENT TYPES & CARE SETTINGS FOR THE
REHABILITATION SERVICES MARKET
Cardiovascular
Treatment of circulatory system issues following events like coronary bypass surgery or heart attacks
Neurological
Treatment of neurological disorders along with brain or spine-related injuries
Geriatrics
Rehabilitation services focused on conditions that affect older patients, including arthritis, hip and joint replacement, and balance disorders
Inpatient Facilities
~$18B Market2
Physical therapy services provided to patients in either a long-term acute care (LTAC) hospital or inpatient rehabilitation facility (IRF)
✓ Effective treatment following a serious injury or surgery where more intensive care from an interdisciplinary team is required
✓ Limits outside distractions and allows patient to focus on recovery
x Highly disruptive to family and work life
Contract Therapy
~$4B Market2
Delivery of physical therapy services at nursing homes, assisted living facilities, and retirement communities
Home Health
Delivery of physical therapy services at a patient’s residence, relying on in-home equipment to provide care3
1. WebPT, Industry Trends in M&A and Total Addressable Market Study.
2. HW internal estimates based on sector experience and third-party sources including WebPT and IBIS industry reports.
3. In addition to providing basic physical therapy services, home health providers may also offer skilled nursing care, occupational therapy, speech therapy, or daily living assistance, which are not classified as rehabilitative care for purposes of these materials.
~$56 BILLION
29
SECTOR SPOTLIGHT Physical Therapy Patient Reasons for Seeking Physical Therapy1 Market Overview 18% 18% 17%8% 8% 8% 8% 7% 9% Treatment of Chronic Injury Back Pain Rehabilitation From Traumatic InjuryRehabilitation From Sports Injury Recovery From Arthroplasty Surgery General Pain Management Work-Related Injury Wellness & Injury Prevention Other U.S. outpatient physical therapy is a ~$34 billion market supported by strong demand drivers creating sustainable, long-term expansion. 30
Outpatient Physical Therapy Demand Drivers
Increasing Desire to Live Active Lifestyles
Compelling Care Benefits and Cost Advantages
Decreasing Barriers to Direct Patient Access
Aging U.S. Population
Increasing Demand for Non-Opioid Alternatives
› Outpatient therapy represents ~60% of the rehabilitation services sector with a market size of ~$34 billion2
› The outpatient therapy market is expected to grow ~3% annually through 2024P3
› 127 million Americans (1 in 2 adults) are affected by a musculoskeletal condition that can be improved by physical therapy4
› Highly fragmented market with ~38,000 outpatient physical therapy clinics in the U.S.5
American Academy of Orthopedic
1. Stax Industry Survey, 2019.
WebPT, Industry Trends in M&A and Total Addressable Market Study.
IBISWorld, Physical Therapy Rehabilitation Centers in the US, 2021.
two Americans have
condition, 2016.
Web PT and HW internal estimates.
2.
3.
4.
Surgeons, One in
a musculoskeletal
5.
31
SECTOR SPOTLIGHT Medical Spa LARGE, RAPIDLY GROWING NORTH AMERICAN MARKET Massive Market With Solid Growth Retail Spend in $U.S. billions 2017 $11.6 2018 $12.1 2019 $12.7 2020 $10.8 2021 $14.1 2022E $15.8 2023P $17.2 2024P $18.2 2025P $18.9 2026P $19.5 6% CAGR ✓ 100% Private Pay ✓ Highly Recurring and Effective Services ✓ Nature of Treatments Supports Extended Patient Lifetime Value ✓ Services Can Be Performed by Physician, Nurse, or Technician ✓ Brand Relevance/Patient Loyalty ✓ Affordable Pricing Promotes Further Resiliency Compelling Characteristics of the Medical Spa Market American Med Spa Association 2019 Report and Proprietary Market Study.32
STRONG TAILWINDS DRIVING LONG-TERM GROWTH
Increasing Awareness and Adoption of Services
71%
of consumers worldwide are willing to see an aesthetic dermatology professional
65%
of consumers agree that aesthetic services have become more socially acceptable
69%
Heighted Importance of Body Positivity/Self-Care
of consumers say looking their best is important to their daily activities
64%
of consumers say looking fit and healthy, and being on trend with fashion and beauty, contributes to their confidence
Consumers Increasingly Willing to Spend More on Aesthetics
50%
of 2020 consumers planned to spend more on aesthetic treatments in the following year
Expanding Addressable Market — Young Adults & Men
63%
of women aged 18-24 say they are willing to visit an aesthetic dermatology professional
73%
of 2021 consumers planned to spend more on aesthetic treatments in the following year
3x
Growth in aesthetic dermatology procedures among males since 2000
Technology Driving Advancements in Medspa Treatments
› Technological advancements within aesthetic dermatology have helped physicians to continue to efficiently and safely address current treatments and better address unmet needs
› New technologies continue to expand the prospective menu of safe, noninvasive aesthetic services
Allergan, American Spa, McKinsey. 33
SECTOR SPOTLIGHT Medical Spa Medical Spa Market by Service Retail Spend in $U.S. Billions 2021 2022E 2023E 2024E 2025E 2026E $14.1 $15.8 $17.2 $18.2 $18.9 $19.5 $3.6 $4.2 $4.7 $5.0 $5.2 $5.3 $3.8 $4.5 $5.1 $5.5 $5.9 $6.3 $0.6 $0.7 $0.7 $0.8 $0.8 $0.8 $2.9 $3.1 $3.2 $3.2 $3.2 $3.2 $3.0 $3.3 $3.5 $3.6 $3.8 $3.9 Core services display solid growth, led by highly recurring services such as neuromodulators and fillers Other Noninvasive 5.0% CAGR Laser Treatments 1.9% CAGR Body Contouring/ CoolSculpting 3.4% CAGR Fillers 10.5% CAGR Neuromodulators/ Botox 8.0% CAGR 7% CAGR The medical spa industry is composed of attractive, fast-growing services. 34
Highly Fragmented Market with Opportunity for Consolidation
Retail Spend in $U.S. Billions
› The medical spa industry has over 2,900 clinics in North America, comprised of mainly small-scale “mom and pop” operators
› Industry will continue to consolidate as scaled operators increasingly benefit from operational efficiencies, including:
› Veteran management teams with greater operational depth and expertise
› More resources available to invest in infrastructure, such as marketing, technology, operational processes, compliance, training, and research
› Higher employee retention for clinicians and corporate-level team members as a result of in-house professional development opportunities and higher compensation
› Superior standardized process across clinics and patient care driving referrals and patient retention
Market Share by Clinic Count Retail Spend in $U.S. Billions Market Share by Clinic Count >2,900 Pure-play Medspas in North America 60%-70%+ Are Single-Location Operators $14.1B North America Market Size 7% Industry CAGR 2021 – 2026P Massive Market with Limited Number of Scaled Platforms ~5,700 - 8,000 Clinics All Aesthetic Dermatology Clinics ~76% (~2,200 - 3,400 clinics) ~51% (~2,900 - 4,600 clinics) ~2,900 - 4,600 Clinics ~24% (~700 - 1,200 clinics) ~49% (~2,800 - 3,400 clinics) Pure Play Medspas Pure Play Medspas All Other Aesthetic Dermatology Types 100% 90% 80% 70% 60% 50% 40% 30% 20% 10% 0% Proprietary Market Study. 35
Gastroenterology
Stable Reimbursement Environment
Professional and facility fees remain relatively similar to prior years, with some reimbursement rates increasing given further hospital price transparency as ambulatory surgery center (ASC) reimbursement rates come more in line with hospital-based outpatient department (HOPD) rates
Expansion of ancillary service offerings, including ASCs, in-office endoscopy suites, anesthesia, and pathology, drive top-line growth while scale and workflow optimization enhancements drive bottom-line margin expansion
Advanced endoscopic technological innovations and other ancillary services improve efficiency metrics, patient satisfaction and outcomes, and quality measures
Despite recent emergence of several platforms, significant consolidation opportunity remains, with over 1,300+ unconsolidated practices across the country1
SECTOR SPOTLIGHT
Margin Optimization Capabilities Technological Advancements Highly Fragmented Market 36
The gastroenterology services market continues to show high levels of activity, with accelerating deal momentum across the country as consolidation trends continue to take hold of the market. Aging Population, Including Increasing 65+ Cohort 1 2 Increasing Diagnoses/Prevalence of GI Diseases 3 Decrease in Recommended Colorectal Screening Age From 50 to 45 4 Continued Shift in Surgery Expansion to ASCs ATTRACTIVE MARKET TAILWINDS 2,3,4 1. Harris Williams market research. 2. U.S. Census Bureau. 3. NIDDK. 4. American Cancer Society. 37
Gastroenterology
Overview and Key Takeaways
› Healthy growth driven by an aging population, increasing prevalence of chronic conditions, broad insurance coverage, and technological advancements
› Early stage of consolidation, but is accelerating with private equity buyers leading the charge
› American Cancer Society advocating screening at 45 years of age (not 50), as colorectal cancer is the third most common internal cancer
› Non-discretionary nature has produced stabilization postpandemic, despite significant dip in March/April 2020
SECTOR SPOTLIGHT
U.S. GI Physician Practices1 Practices with main specialty of gastroenterology >45 Physicians <3 Physicians 3 – 5 Physicians 20 – 44 Physicians 6 – 19 Physicians 255 43 15 418 1,381 2,100+ GI Physician Practices in the U.S. 38
Gastroenterologist Dynamics
Circle fill represents attractiveness to investor/consolidator
Compensation
Compensation in the gastroenterology field is at the higher end of the spectrum and will likely increase given the growing shortage of practicing gastroenterologists relative to the increasing demand for services
Recruitment
The U.S. GI physician shortage is expected to exceed 1,600 physicians in 2025, resulting from increased demand for screening and preventive medicine by an aging population2
Retention
Given barriers, including startup costs and required technological infrastructure, gastroenterologists are becoming more likely to join larger organizations to recognize benefits of scale
2022.
NIDDK.
2022 Report.
Statistics ~$35M 2021 Gastrointestinal Services Market Size4 60M – 70M People Affected by Digestive Diseases5 ~3% Industry CAGR4 15,450+ Active Gastroenterology Physicians6 71.6% 2020 Colorectal Cancer Screening Rate7 $486k Avg. Physician Compensation8 U.S. Gastro Payor Mix: Median % By Coverage3 Private Insurance 40% 30% 20% 5% 5% 5% 5% Medicare Medicaid Workers’ Compensation TriCare/CHAMPUS/VA Self-Pay and Sliding-Fee Schedule Uncompensated Care 1. Definitive Healthcare. 2. Merritt Hawkins. 3. National Commission on Certification of Physician Assistants. 4. Insights
5.
6. Association of American Medical Colleges. 7. Centers for Disease Control and Prevention. 8. Merritt Hawkins
39
Urology
Platforms that take advantage of current sector dynamics to scale in the early innings of consolidation will stand to benefit most from continued demand tailwinds and best position their provider workforce to combat future supply shortages.
BROAD PHYSICIAN PRACTICE MANAGEMENT THEMES
Aging Population
Favorable Demand Tailwinds With Projected Headwinds on Supply Side
Fragmented Landscape
Platform Value
SECTOR SPOTLIGHT
40
The urology services market is one of the more nascent physician services sectors undergoing earlystage consolidation; given long-term tailwinds and increased incidence of urological conditions, the sector is ripe for continued expansion as platforms grow in scale and sophistication.
KEY UROLOGY SERVICES SECTOR DYNAMICS 1,2,3,4
› 50%+ of urology visits were patients over the age of 65
› The U.S. population 65 years of age or older is expected to grow 2.9% annually through 2030
› Patient demand is expected to outpace the supply as 50%+ of practicing urologists are 55 years of age or older, with only 300 graduating from residency annually
› Despite challenged long-term supply/demand dynamics, the urologist-to-patient ratio has increased in the last five years
› Highly fragmented landscape with limited national platforms
› Structural dynamics support continued consolidation of independent practices
› Scale and platform infrastructure unlock significant value creation opportunities over and above what smaller practices can realize independently
› Ancillary service revenue model allows for rapid diversification of revenue base
3. American Urological Association:
1.
State of
Urological Association:
Ambulatory
Urology Workforce
Residents
U.S.
National
Medical Care Survey 2.
Census Bureau
2021 | The
the
and Practice in the United States 4. American
Urology
| In the United States and Across the Globe 41
Overview and Key Takeaways
› Urology is in a very early stage of consolidation, with the opportunity to gain market share rapidly through M&A and platform scaling
› Despite high projected demand for urologists coupled with a tight physician supply, the urologist-to population ratio has shown steady improvements
› Complex reimbursement environment and high barriers to entry provide significant opportunity for scaled platforms and drive urologists to join larger organizations
U.S. Urology Physician
SECTOR SPOTLIGHT Urology
Practices1 Practices with main specialty of urology
2% 1% ~2,100 Urology Physician Practices in the U.S. >45 Physicians20 – 44 Physicians 12% 20% 65% <3 Physicians 3 – 5 Physicians 6 – 19 Physicians 42
Urologist Dynamics
Circle fill represents attractiveness to investor/consolidator
Recruitment
Projected physician shortage most likely to impact smaller multi-practice groups, where there are limited HR capabilities2
Retention
Strong physician retention aided by alignment of incentives through usage of equity models at platforms
Compensation
Urologist compensation is at the higher end of specialty physician services and will likely increase given the degree of specialization
Urology Visits Are Routine Visits for Chronic Problems3
Payor
in Risk of Bladder Cancer Between the Ages 40 – 805
Practicing Urologists4
Physician
Survey.
Advisors.
U.S. Urology
Mix3
Statistics 49.6% Of
16x Increase
12,100+ Active
$477k Avg.
Compensation2 44% 5%5% 46% Medicaid or CHIP Medicare Private Insurance Other 1. Definitive Healthcare. 2. Merritt Hawkins: The Emerging Shortage of Medical Specialists. 3. National Ambulatory Medical Care
4. American Urological Association, Active Defined as at Least 25 Hours of Clinical Work per Week. 5. Global Healthcare
43
Contacts

John Neuner | Managing Director and Co-Head Consumer Group jneuner@harriswilliams.com
Cheairs Porter | Managing Director and Co-Head Healthcare & Life Sciences Group cporter@harriswilliams.com


Geoff Smith | Managing Director and Co-Head Healthcare & Life Sciences Group gsmith@harriswilliams.com

Corey Benjamin | Managing Director Consumer Group cbenjamin@harriswilliams.com
Ryan Budlong | Managing Director Consumer Group rbudlong@harriswilliams.com


James Clark | Managing Director Healthcare & Life Sciences Group jclark@harriswilliams.com


Andy Dixon | Managing Director Healthcare & Life Sciences Group adixon@harriswilliams.com


Dr. Julian Feneley | Managing Director Healthcare & Life Sciences Group jfeneley@harriswilliams.com
Whit Knier | Managing Director Healthcare & Life Sciences Group wknier@harriswilliams.com

Dan Linsalata | Managing Director Technology Group dlinsalata@harriswilliams.com
Nathan Robertson | Director Healthcare & Life Sciences Group nrobertson@harriswilliams.com


Charles Busch | Vice President Healthcare & Life Sciences Group cbusch@harriswilliams.com


Relevant Harris Williams Transactions

Office Locations
Boston Cleveland Frankfurt London Minneapolis Richmond San Francisco Washington, DC
Statistics
firm history
from
repeat clients
MDs promoted from within firm
from sell-side transactions
Investment banking services are provided by Harris Williams LLC (“Harris Williams”). Harris Williams is a registered broker-dealer and member of FINRA and SIPC. Harris Williams & Co. Ltd is a private limited company incorporated under English law with its registered office at 8th Floor, 20 Farringdon Street, London EC4A 4AB, UK, registered with the Registrar of Companies for England and Wales, registration number 07078852. Harris Williams & Co. Ltd is authorized and regulated by the Financial Conduct Authority. Harris Williams & Co. Corporate Finance Advisors GmbH is registered in the commercial register of the local court of Frankfurt am Main, Germany, under HRB 107540. The registered address is Bockenheimer Landstrasse 33-35, 60325 Frankfurt am Main, Germany (email address: hwgermany@harriswilliams.com). Geschäftsführers/ Directors: Jeffery H. Perkins, Paul Poggi, VAT No. DE321666994. Harris Williams is a trade name under which Harris Williams LLC, Harris Williams & Co. Ltd and Harris Williams & Co. Corporate Finance Advisors GmbH conduct business.
The information and views contained in this content have been prepared in part by Harris Williams. This content does not purport to be comprehensive or to contain all the information that a recipient may need in order to evaluate any investment or potential transaction. This content is not a research report, as such term is defined by applicable law and regulations, and is provided for informational purposes only. Any and all information, including estimates, projections and other forward-looking statements, presented in this document may involve various assumptions and significant elements of subjective judgment and analysis that may or may not be correct. Harris Williams has not independently verified, and neither Harris Williams nor any other person will independently verify, any of the information, estimates, projections or forward-looking statements contained herein or the assumptions on which they are based. The information contained in this document is made as of the date hereof unless stated otherwise. Harris Williams does not expect to update or otherwise revise this document nor provide any additional information, nor correct any inaccuracies herein which may become apparent.
This content is intended for institutional use only and should not be relied upon by retail investors or members of the general public. The information contained herein is believed by Harris Williams to be reliable but Harris Williams makes no representation or warranty as to the accuracy or completeness of such information, and information contained herein that is based on material prepared by others may involve significant elements of subjective judgment and analysis which may or may not be correct. Opinions, estimates and projections contained herein constitute Harris Williams’ judgment and are subject to change without notice.
This content is not to be construed as investment advice an offer to buy or sell or a solicitation of an offer to buy or sell any financial instruments or to participate in any particular transaction, nor shall this content form the basis of any contract. It does not constitute and should not be construed as an endorsement or recommendation of any entities’ products or services.
No part of this material may be copied or duplicated in any form or by any means, or redistributed, without Harris Williams’ prior written consent.
Harris Williams has a broad range of industry expertise, which creates powerful opportunities. Our clients benefit from our deep sector experience, integrated industry intelligence and collaboration across the firm, and our commitment to learning what makes them unique.
70% revenue
70%
30+ year
83%
revenue
92%
www.harriswilliams.com
