14, 2023


Launch Meeting
February
Jacksonville/Duval County Market Value Analysis: Block by Block
About Reinvestment Fund
We are a national mission-driven financial institution that creates opportunity for underserved people and places through partnerships. We marshal the capital, analytics, and expertise necessary to build strong, healthy, and more equitable communities.

Since 1985, Reinvestment Fund has made $2.7 billion in cumulative investments and loans.

We are supported by 830 investors that include individuals, foundations, religious institutions, financial institutions, civic organizations and government.
How we work:
and Investing
Solutions PolicyMap
Lending
Policy
The Market Value Analysis
The Market Value Analysis (MVA) is a tool to help residents and policymakers identify and understand the elements of their local real estate markets. It is an objective, data-driven tool built on local administrative data and validated with local experts. With an MVA, public officials and private actors can more precisely target intervention strategies in weak markets and support sustainable growth in stronger markets.
MVAs in Action: How Cities Use the MVA
Component of a local land banking strategy (Phila., NOLA, Pittsburgh, Wilmington)
Guide capital budget (Detroit)
Focus code enforcement (Phila., Baltimore, Indianapolis, NOLA)
Benchmark quality of life measures (Phila.)
Equitable development strategy (DE/DSHA)
Target statewide Strong Neighborhoods Revolving Loan Fund (DE/DSHA)

Inform LIHTC
QAP (DE/DSHA)
Develop CDBG ConPlan / Comprehensive plan (Detroit, Wilmington, St. Louis, Richmond, Dallas)
Assessment of Fair Housing (Phila., Richmond)
Assess changes in the market over time (Phila., Baltimore, Pittsburgh)
Evaluate development opportunities (Pittsburgh, Phila., Houston, Detroit, St. Louis, cities in NJ)
Target demolition and acquisition activities (Baltimore, Phila., Detroit, NOLA)
Select transformative tipping point projects (Phila., Baltimore, Pittsburgh, NOLA)
Engage partners – philanthropic, non-profit, government – in coordinated efforts to rebuild neighborhoods (Baltimore, Milwaukee, NOLA)
Guide federal Neighborhood Stabilization Program Investment (States of PA & NJ, Houston, Detroit)
Our Normative Assumptions
When analyzing markets we begin with these principles:
Public subsidy is scarce; acting alone, subsidies cannot create a market
Public policy and subsidy must leverage private investment or create conditions for investment to occur
In distressed markets, build from strength by investing near strong assets
All residents are customers with an expectation of quality public services and amenities
The best decisions are based on the sound and objective analysis of quantitative and qualitative data
The MVA Process
Validating Data is Critical.
Researchers must systematically visit and observe neighborhoods in the city to understand the data and final model.
Geographic Scale Matters.
MSA and Census tract geographies are too large to accurately reflect the nuances of local real estate markets.
One Size Does Not Fit All.
MVA components and models share some similarities across cities but must be customized to the unique traits of each city.
Integrate Local Knowledge. All models are tested with local experts to incorporate qualitative feedback from each geography.
Lessons from 15+ years of experience Acquire local administrative data and geocode to Census block group geographies. 1 Manually inspect areas for conformity with local experts to assess fit. 4 Manually inspect and validate data layers by driving through the area. 2 Alter parameters; re-solve and re-inspect until model accurately represents area. 5 Use statistical cluster analysis to identify areas with common attributes. 3 Summarize and describe the characteristics of each market. 6
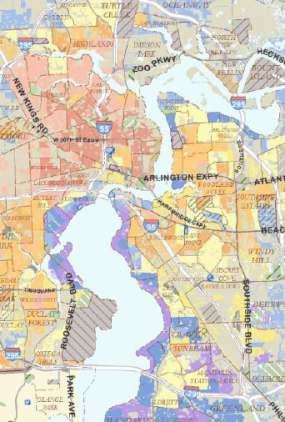
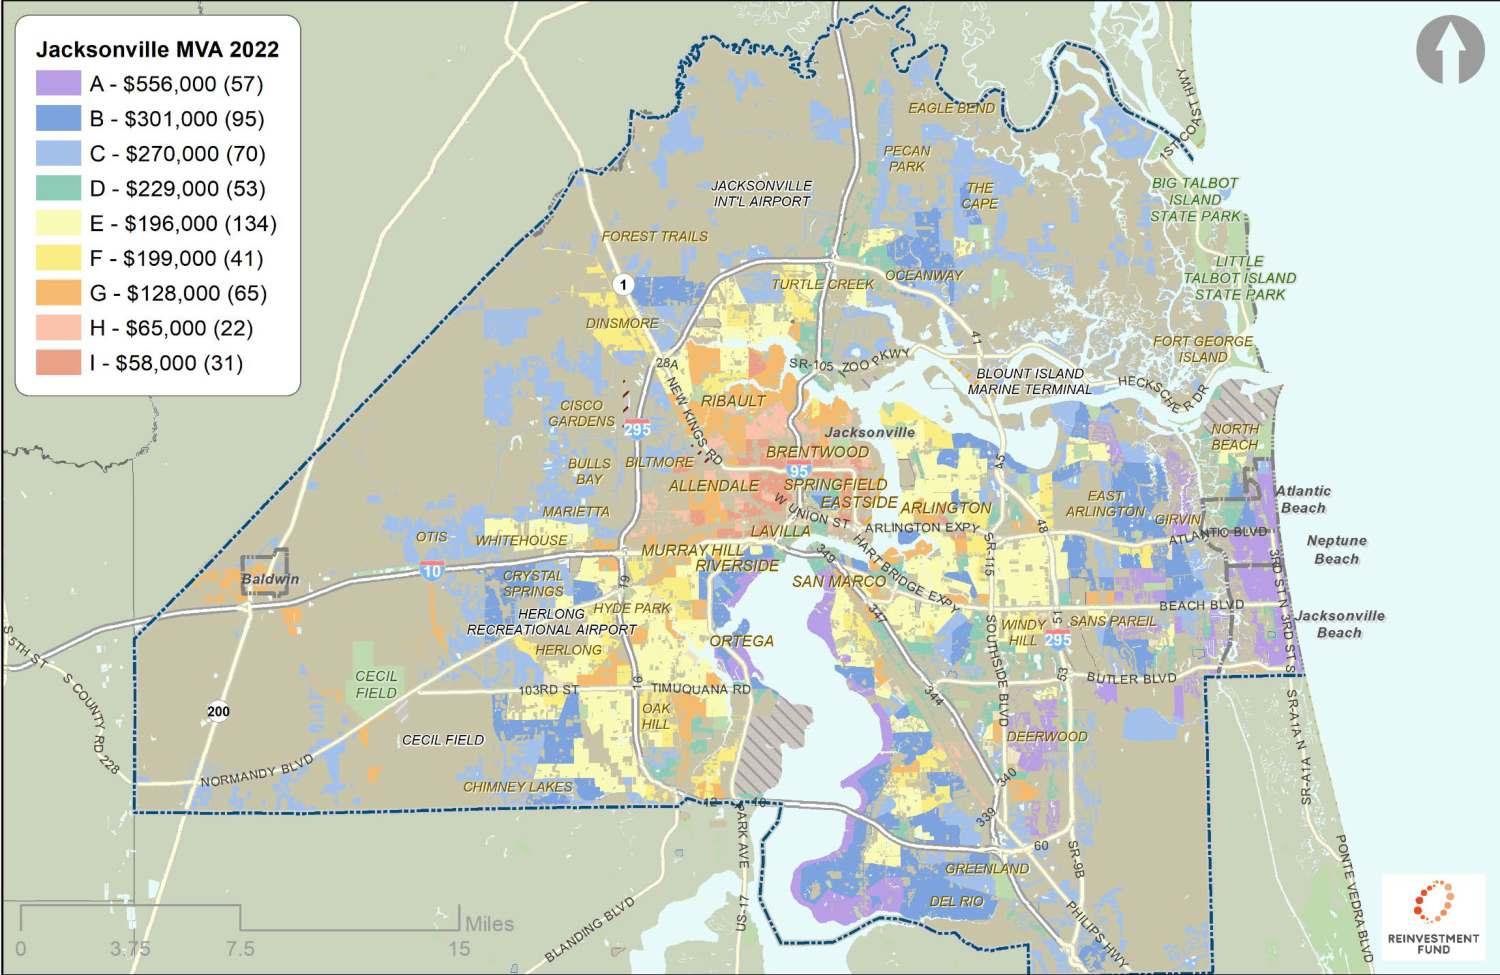
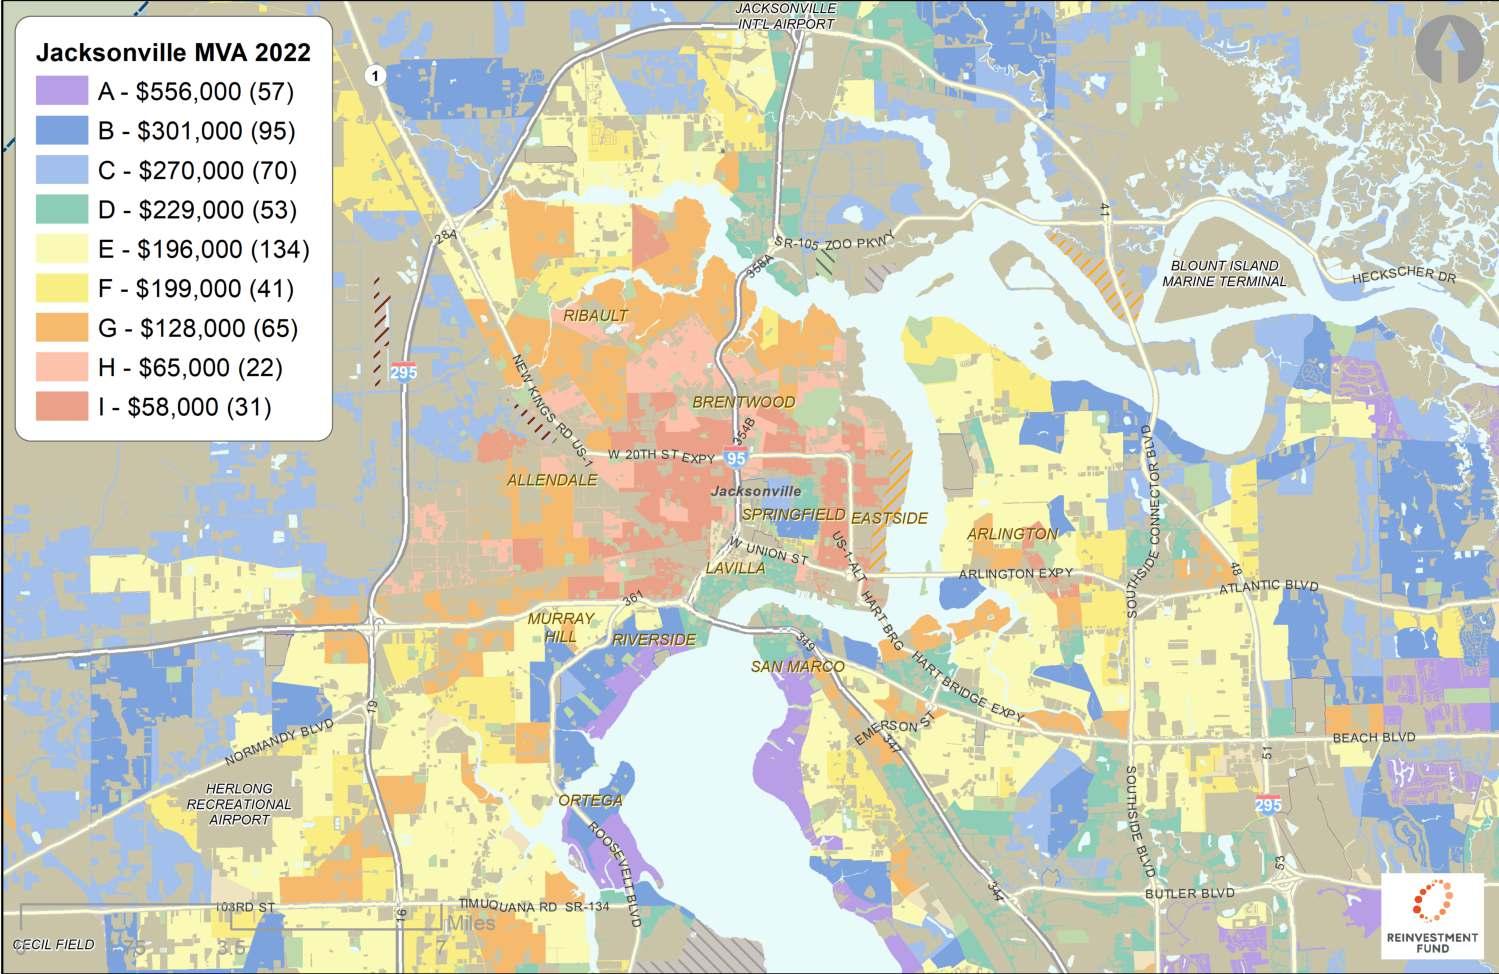
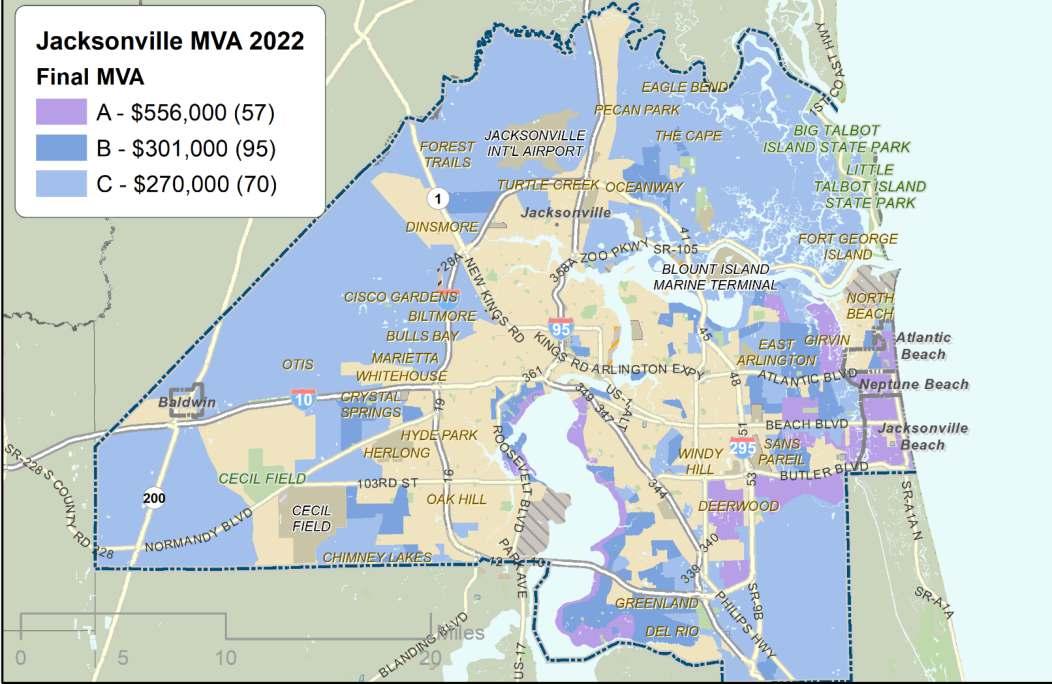
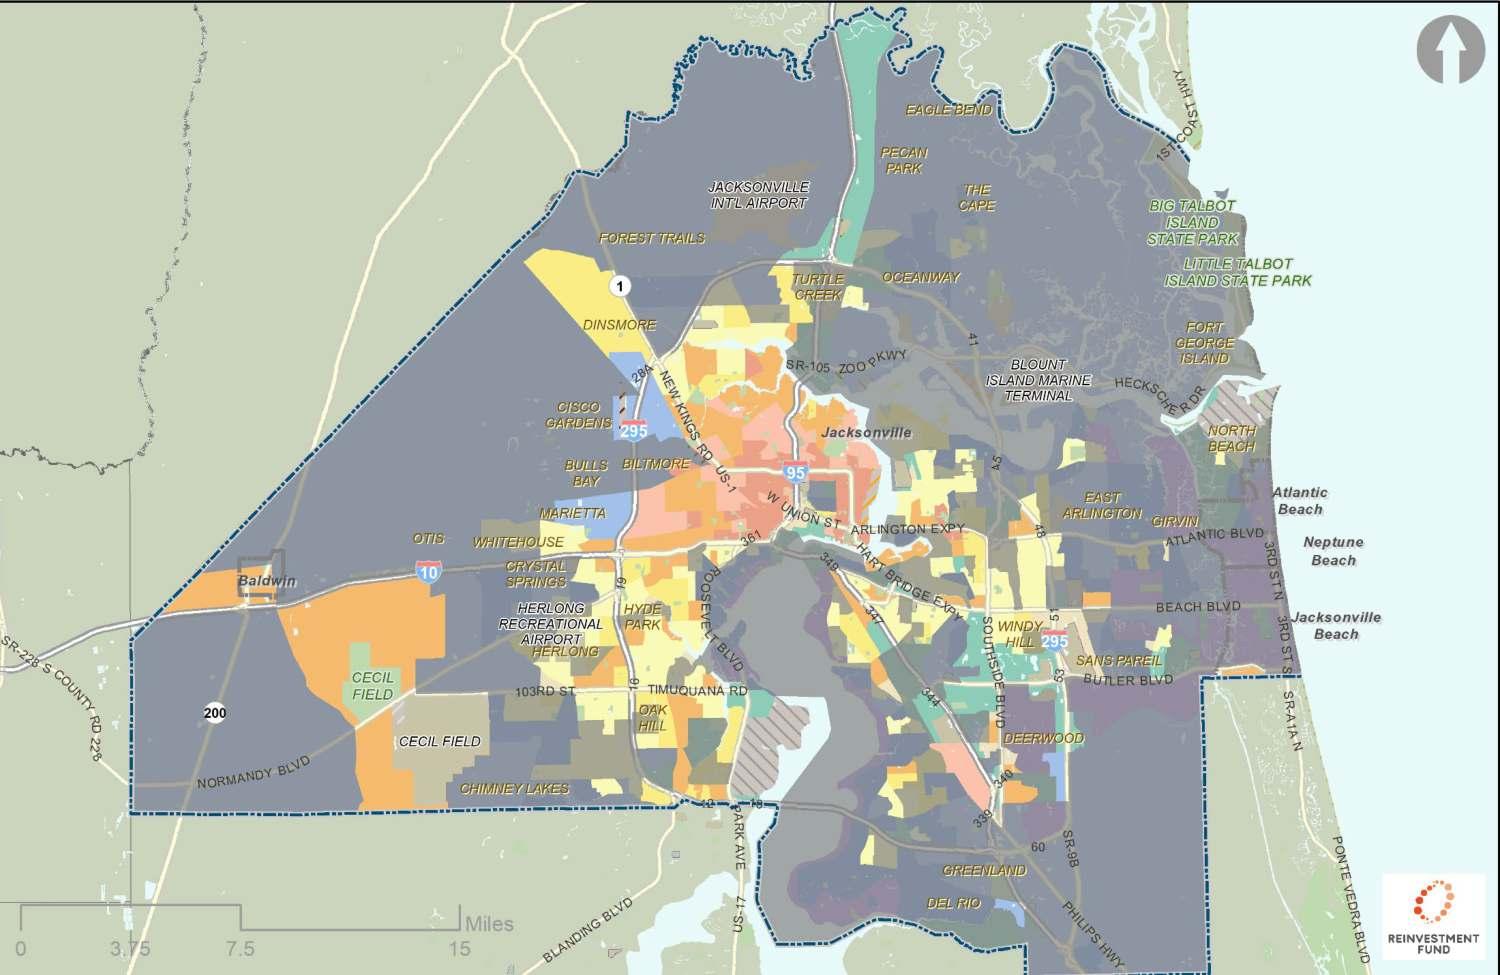
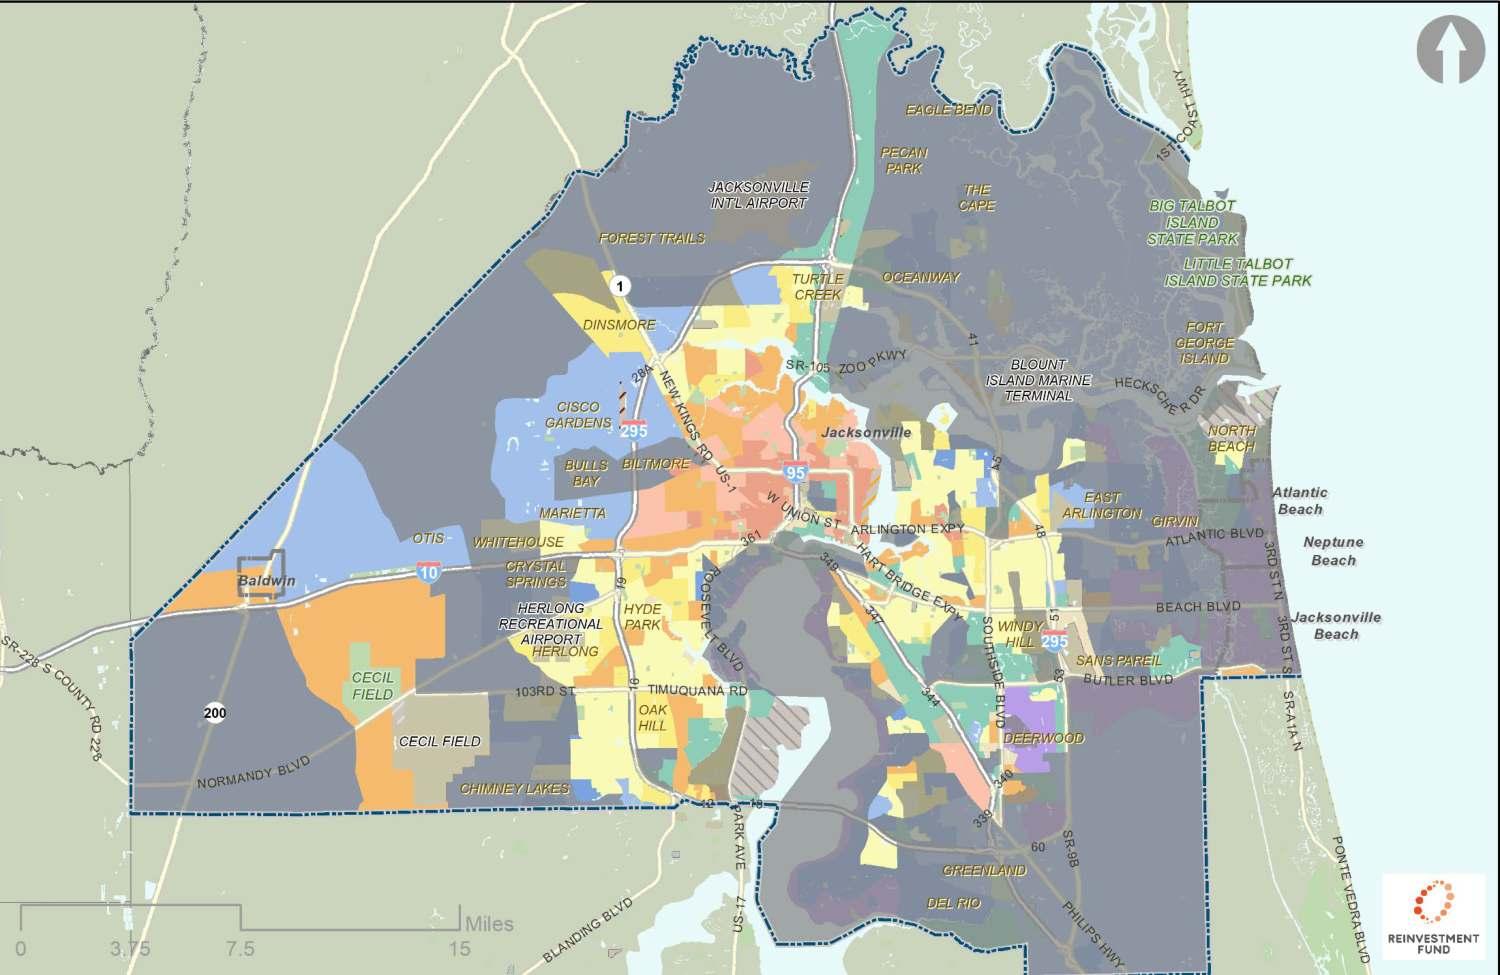
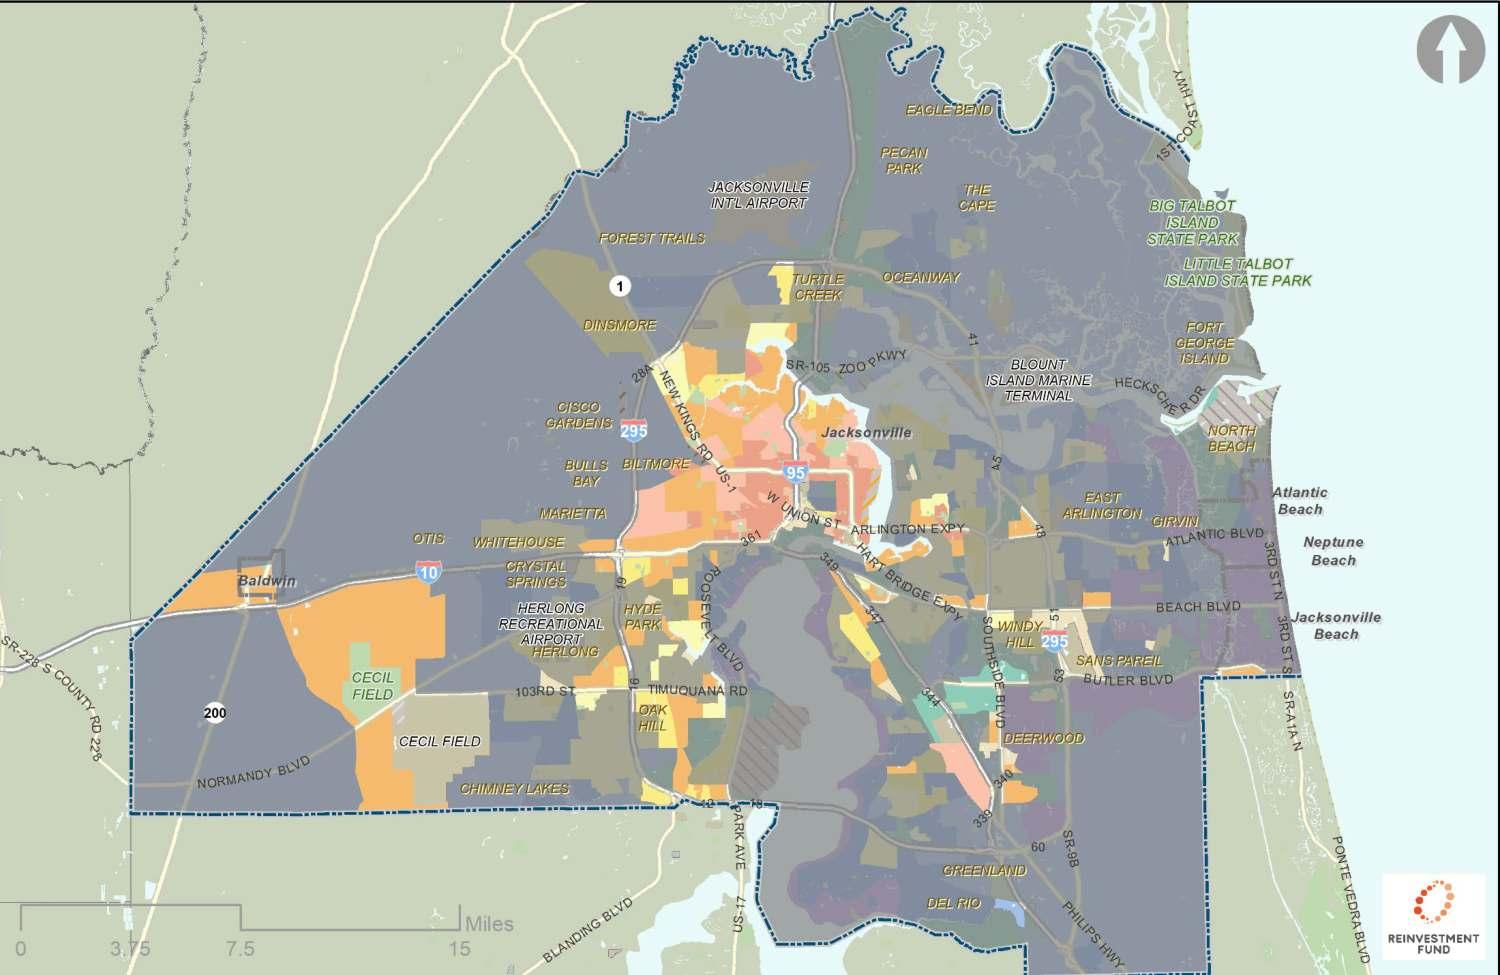
Jacksonville MVA 2022


Jacksonville MVA 2022
Average Characteristics for Jacksonville Market Types
Market Cluster Number of Block Groups Median Sales Price 2020-2021 Variance Sales Price 2020-2021 Water Shutoffs as a Percent of Residential Parcels, 2022 Foreclosure Filings and Bank Registered Vacants as a Percent of Sales, 2020-21 Homestead Exemptions as a Percent of Housing Units, 2021 (Owner Occupied) Publicly Subsidized Rentals as a Percent of Rental Occupied Units Percent Residential Land, 2021 Permits > $5,000 as a Percent of Housing Units A 57$556,0000.580.1%3.3%73.6%7.2%66.4%14.9% B 95$301,0000.330.3%6.0%77.6%2.5%77.2%7.3% C 70$270,0000.410.2%7.9%81.9%3.5%32.2%9.8% D 53$229,0000.370.3%6.2%26.2%8.7%27.4%8.0% E 134$196,0000.350.5%9.0%53.8%6.4%72.8%5.1% F 41$199,0000.350.6%11.0%52.8%73.4%56.8%6.0% G 65$128,0000.471.2%11.6%42.6%11.3%61.6%3.0% H 22$65,0000.623.7%11.0%25.1%76.9%37.8%2.6% I 31$58,0000.676.2%10.0%24.9%17.5%57.8%2.7% All Block groups 568$242,000 0.420.9%8.1%56.6%14.4%59.1%6.9%
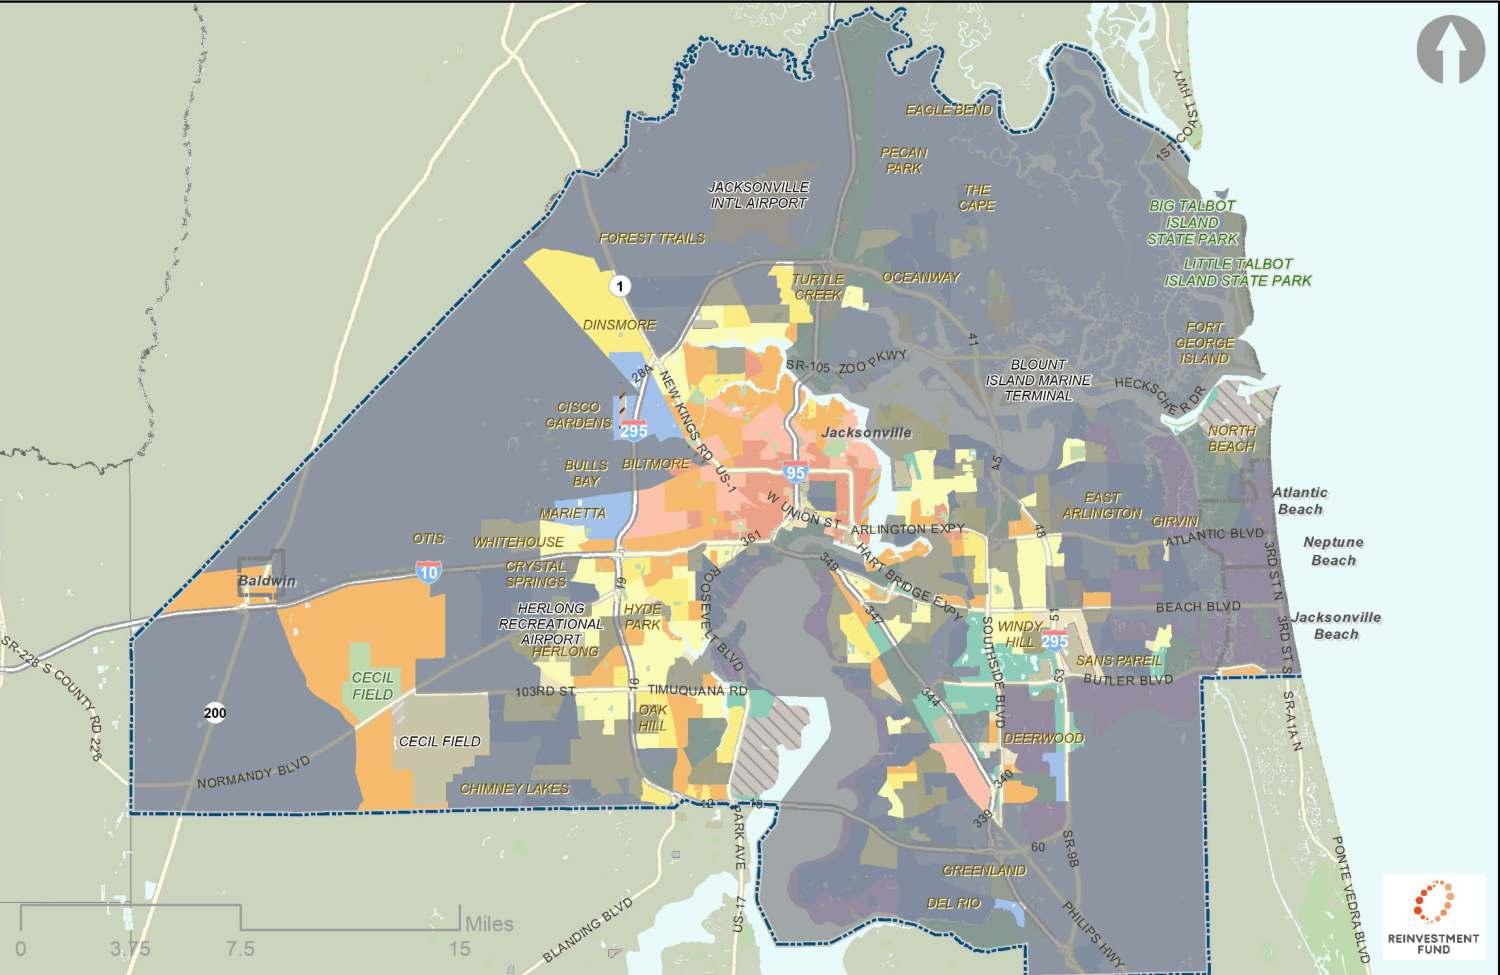
Jacksonville MVA 2022
Jacksonville MVA 2022
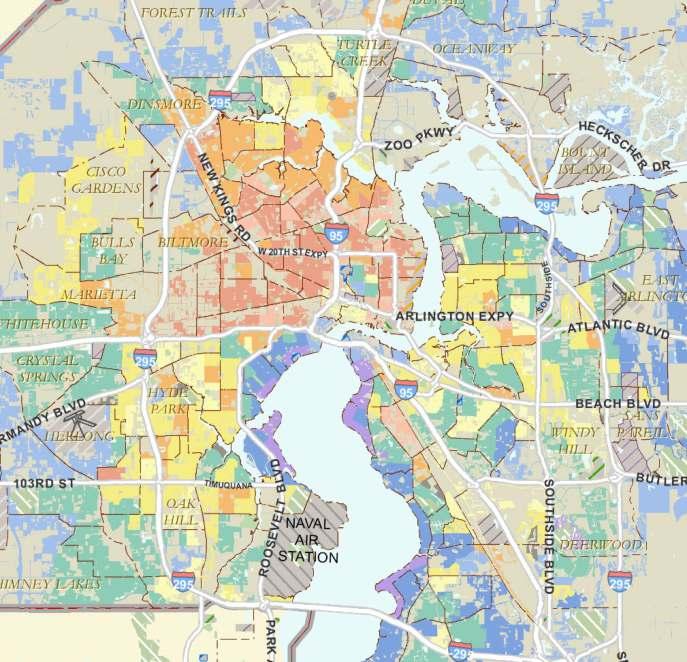
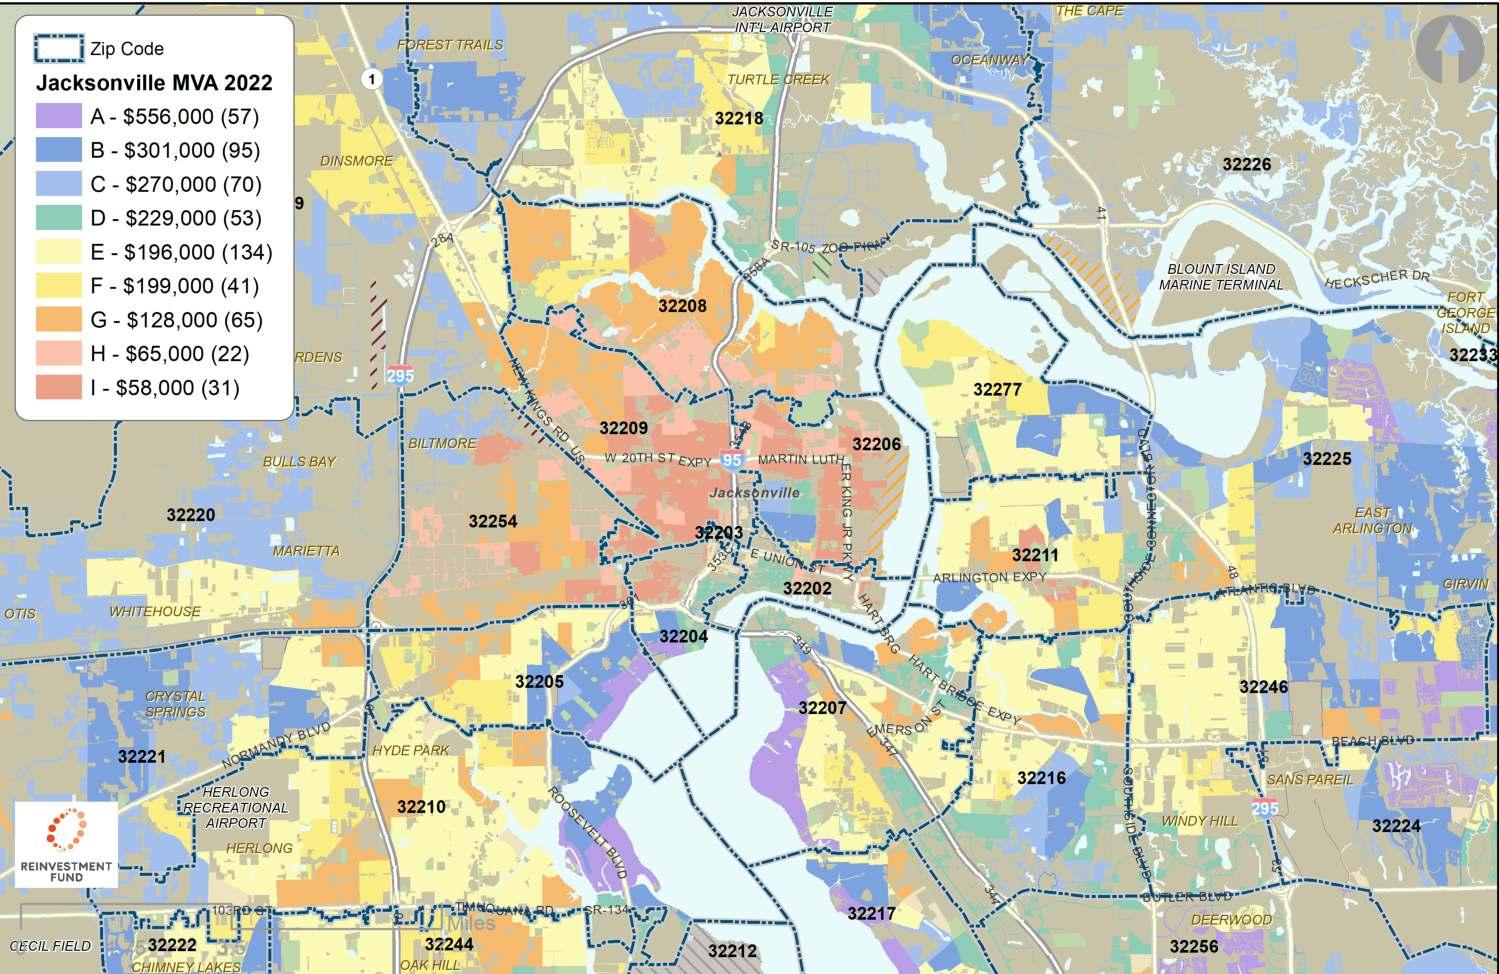
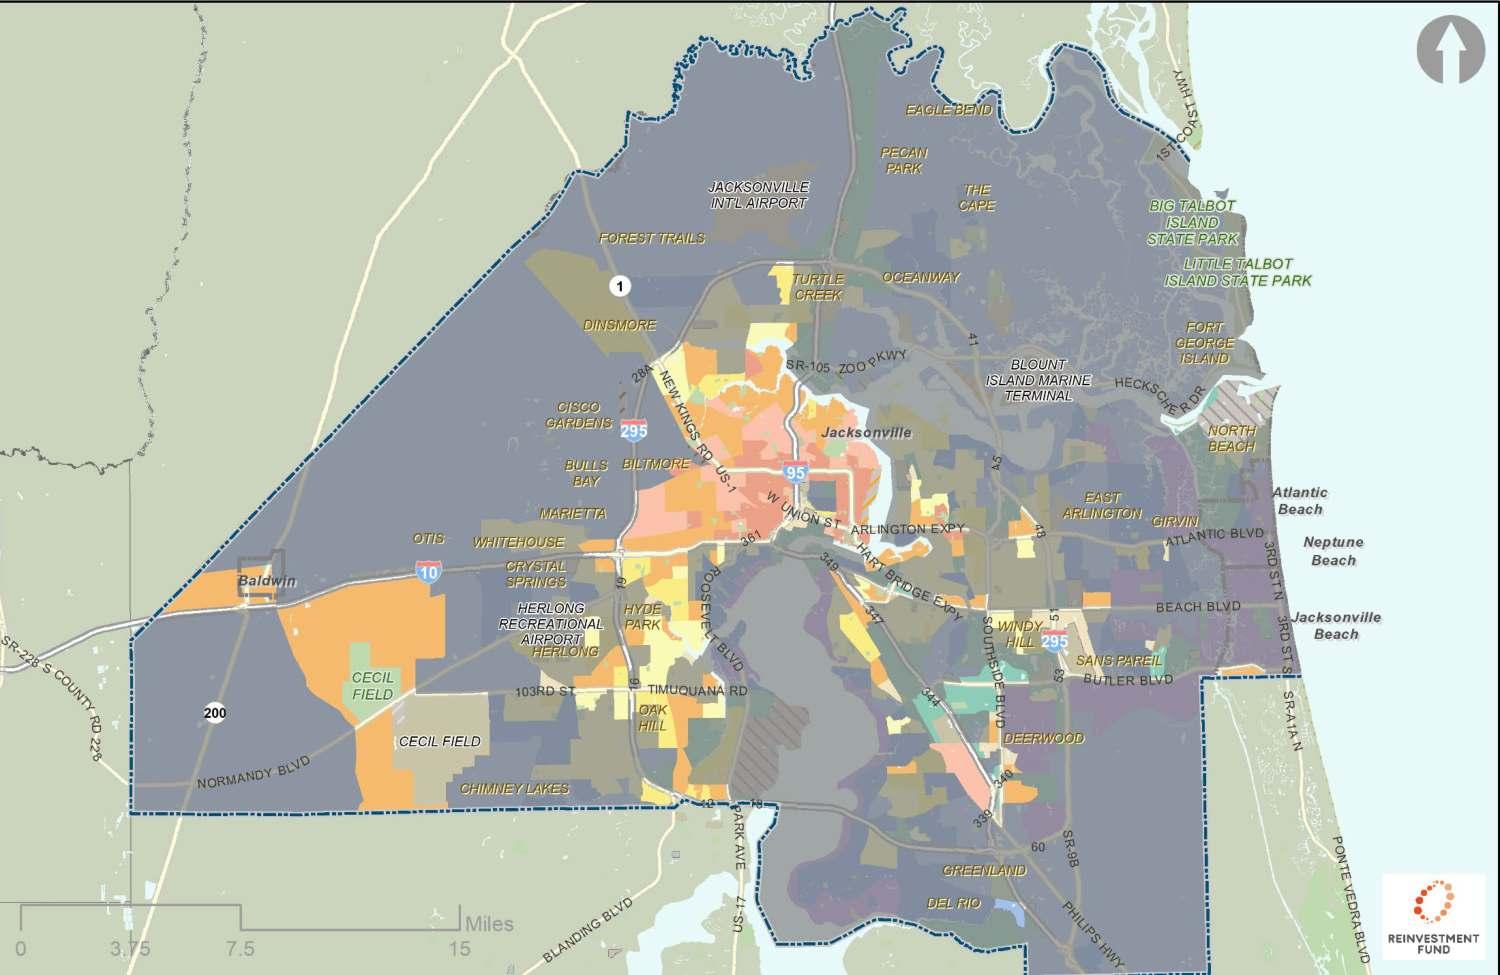
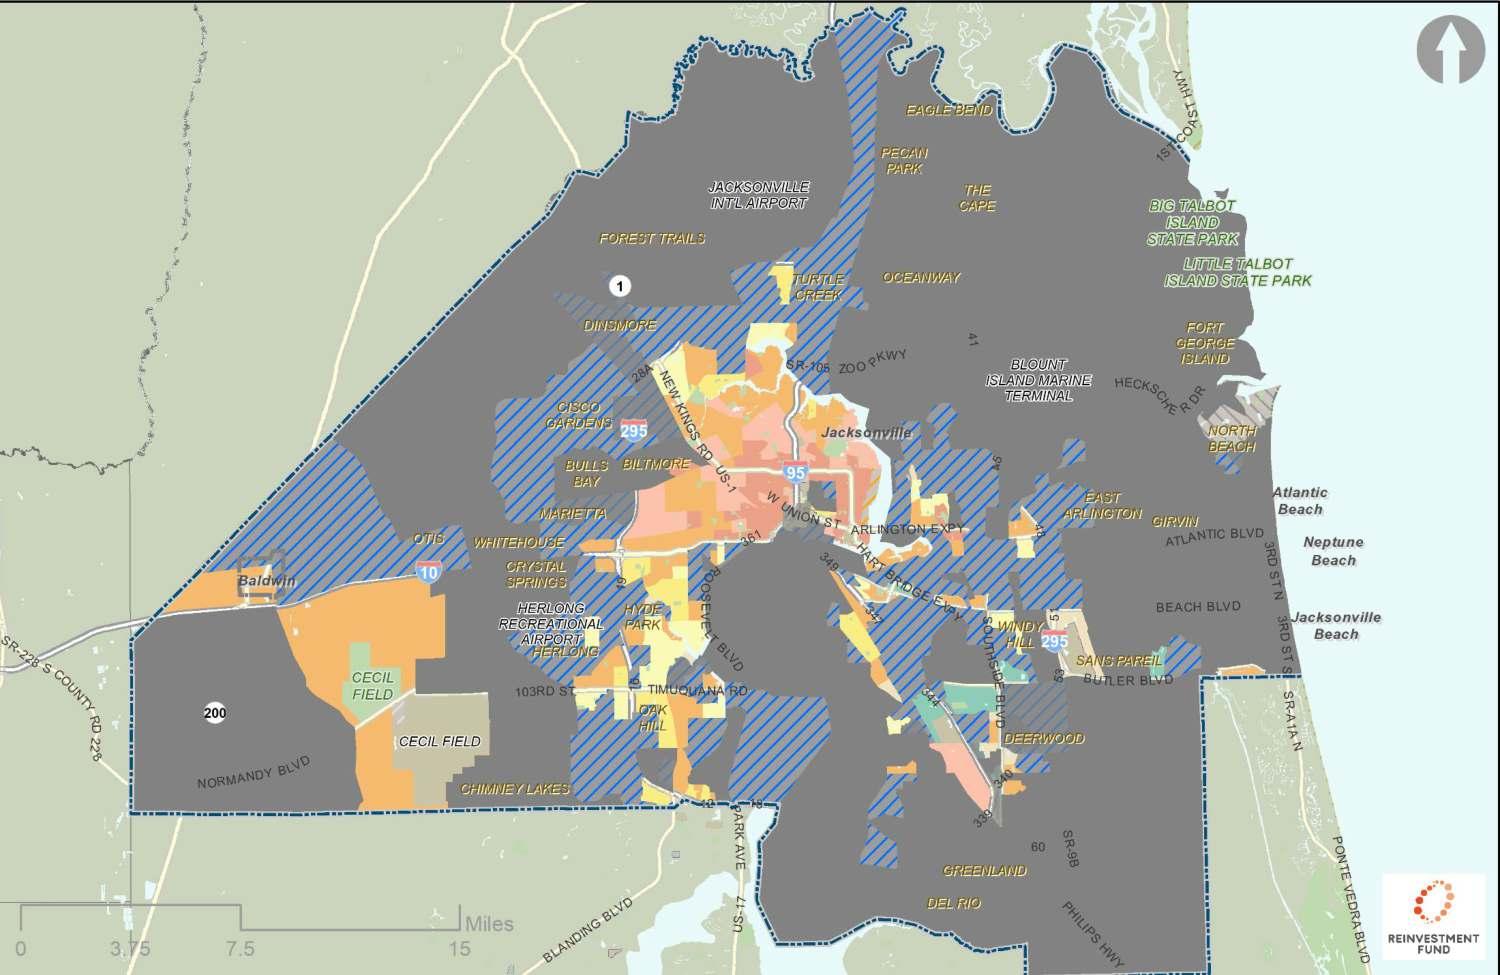
Jacksonville MVA 2022 with Zip Code Overlay
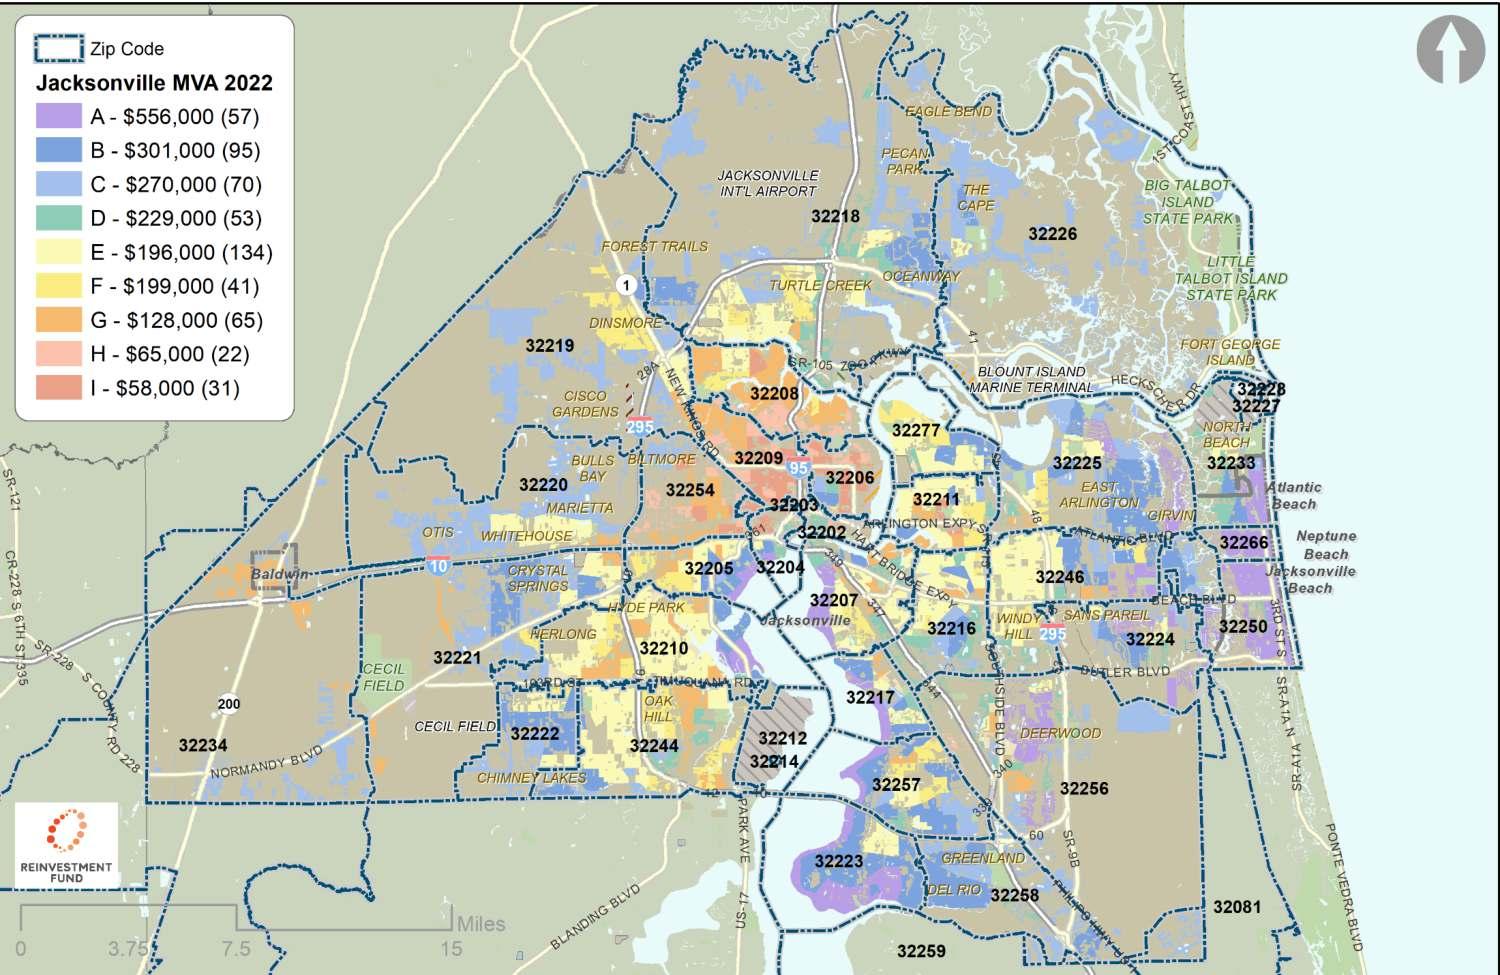
Jacksonville MVA 2022 with Zip Code Overlay
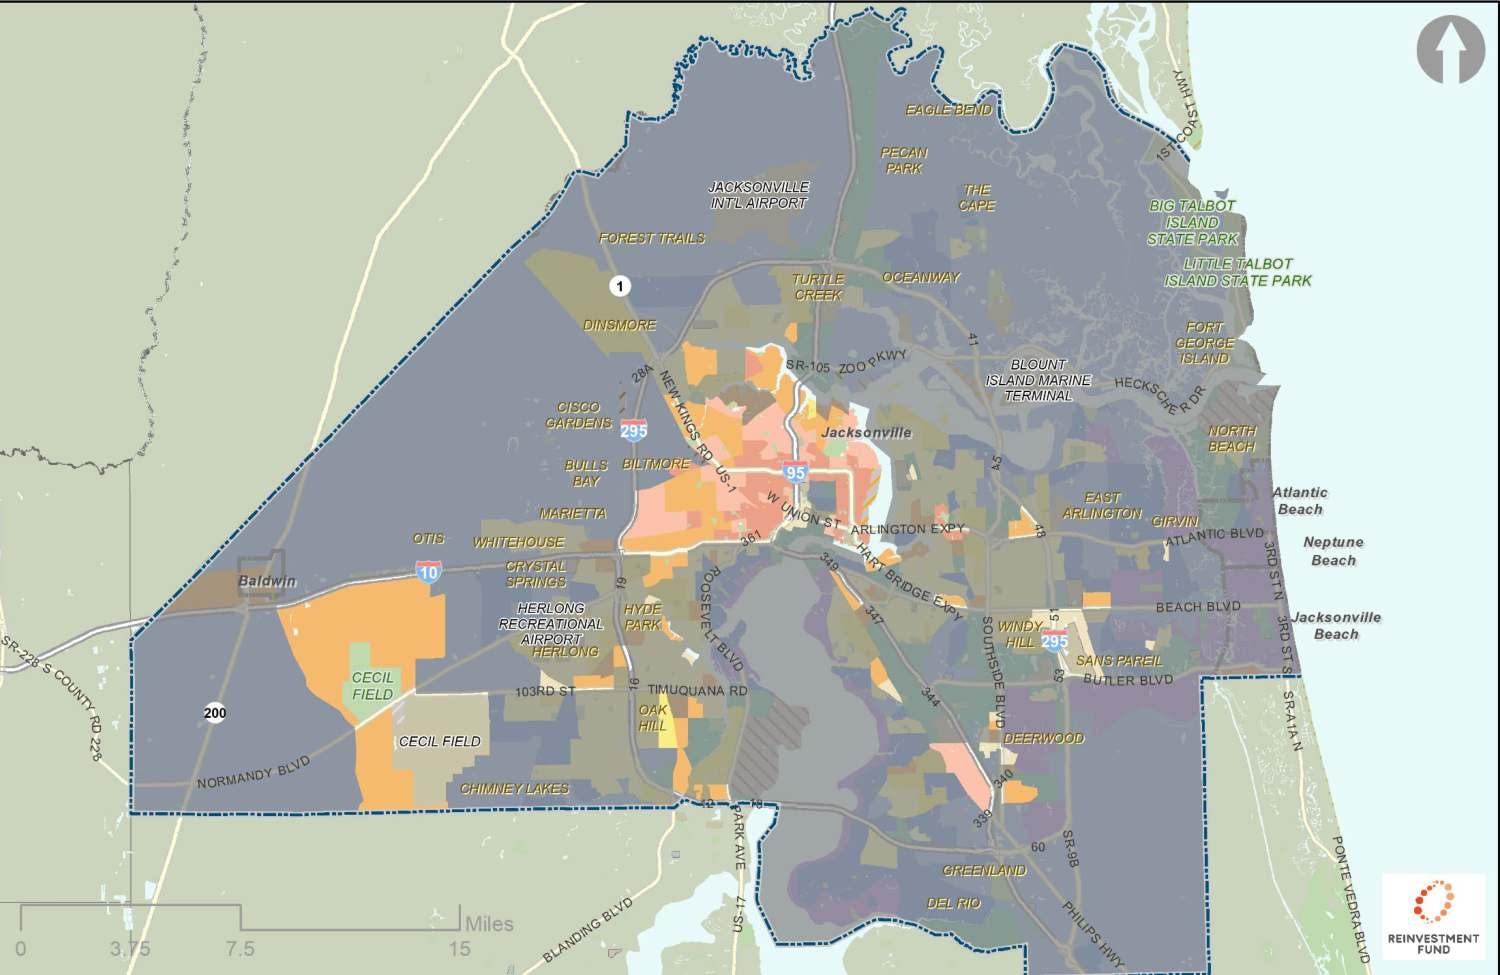
Purple and Blue Markets
•
•
•
•
Block Groups Median Sales Price Variance Sales Price Water Shutoffs (Vacancy) Foreclosure Filings & Bank Registered Vacants Homestead Exemptions (Owner Occupancy) Publicly Subsidized Rentals Residential Land Area Permits > $5,000 A 57$556,0000.580.1%3.3%73.6%7.2%66.4%14.9% B 95$301,0000.330.3%6.0%77.6%2.5%77.2%7.3% C 70$270,0000.410.2%7.9%81.9%3.5%32.2%9.8% Regional Block Group Average $242,000 0.420.9%8.1%56.6%14.4%59.1%6.9%
Blue
Characteristics of Purple and
Markets
Highest priced markets
Mostly owner occupied
High level of permitting
levels of vacancy and foreclosure
• Low
B
Land Use, C
markets have mostly Residential
have a mix of uses
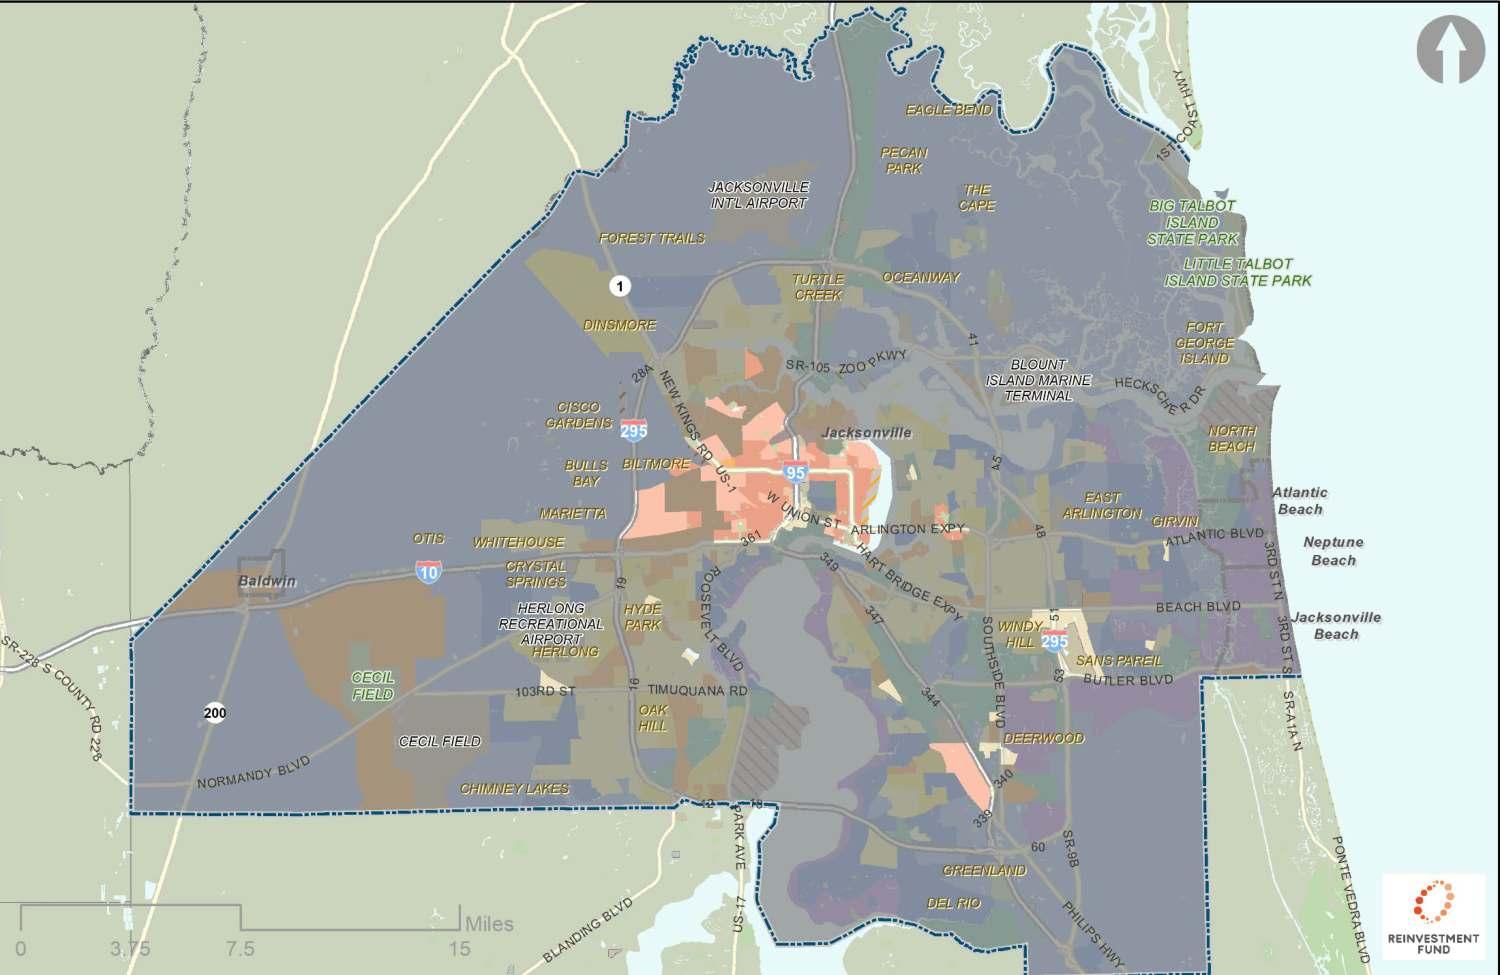
Green and Yellow Markets
Characteristics of Green and Yellow Markets
• Sales prices are just below average
• D markets are mostly renter occupied
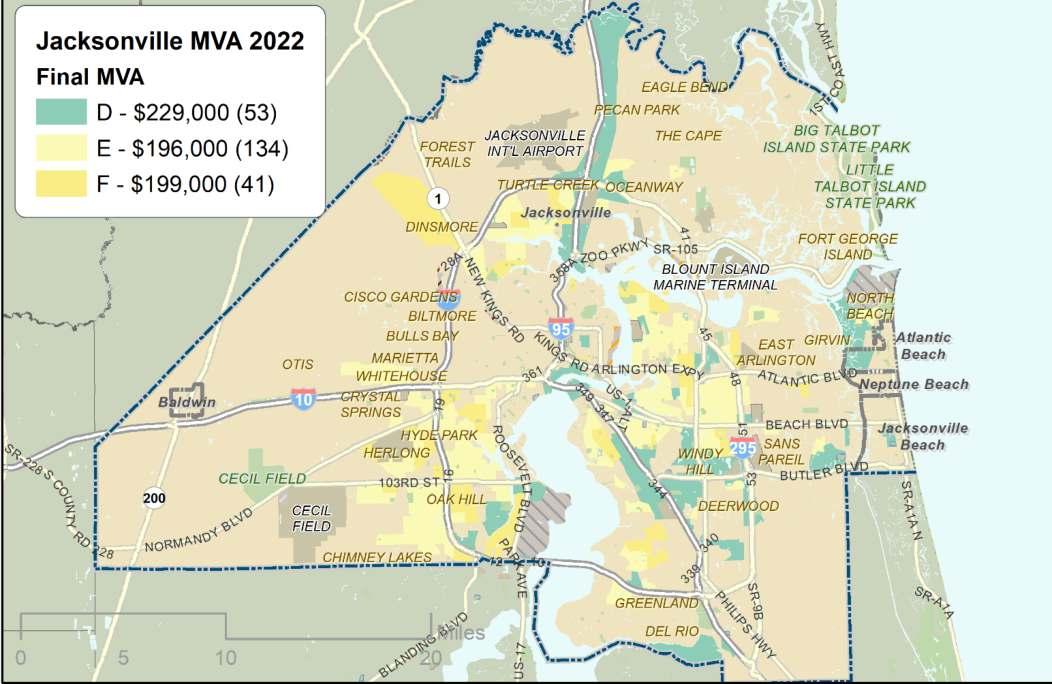
• E markets have typical values in most measures
• F markets have high levels of rental subsidy
Block Groups Median Sales Price Variance Sales Price Water Shutoffs (Vacancy) Foreclosure Filings & Bank Registered Vacants Homestead Exemptions (Owner Occupancy) Publicly Subsidized Rentals Residential Land Area Permits > $5,000 D 53$229,0000.370.3%6.2%26.2%8.7%27.4%8.0% E 134$196,0000.350.5%9.0%53.8%6.4%72.8%5.1% F 41$199,0000.350.6%11.0%52.8%73.4%56.8%6.0% Regional Block Group Average $242,000 0.420.9%8.1%56.6%14.4%59.1%6.9%
Orange and Salmon Markets
Characteristics of Orange and Salmon Markets
• Lowest priced markets
• Higher than average levels of vacancy and foreclosure
• H and I markets are mostly renter occupied
• H and I markets have widest variation in sales prices
• Low levels of permitting
• Most renters in H markets are subsidized
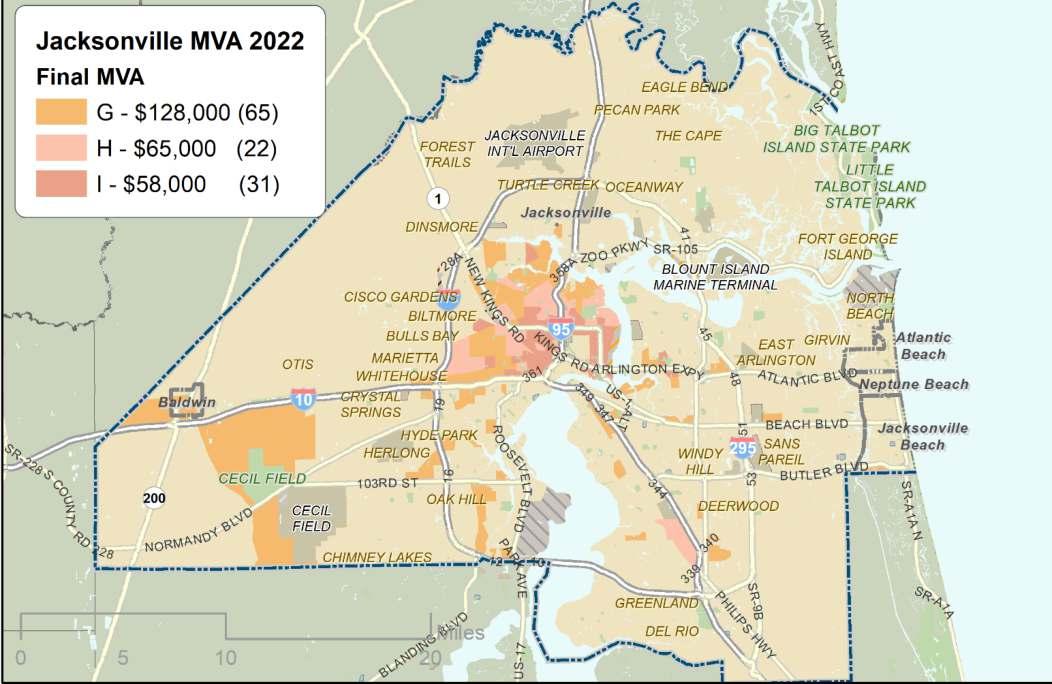
Block Groups Median Sales Price Variance Sales Price Water Shutoffs (Vacancy) Foreclosure Filings & Bank Registered Vacants Homestead Exemptions (Owner Occupancy) Publicly Subsidized Rentals Residential Land Area Permits > $5,000 G 65$128,0000.471.2%11.6%42.6%11.3%61.6%3.0% H 22$65,0000.623.7%11.0%25.1%76.9%37.8%2.6% I 31$58,0000.676.2%10.0%24.9%17.5%57.8%2.7% Regional Block Group Average $242,000 0.420.9%8.1%56.6%14.4%59.1%6.9%
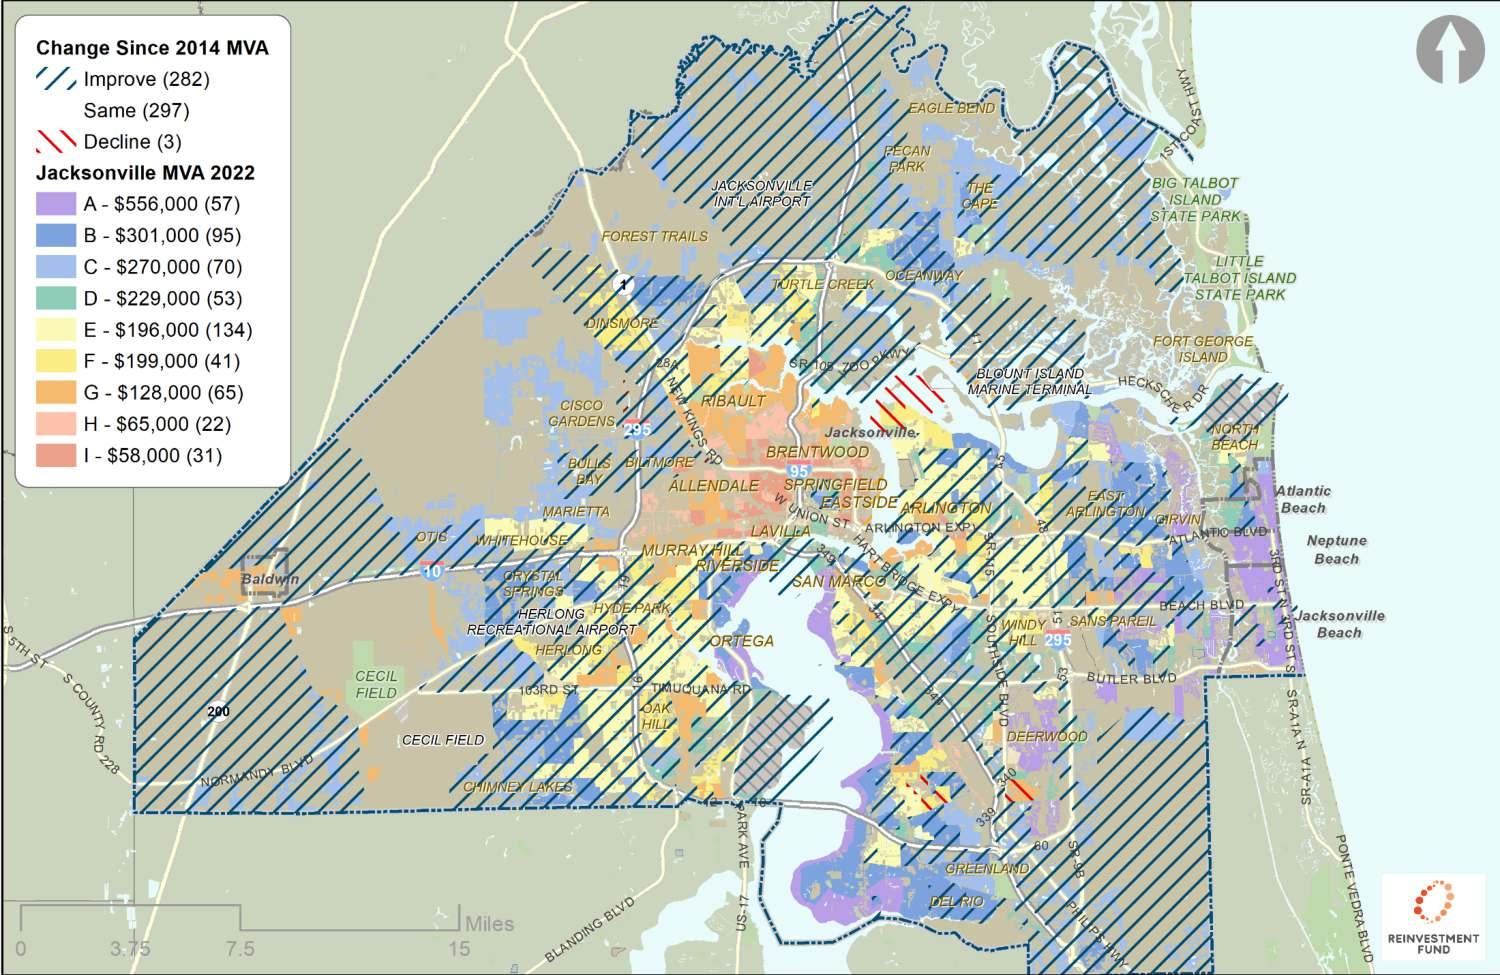
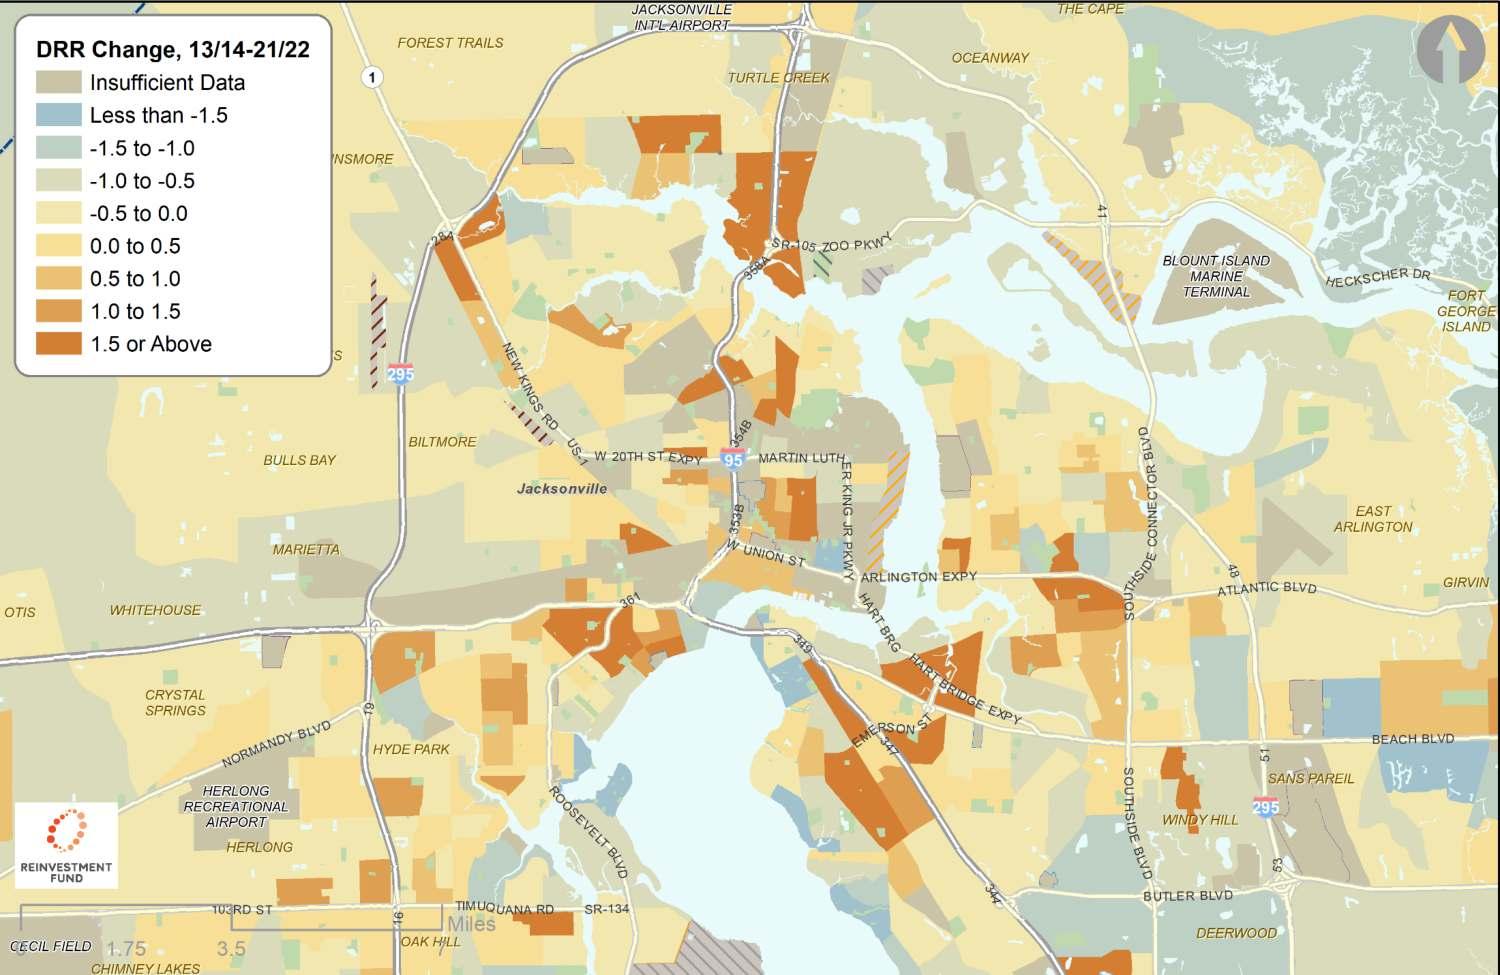
Changes in MVA Data


Change Since Previous MVA
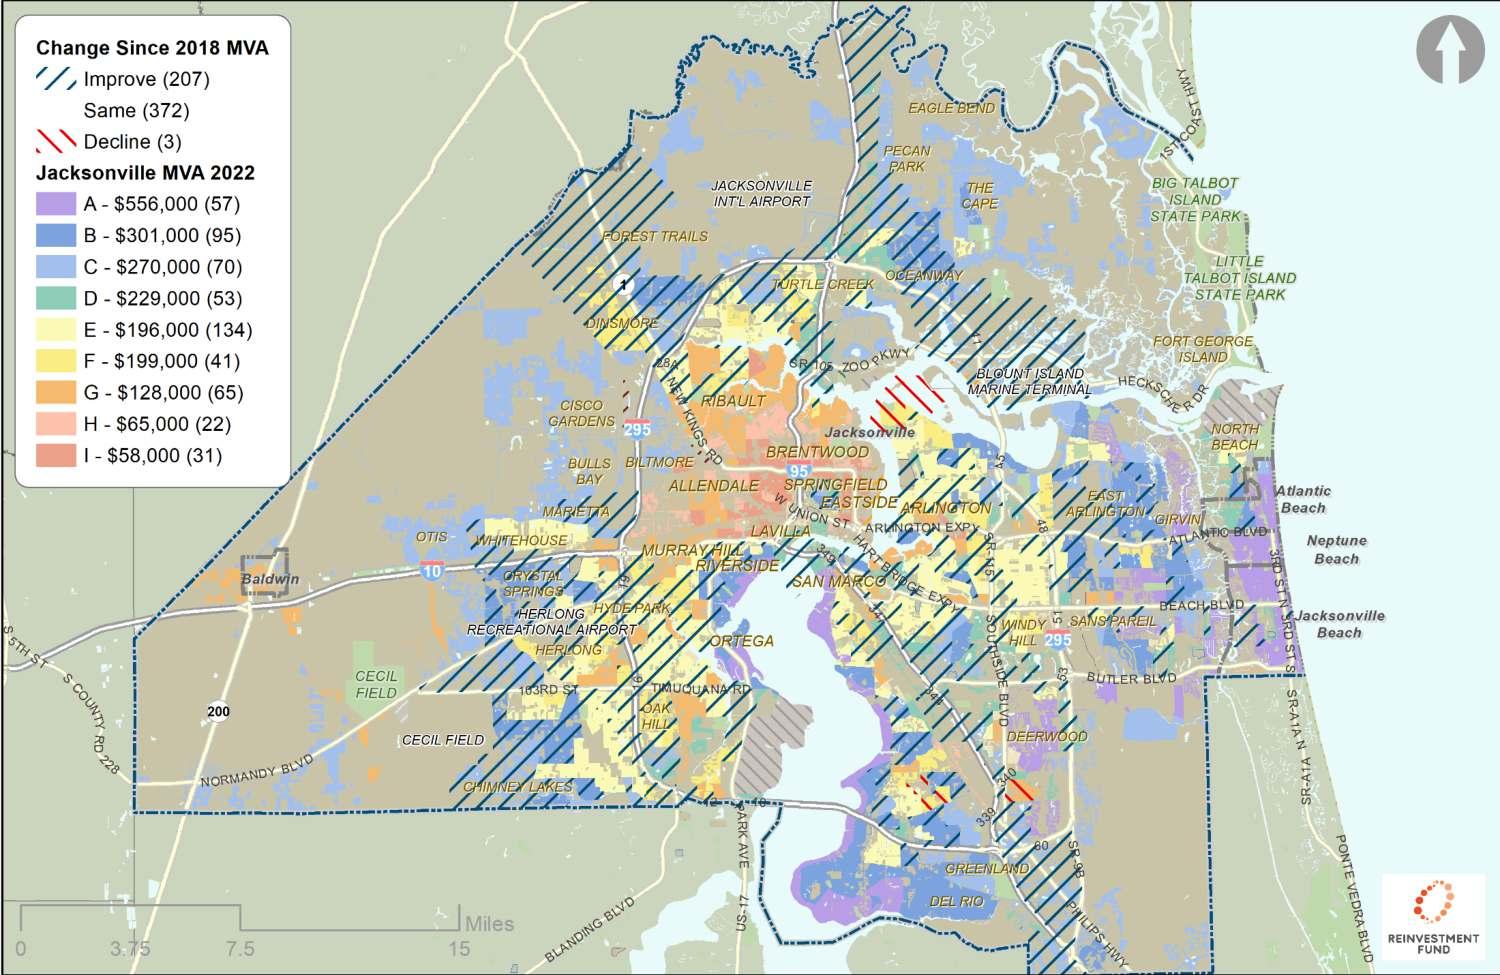
Change Since First MVA
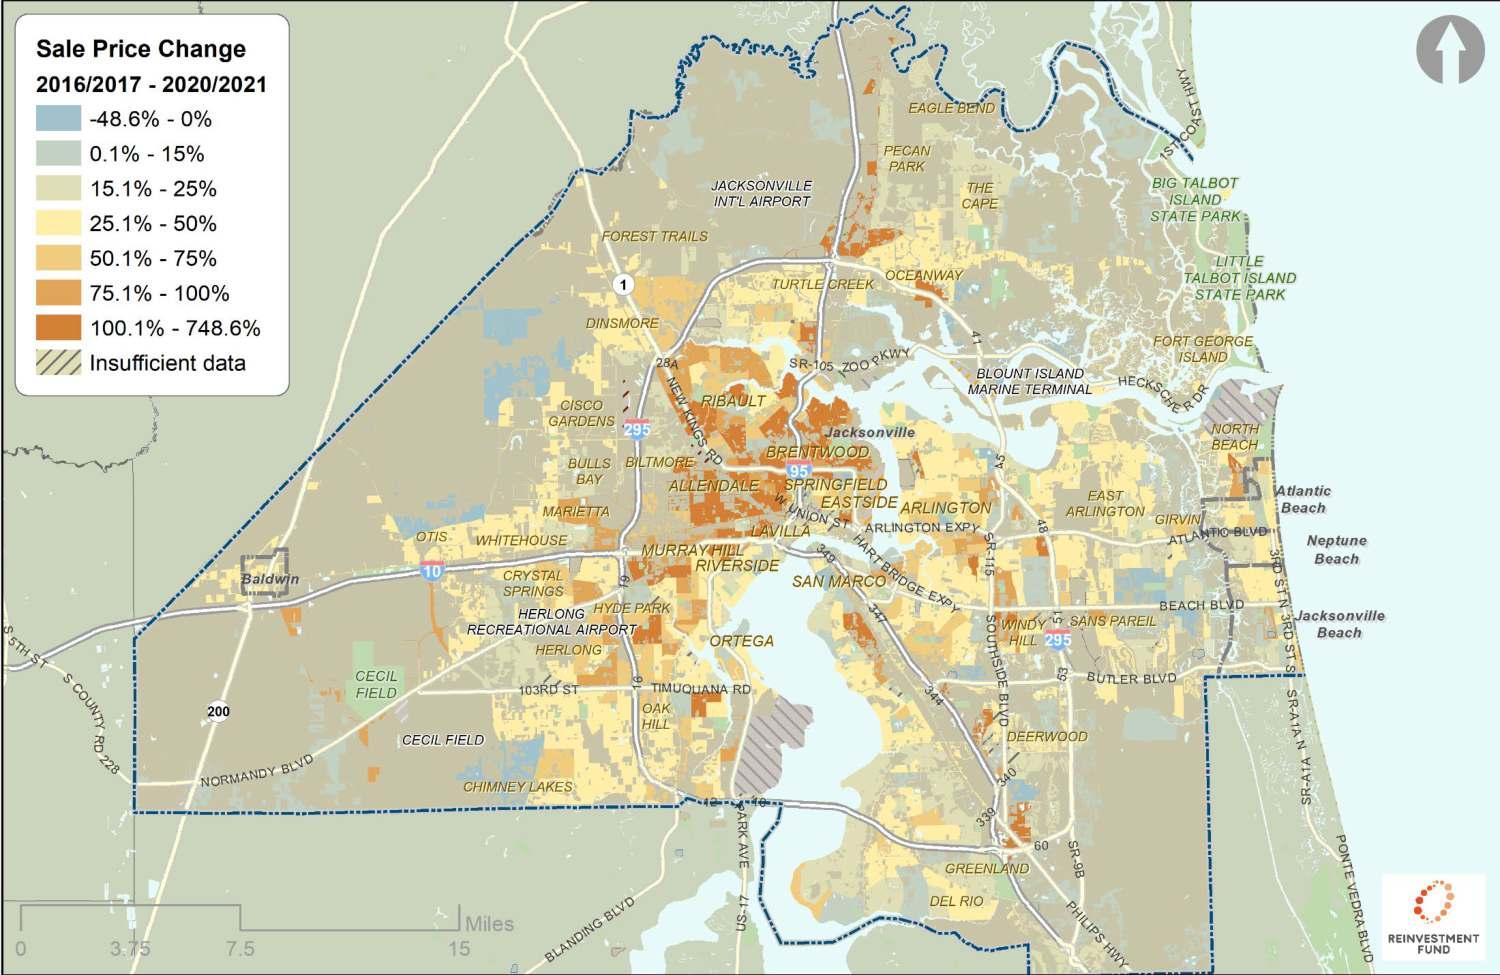
Sale Price Change Since Previous MVA
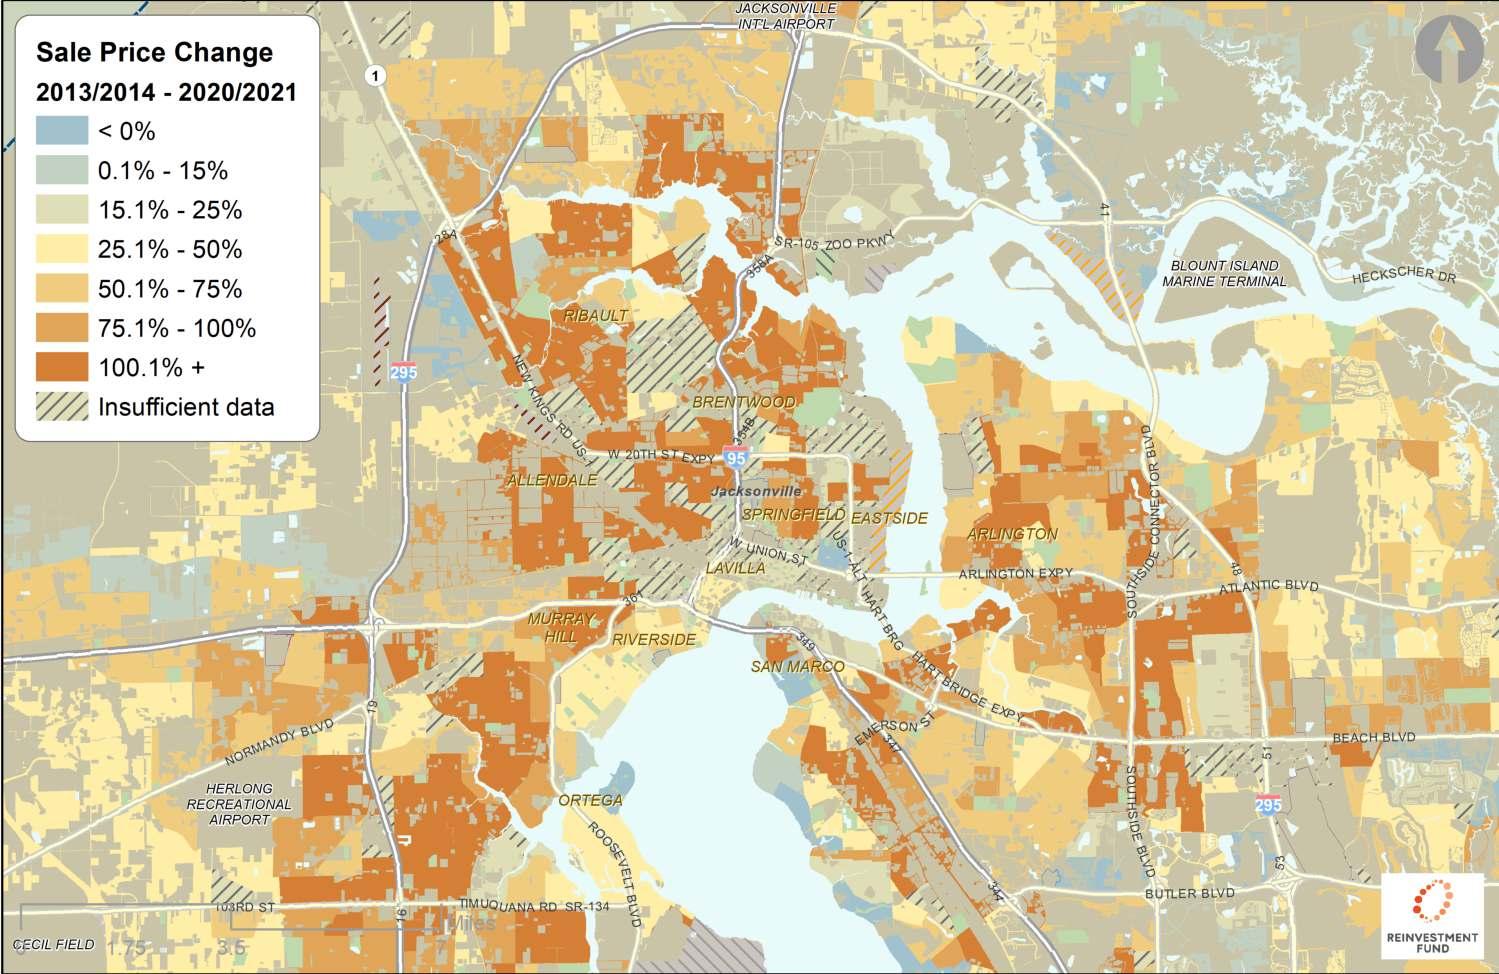
Sale Price Change Since First MVA
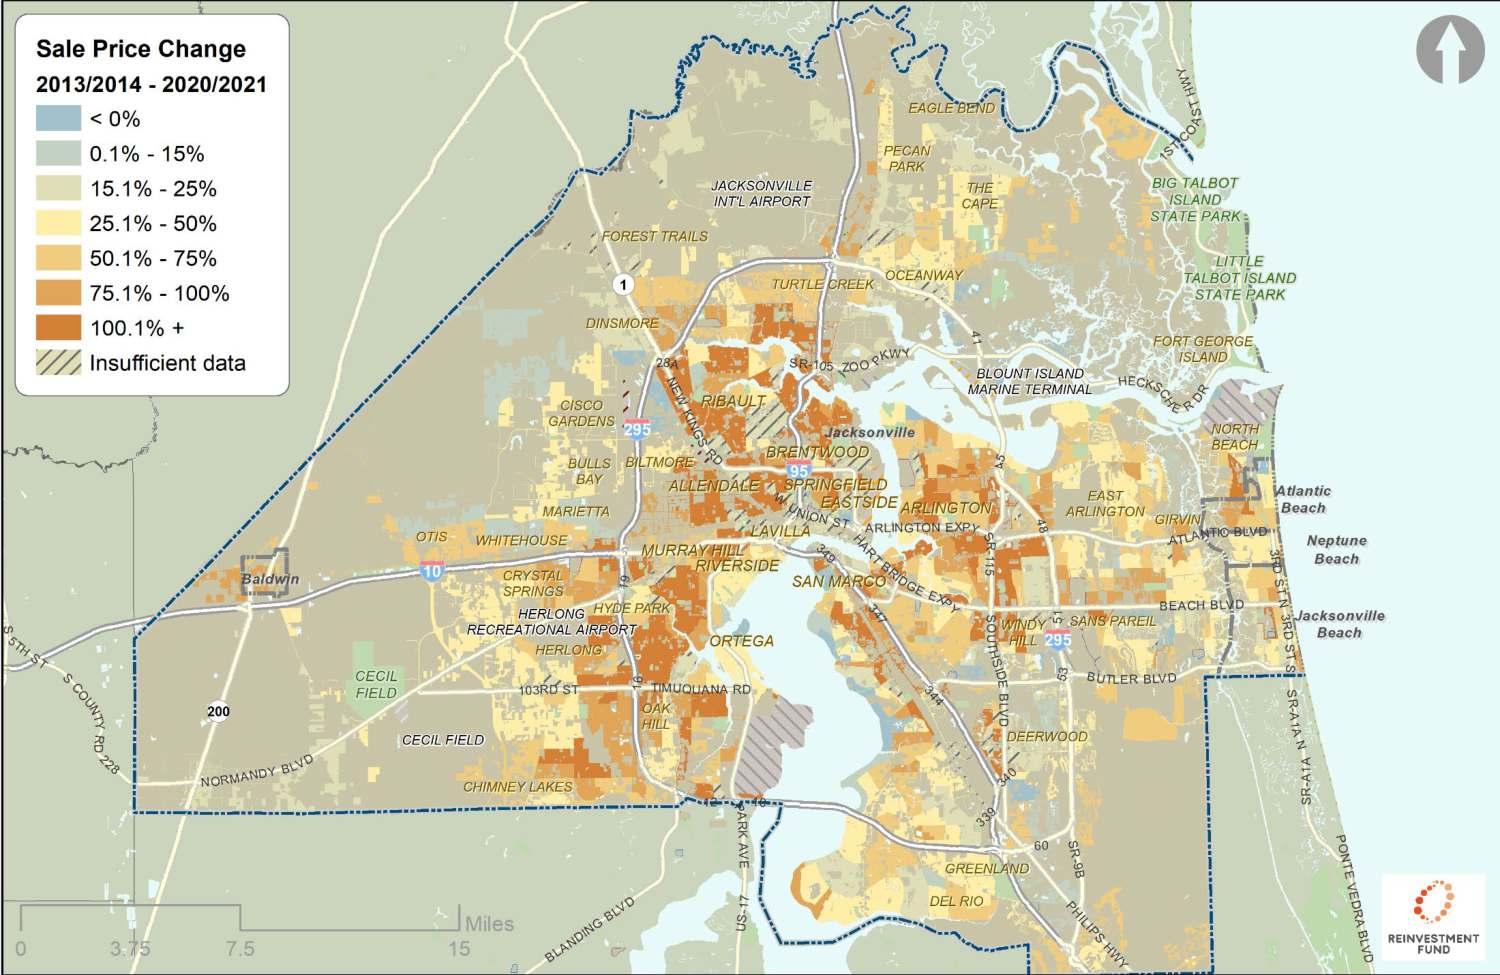
Sale Price Change Since First MVA
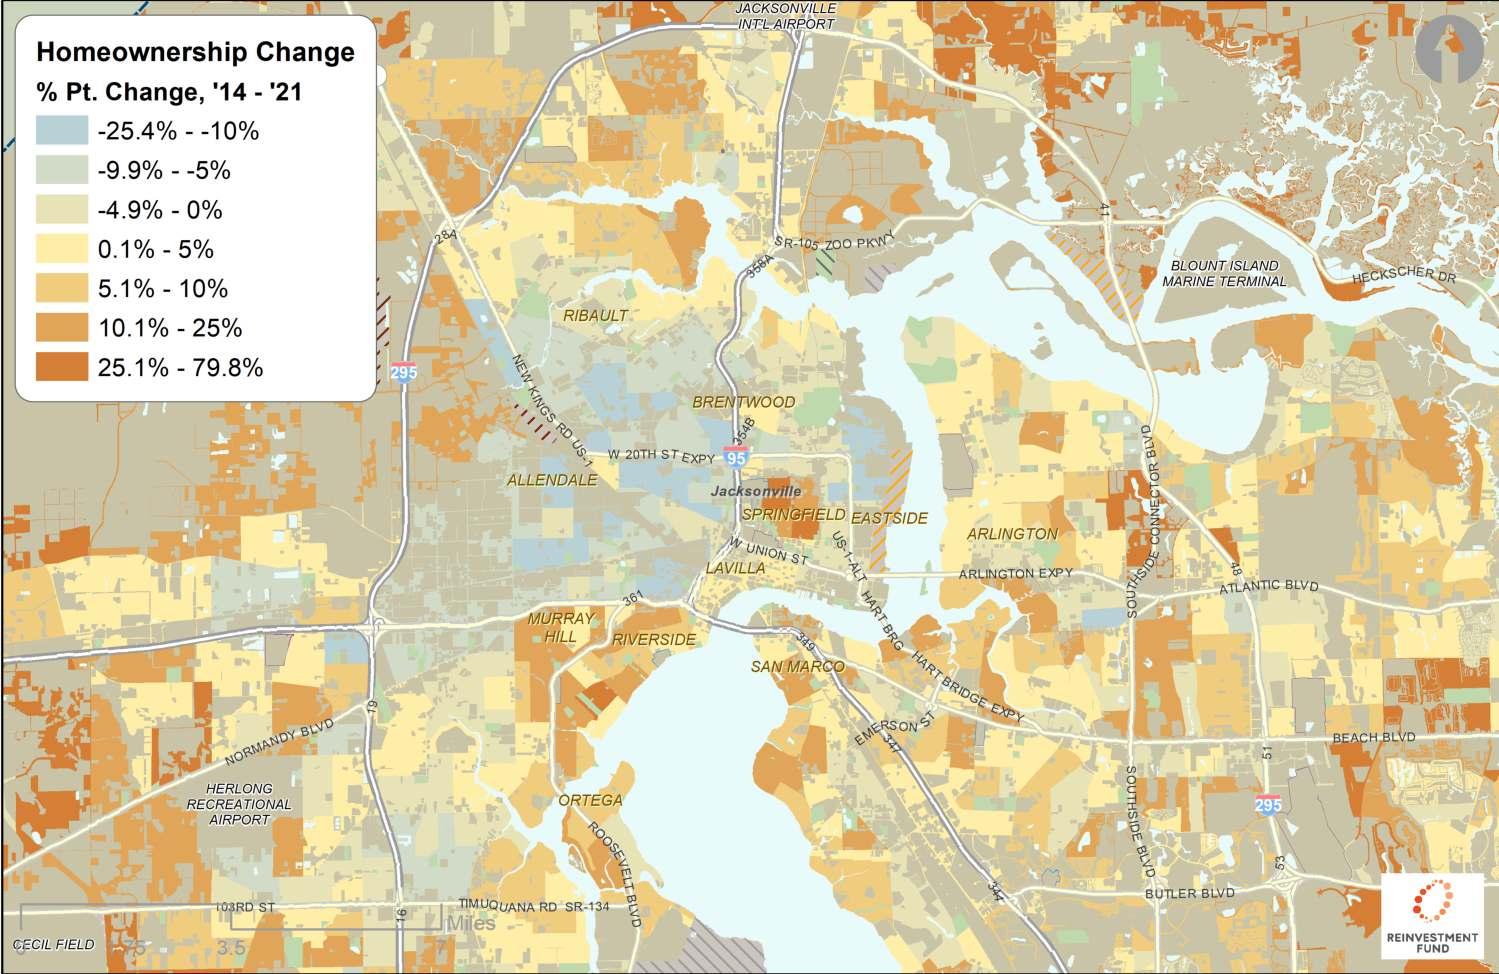
Homeownership Change Since First MVA
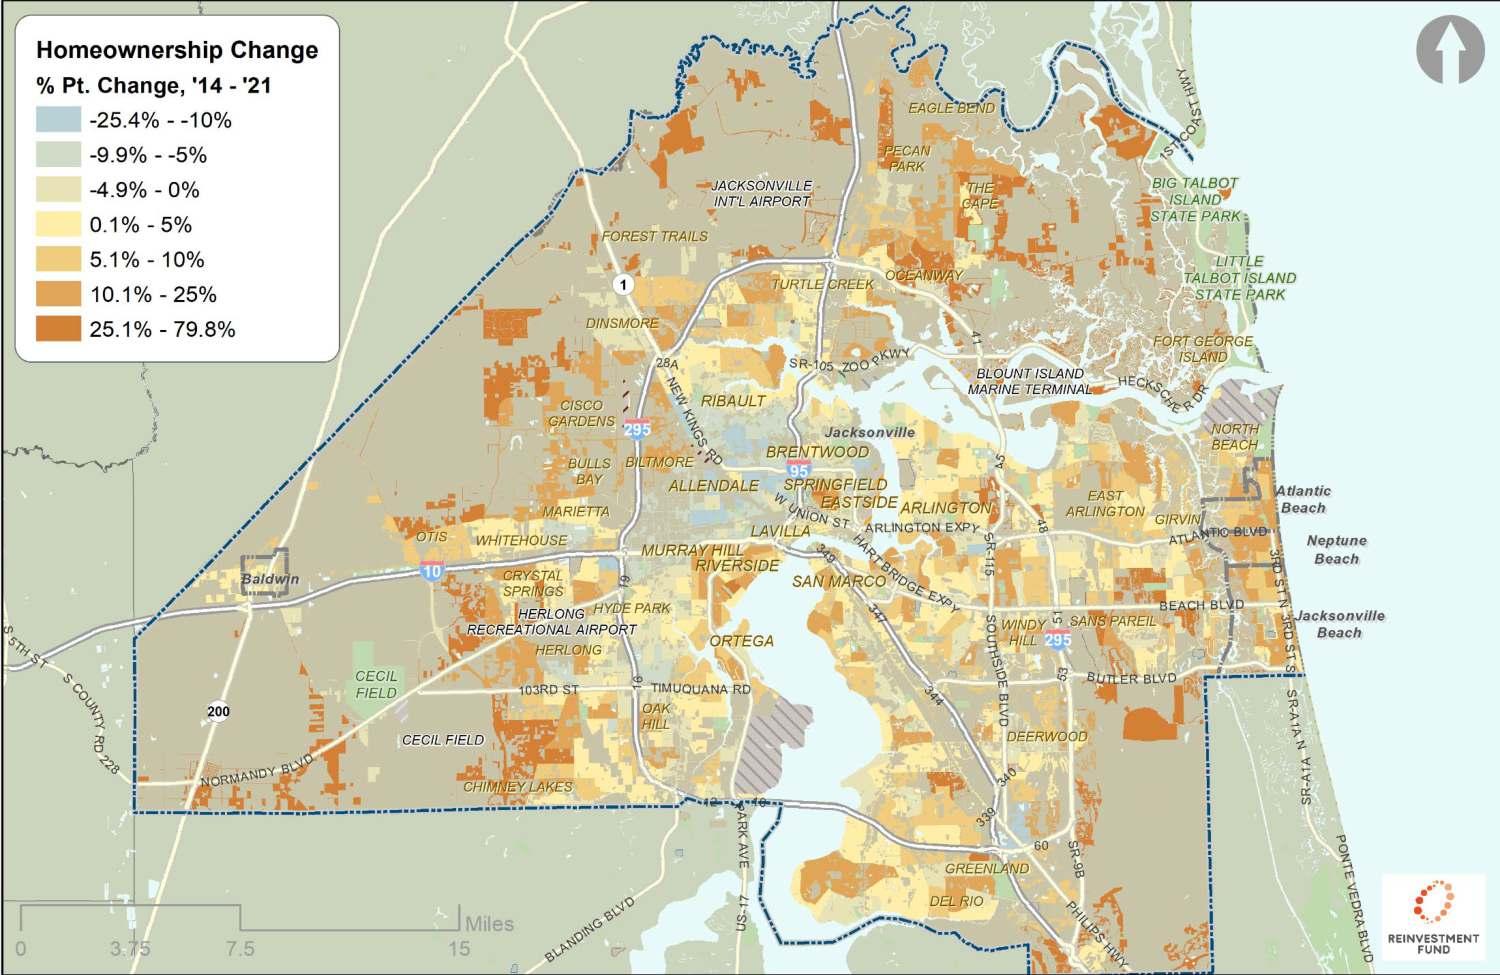
Homeownership Change Since First MVA
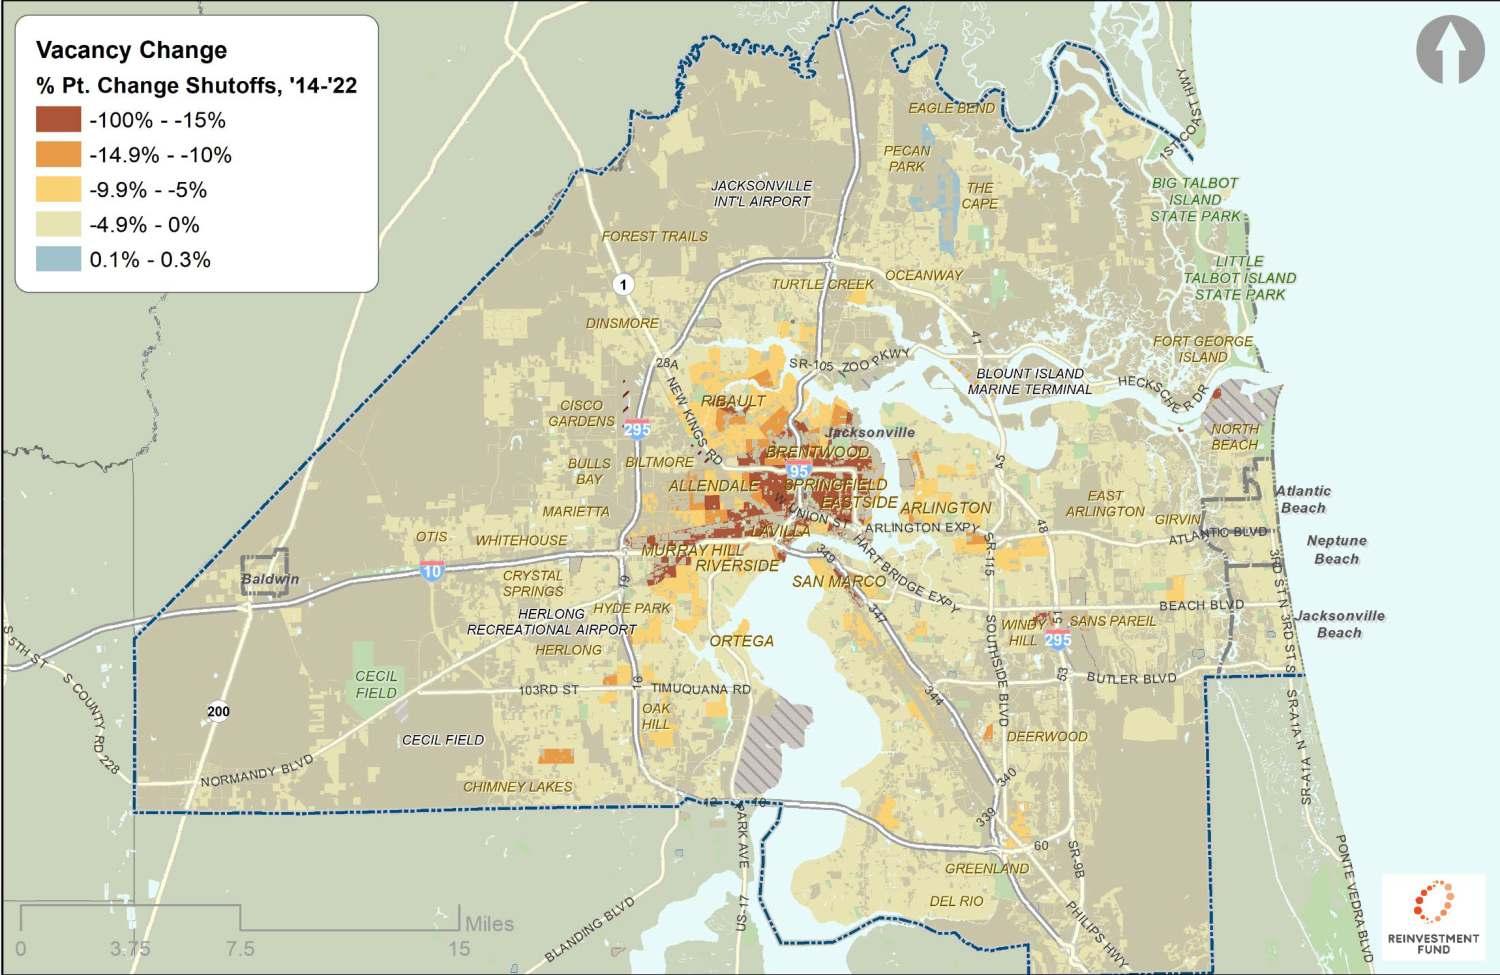
Vacancy Change Since First MVA
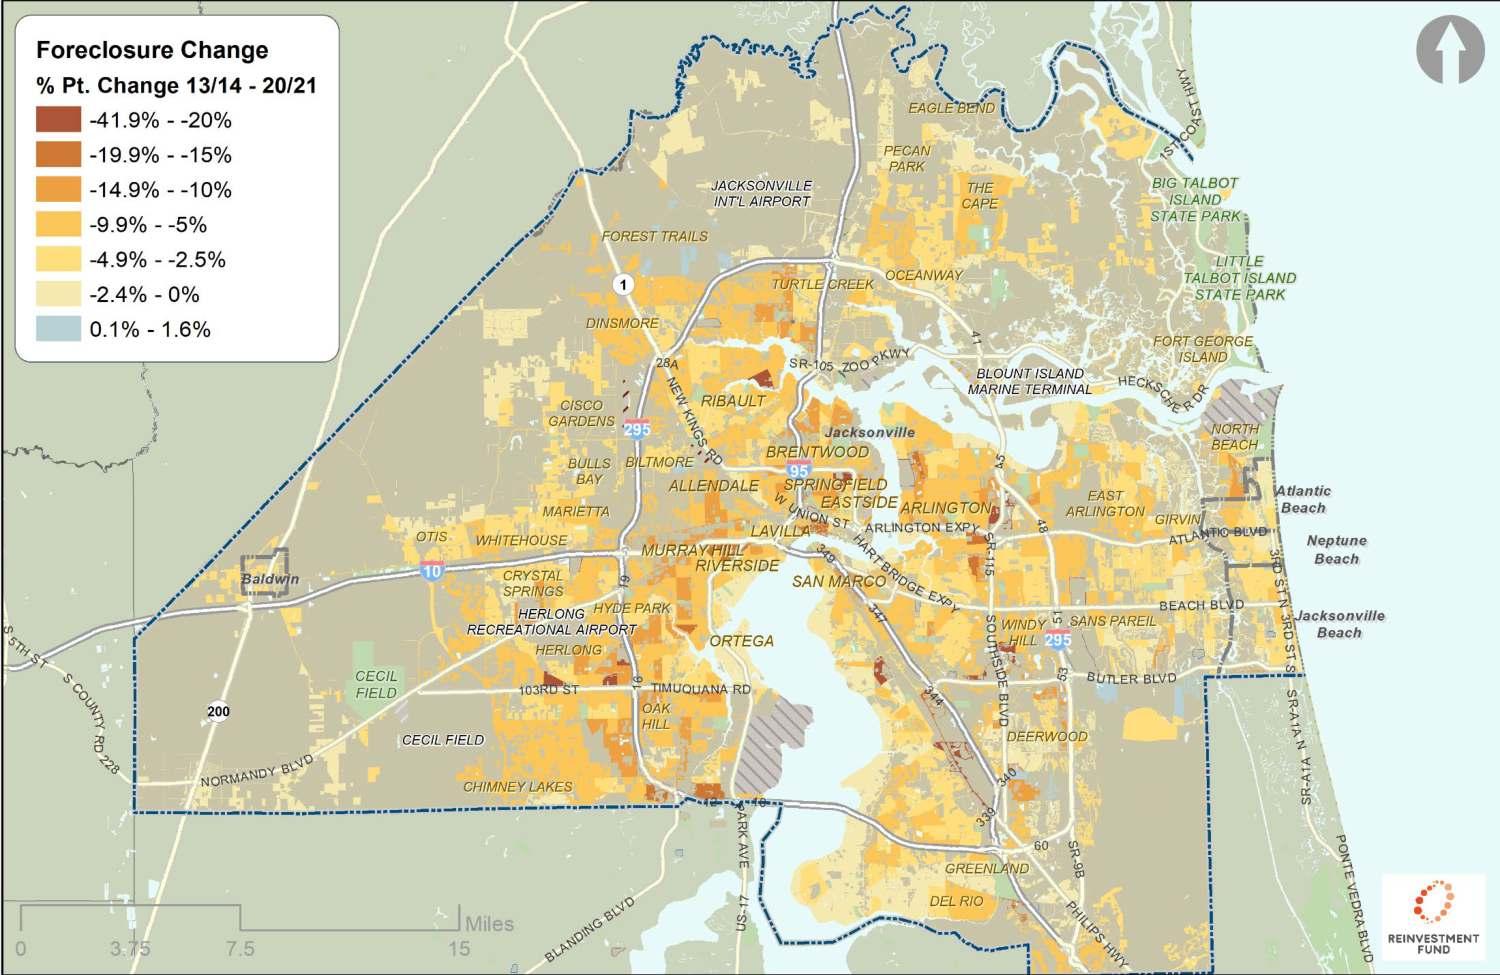
Foreclosure (as % of Sales) Change Since First MVA
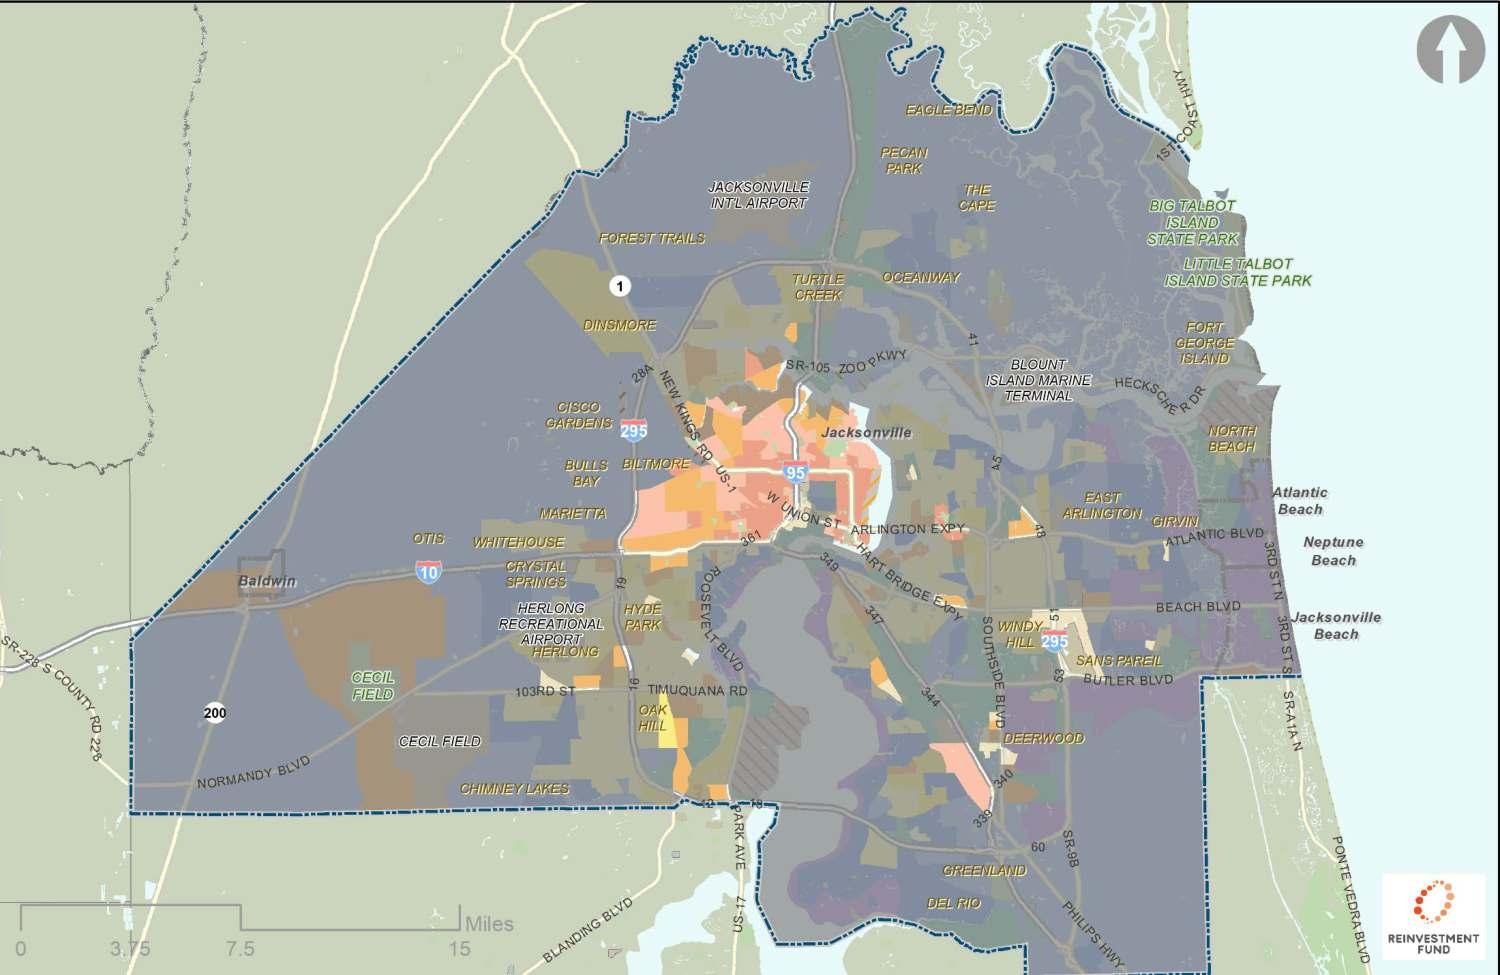
Final 2022 MVA Compared to 2018 MVA
Largest Sale Price
Increases in G – I markets
Investment was strongest in A, B,
markets
Distress also decreased in G – I markets
Increased generally, but not in H and I markets
E
Homeownership
2018 MVA Sale Price (Avg. % Change) Permits (Avg. % Pt. Change) Water Shutoffs (Avg. % Pt. Change) Foreclosures (Avg. % Pt. Change) Homeownership (Avg. % Pt. Change) A 29.9%10.2%-2.2%-0.3%8.7% B 35.0%5.5%-2.5%-0.5%6.4% C 45.2%4.7%-3.3%-0.5%10.9% D 47.9%3.7%-3.1%-1.0%6.9% E 64.3%5.8%-4.6%-1.3%5.8% F 69.3%4.2%-4.3%-1.4%5.6% G 107.7%3.2%-6.4%-2.0%3.9% H 101.0%2.5%-15.2%-2.1%-0.5% I 140.1%2.2%-12.9%-2.3%-4.5%
and
Critical Themes Illuminated By the 2022
Jacksonville/Duval County MVA
Housing Affordability: 120% Median Household Income
Areas Affordable at 120%
Median HH Income
Affordable
Unaffordable
Share of Markets Affordable at 120% Median Income ($68,123)
ABCDEFGHI
0%0%6%42%62%61%100%100%100%
Housing Affordability: 100% Median Household Income
Areas Affordable at 100%
Median HH Income
Affordable
Unaffordable
Share of Markets Affordable at 100% Median Income ($56,769)
ABCDEFGHI
0%0%1%15%24%34%100%100%100%
Housing Affordability: 80% Median Household Income
Areas Affordable at 80%
Median HH Income
Affordable
Unaffordable
Share of Markets Affordable at 80% Median Income ($45,415)
ABCDEFGHI
0%0%0%0%0%5%63%100%100%
Housing Affordability: 50% Median Household Income
Areas Affordable at 50%
Median HH Income
Affordable
Unaffordable
Share of Markets Affordable at 50% Median Income ($28,384)
ABCDEFGHI
0%0%0%0%0%0%2%86%100%
Housing Affordability: 100% Median Household Income in 2018
Areas Affordable at 100%
Median HH Income 2018 Affordable
Unaffordable
Change in Affordability from 2018 MVA for 100% Income
Areas Affordable at 100%
Median HH Income
Affordable
Unaffordable
Newly Unaffordable
White Residents Can Afford Most Middle Market Areas
Areas Affordable at 100%
Median Whi. HH Income
Affordable
Unaffordable
Share of Markets Affordable at 100% Median Income ($65,300)
0%0%6%36%54%56%100%100%100%
ABCDEFGHI
Black Residents With Typical Incomes Have A More Constrained
Geography of Opportunity
Areas Affordable at 100%
Median Black HH Income
Affordable
Unaffordable
Share of Markets Affordable at 100% Median Income ($41,664)
0%0%0%0%0%2%37%100%100%
ABCDEFGHI
Hispanic Residents With Typical Incomes Similarly Have A Constrained Geography of Opportunity
Areas Affordable at 100%
Median Hisp. HH Income
Affordable
Unaffordable
Share of Markets Affordable at 100% Median Income ($55,311)
0%0%1%9%10%29%100%100%100%
ABCDEFGHI
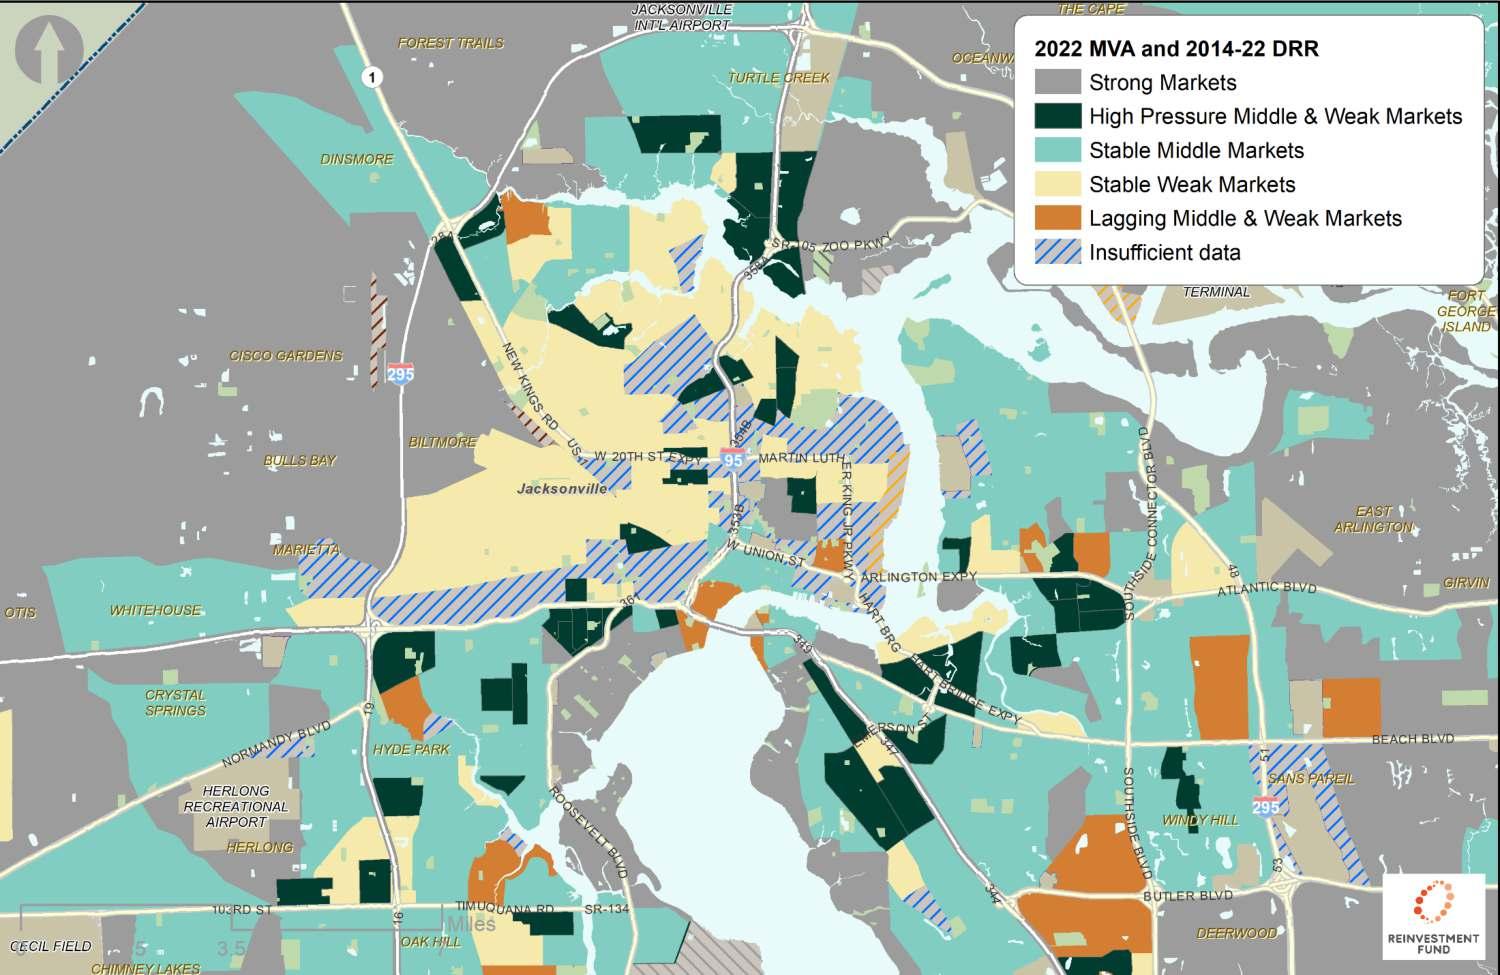
Areas with Increasing Displacement Pressure Are Generally In
Weaker Markets Near Downtown
Most pressure is around Downtown
Most pressure is around Downtown
MVA and Displacement Risk Ratio
Areas with Potential for Displacement
Areas with Potential for Displacement
For-Profit Investors Are Active Throughout Duval
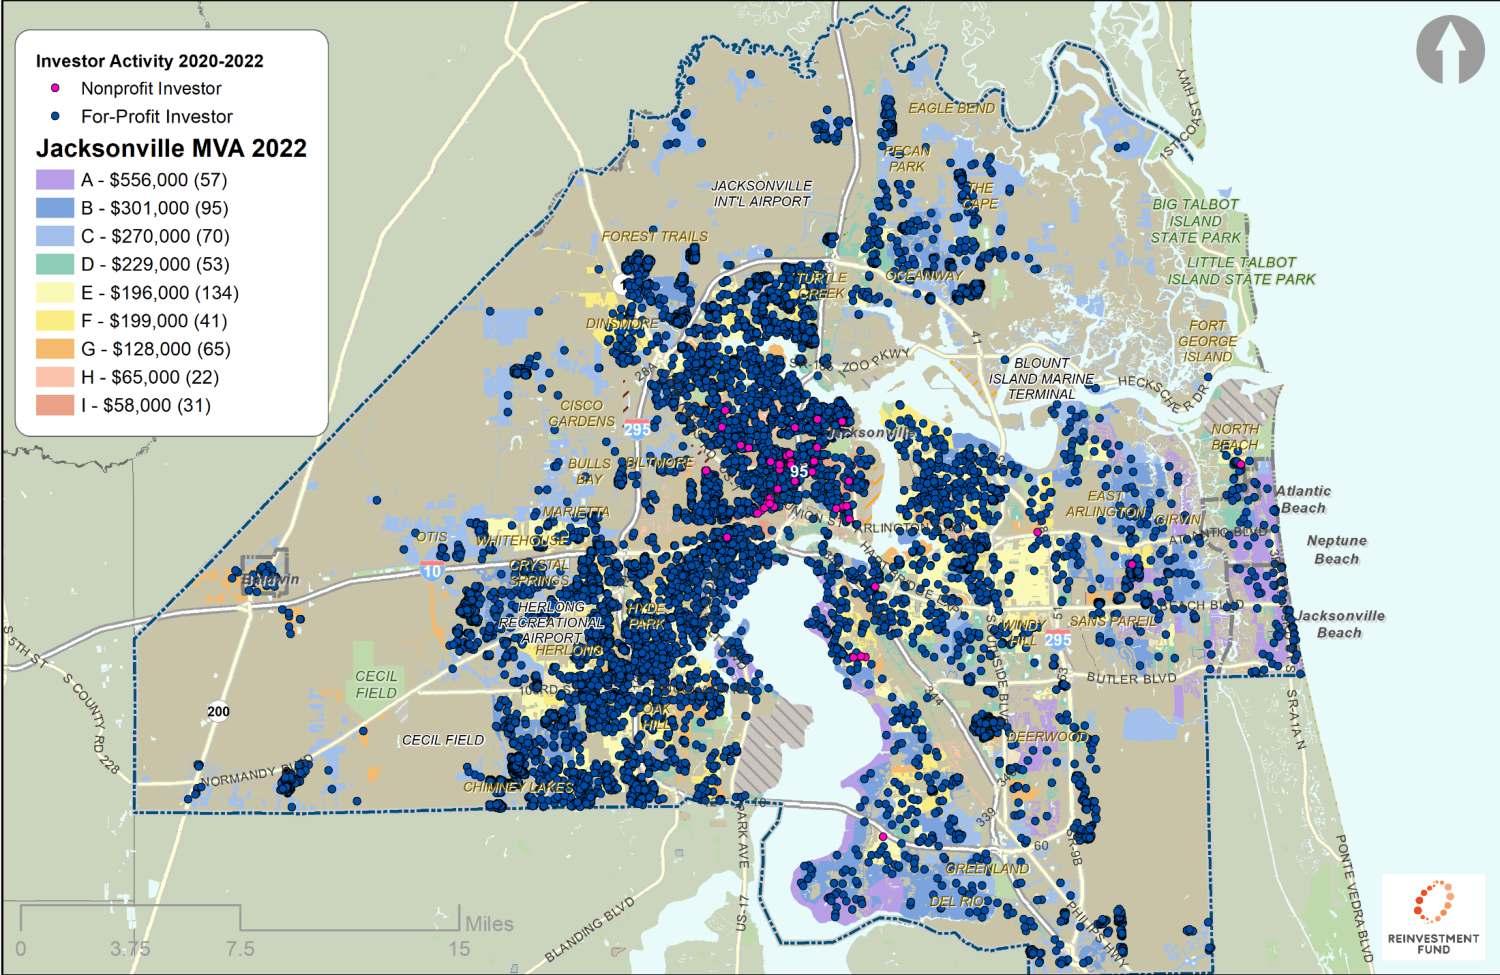
And also Own Properties Throughout Duval
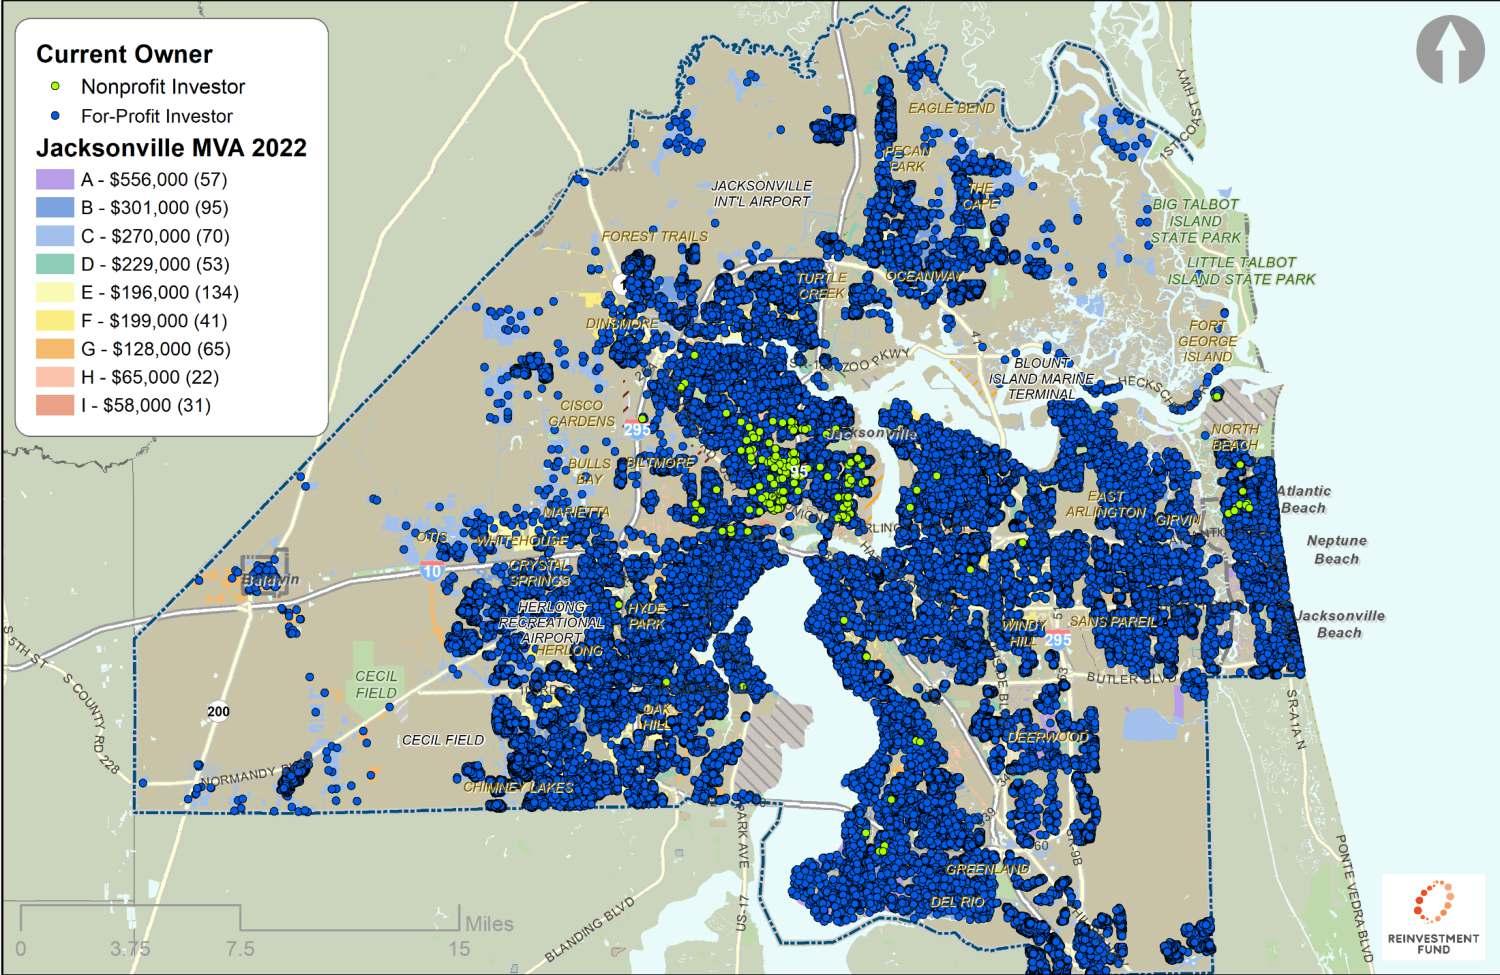
How Does the Mix Of Investor Sales Vary Across Market Types?
41 2021 MVA Category Share of Sales from Non-Investor to NonInvestor Share of Sales from Non-Investor to Investor Share of Sales from Investor to NonInvestor Share of Sales from Investor to Investor Share of Sales with a For-Profit Investor Involved A 67.8%9.3%19.8%3.1%31.9% B 62.7%10.5%20.3%6.5%37.6% C 39.4%8.5%44.1%7.9%60.6% D 54.3%9.2%28.0%8.5%45.7% E 46.0%15.0%22.9%16.2%54.0% F 48.3%13.0%23.7%15.1%51.8% G 41.0%14.7%22.0%22.3%59.0% H 21.4%19.5%23.1%36.1%78.7% I 17.7%21.7%22.0%38.7%82.4%
There are Relatively Few Mortgage Applications in Orange/Salmon Markets; Most Sales in those Markets are Cash Sales
The table below shows mortgage outcomes from Home Mortgage Disclosure Application filings. The share of cash sales are estimated by comparing the number of originated loans with the number of residential transactions.
Originated Loans Rejected Apps Withdrawn Apps Total App Purple Markets 2,419 (73%) 241 (7%) 655 (20%) 3,315 (100%) Blue/Green Markets 17,488 (71%) 3,089 (12%) 4,168 (17%) 24,745 (100%) Yellow Markets 9,770 (68%) 1,856 (13%) 2,750 (19%) 14,376 (100%) Orange/Salmon Markets 2,086 (62%) 558 (17%) 713 (21%) 3,357 (100%) All Markets 31,763 (69%) 5,744 (13%) 8,286 (18%) 45,793 (100%) Home Purchase Application Outcomes, 2020-2021 *Only Includes first lien, home purchase applications for owner-occupied single family homes Originated Loans Total Sales, 20-21 Estimated Mortgage Sales 2,4192,955 82% 17,48824,123 72% 9,77016,325 60% 2,0866,862 30% 31,76350,265 63%
Estimated Sales with Mortgages, 2020-2021 Total Households App per 100 Households 21,715 15 70,518 35 84,867 17 49,042 7 226,142 20 Applications per Households, 2020-2021 Mortgage Application Outcomes Vary Substantially Across MVA Market Types
Sales in Salmon Markets are
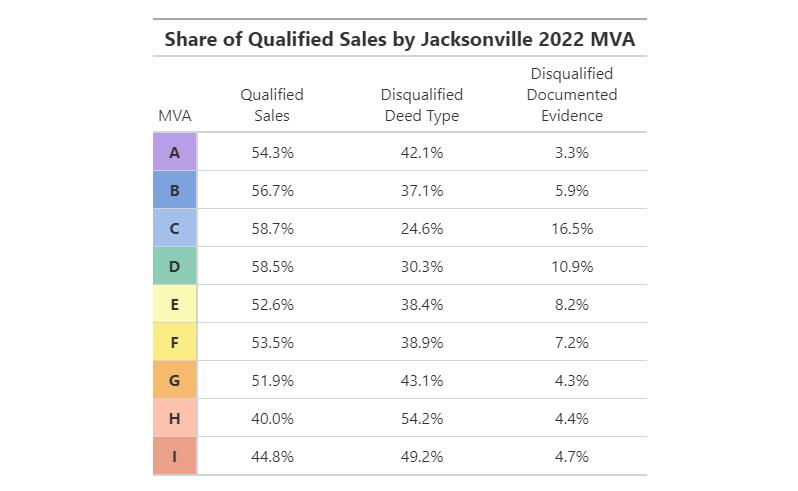
More
to be Disqualified because of Deed Type 43
Likely
Reinvestment Fund Policy Solutions
Ira Goldstein, President
ira.goldstein@reinvestment.com
Colin Weidig, Senior Policy Analyst
colin.weidig@reinvestment.com
Jessica Guarneros, Senior Policy Analyst
jessica.guarneros@reinvestment.com
