14 minute read
Foodshare

from Jiya Benni Portfolio
by Jiya Benni

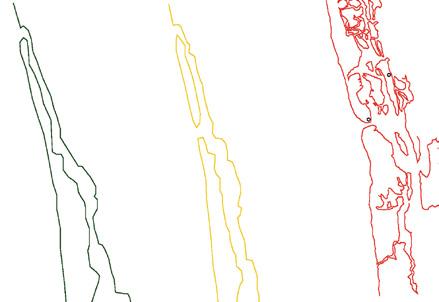
Until 2 nd cent 2 nd - 10 th cent. 10 th - 18 th cent
18 th century 19 th century
Advertisement
Present
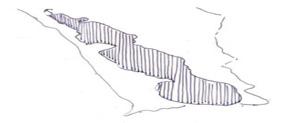
Morphological evolution of the lagoon throughout the centuries (plotted from different sources)
16 th - 19 th cent
19 th cent 20 th cent 21 st cent
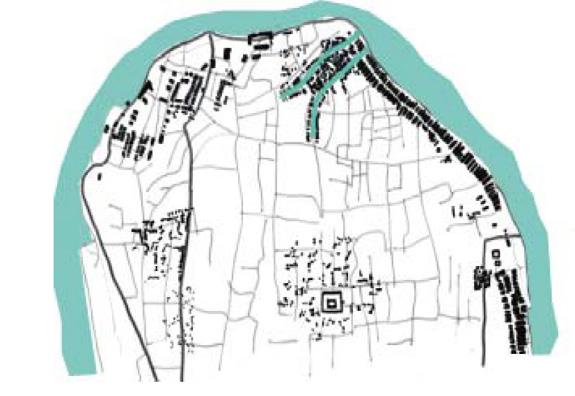
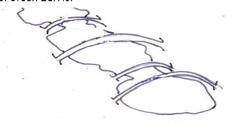
Evolution of the city throughout the years (mapped from historical records)
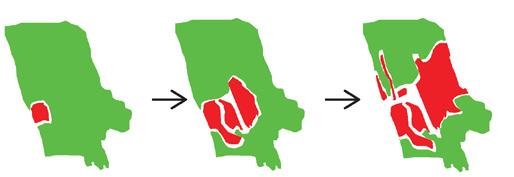
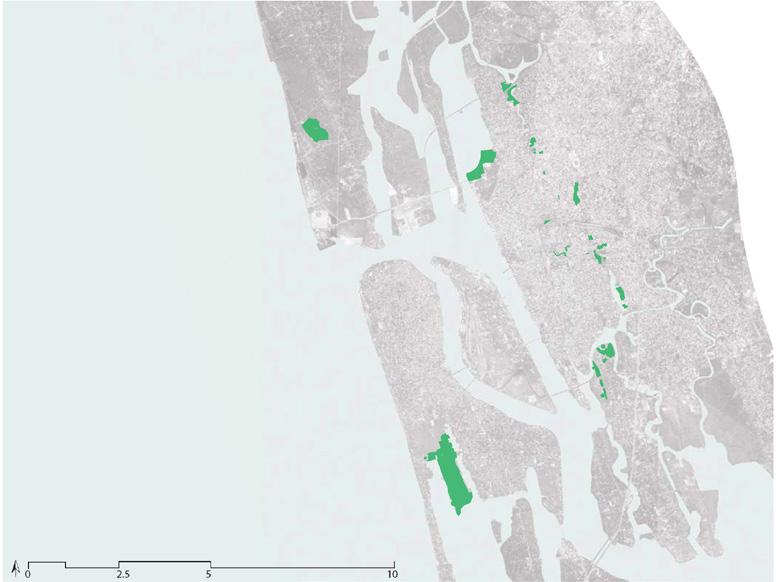
In its growth, the city ate the green around it.
As can be seen from the morphological evolution, the lagoon has changed its form in the last many centuries. Kochi’s harbour was carved out in a massive flood in 1341 AD. This implies that the form may change in the coming centuries too. But unaware of the fragility and benefits of the ecological structure around it, Kochi grows, slowly devouring them.
In the past, there was a strong relationship between nature and the built environment. Settlement patterns of older parts of the city show this but in the newer parts, this relationship is weak.
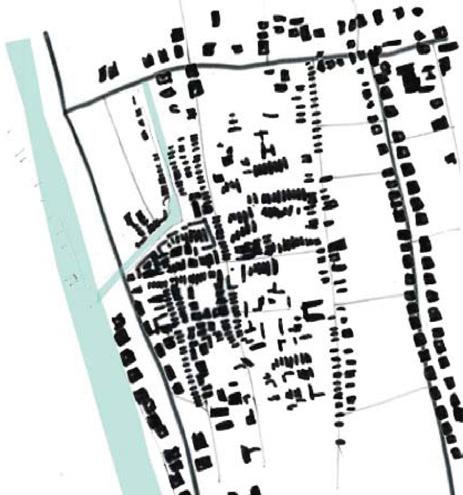
If the city continues to grow as it is doing now, the relationship between the natural and built environment will further weaken, and destroy the city’s natural flood management system.
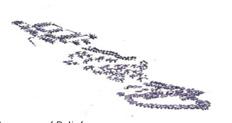
Settlement pattern of Fort Kochi which was established in the 16th century
Settlement pattern of modern Kochi which was established in the 20th century
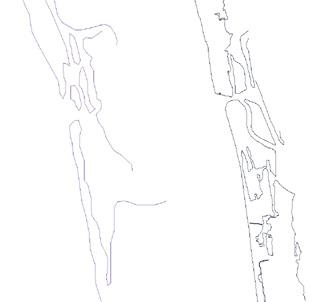
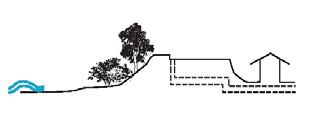
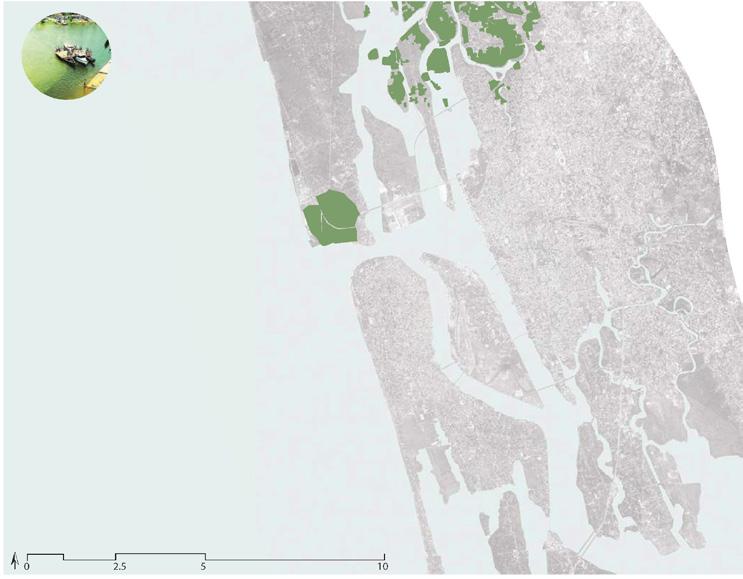
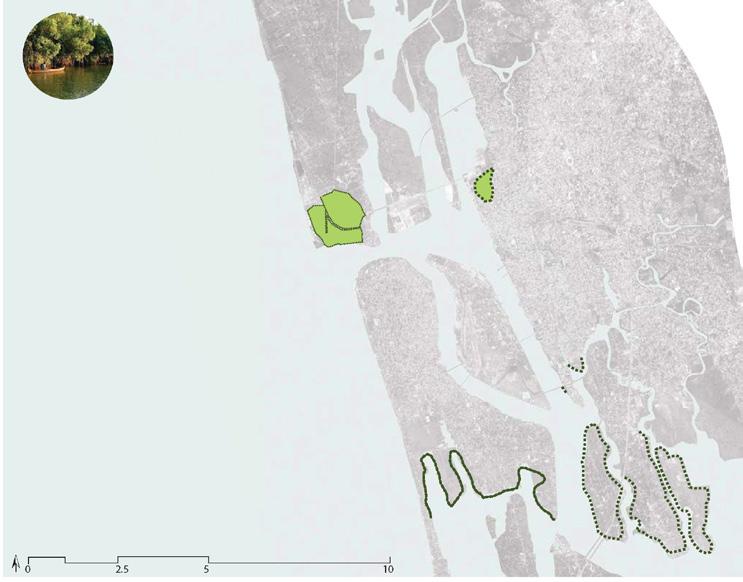
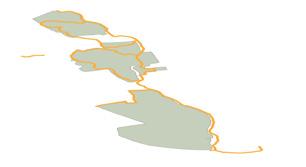
Existing profile of the wetlands in the North-West of the city
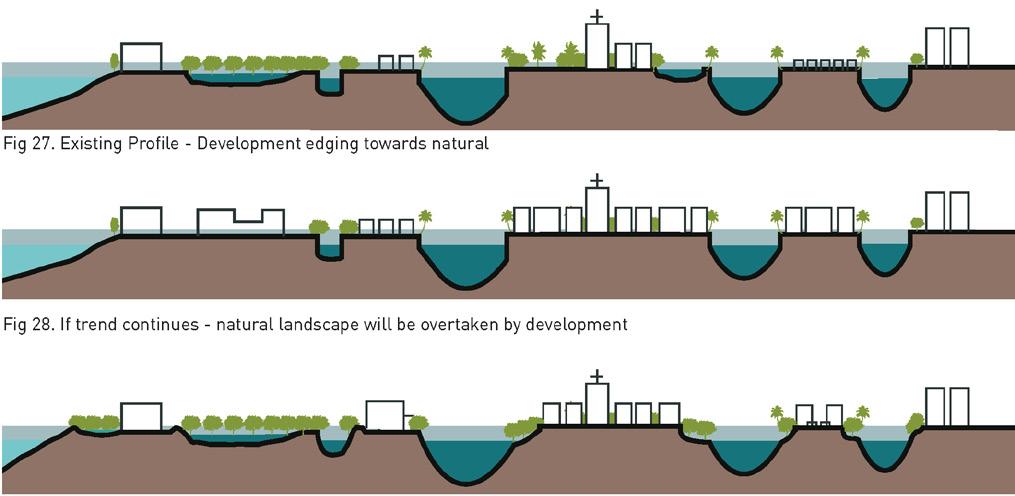
If current trend continues, development will take over nature in these areas
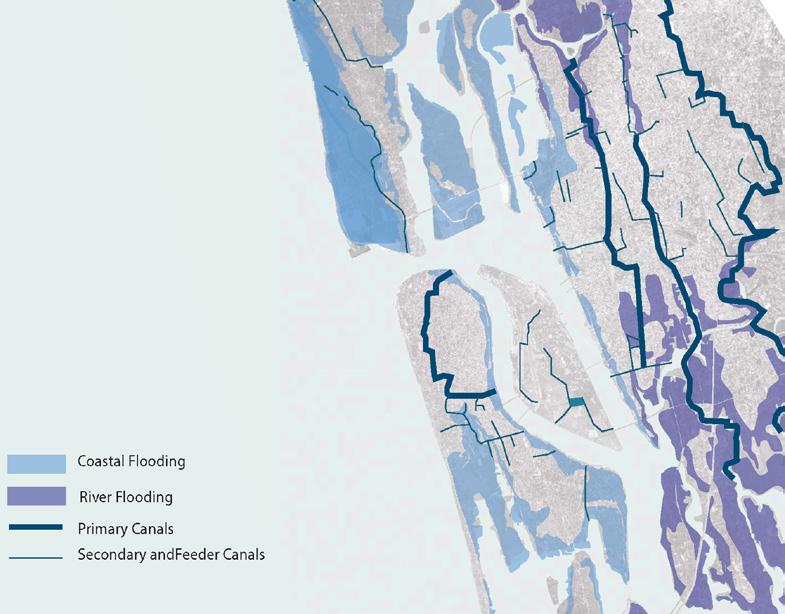
rivers flowing in
coastal flooding
river flooding (June, July, Aug, Oct, Nov)
soil erosion The Kochi estuary’s flooding problem is multi-faceted. In the rainy season (June - August, October - November), the city is subjected to flash floods while the surrounding area gets flooded due to overflowing rivers.
Though not always predictable, the coastal parts also get flooded every year. Waves easily overtop the seawalls employed here for flood prevention.
The seawalls don’t prevent erosion nor encourage accretion. Therefore, the coastline is considered to be highly eroding as well.
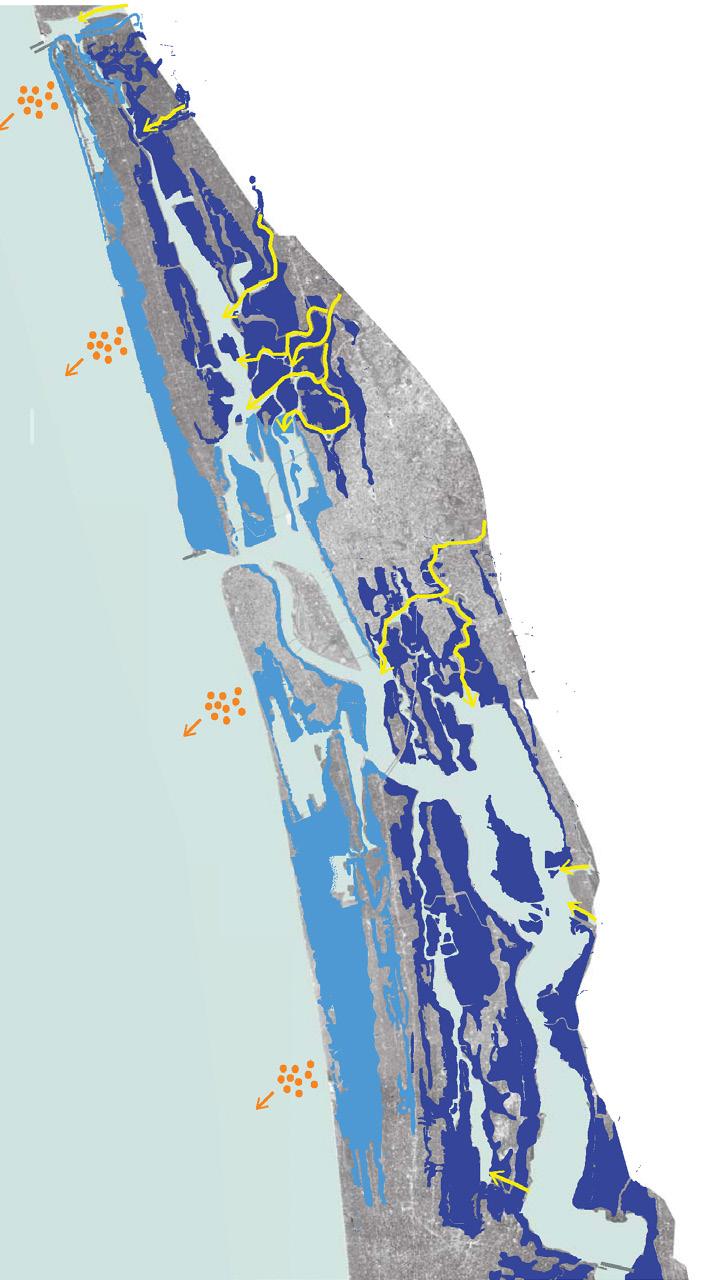
Map of canal system overlapped with flood map, created based on data
Other than flash floods in the city, the following problems were identified in the estuary. Problem
Solution
Littoral drift gets blocked by groynes to facilitate navigation.
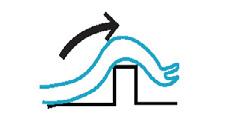
Seawalls don’t prevent beach erosion and waves easily overtop them. Mangroves and coastal vegetation can act as a buffer for the floods as well as encourage soil accretion.
After any flooding event, houses and fields along the coast remain waterlogged.
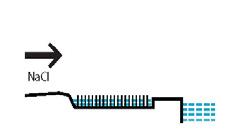
During dry season, saltwater intrusion hinders cultivation.
Map of canal system overlapped with depth to water table, created based on data Floodplains and proper drainage
When the salinity of the water is high, these fields can be used for prawn farming.
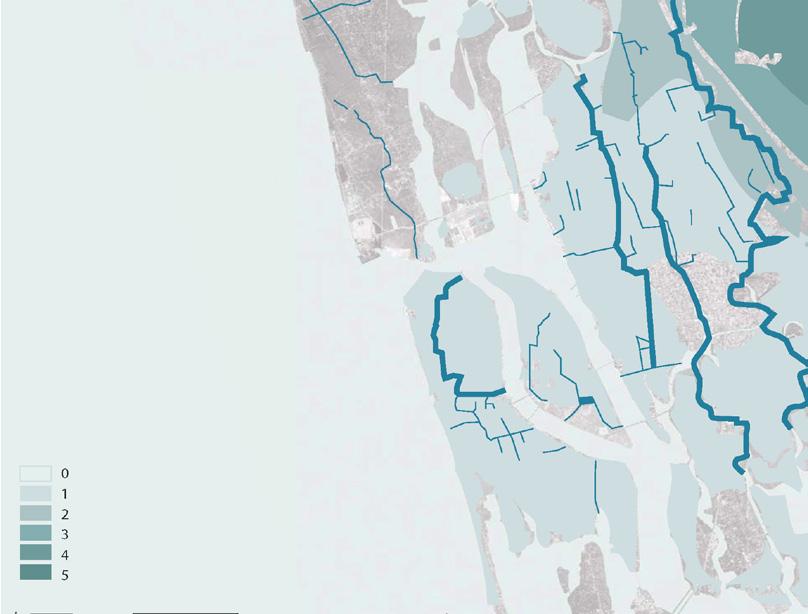
According to the flood map, the main parts of the city is affected mostly by flash floods. Overflowing rivers or coastal floods don’t affect the main parts of the city.
An analysis of rainfall data, the city’s water table, and the overall canal network showed that the canal network was sufficient to manage the flood the city faces. It is enough if the canals are regularly cleaned and maintained.
The project proposes for the canal to be made part of the blue-green structure. This way, the canals will brought into focus.
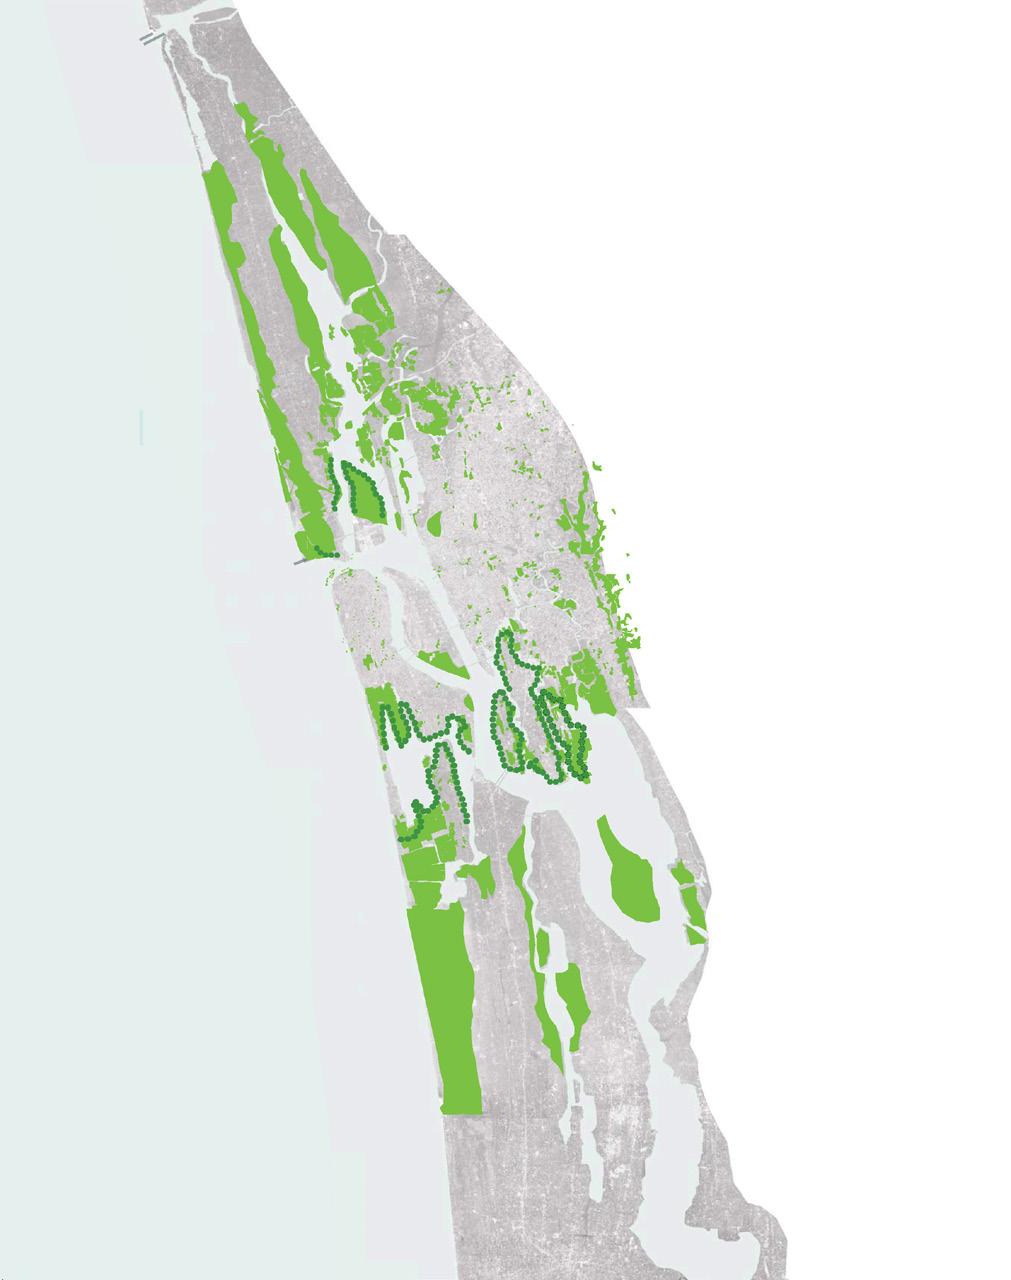
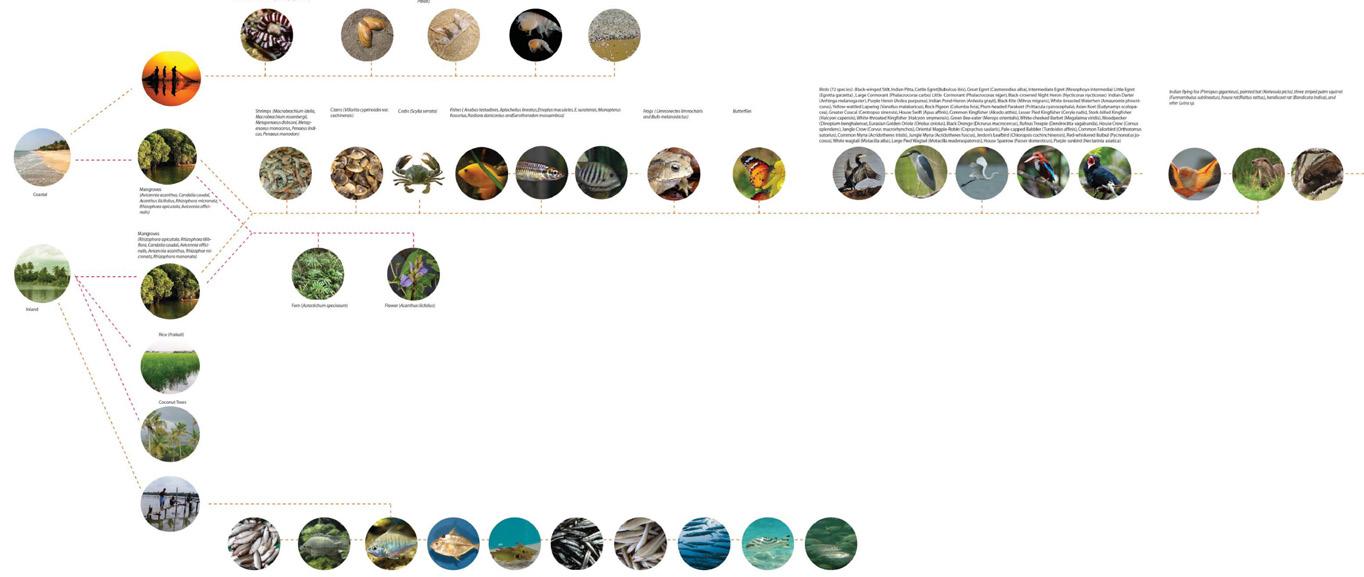
Along with flooding, the city’s wetlands and their benefits were also studied. The main types of vegetation include mangrove forests, paddy fields and coconut trees. The main benefits identified are:
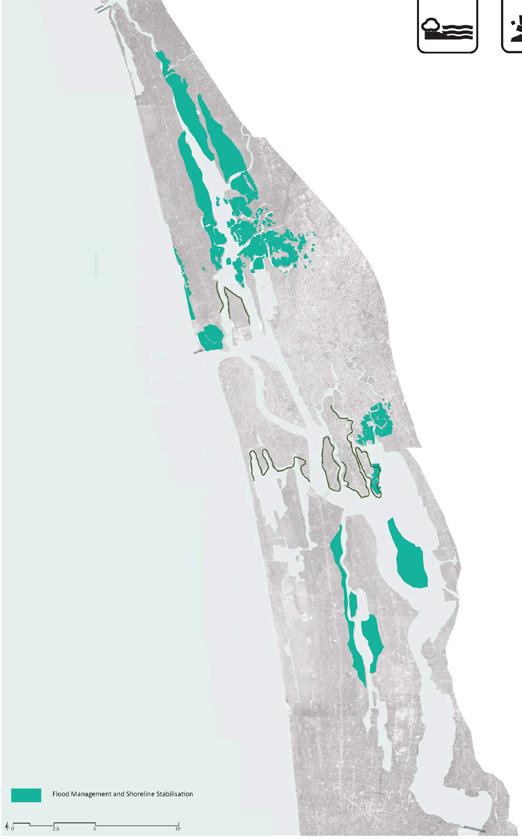
Flood Management and Shoreline Stabilisation Biodiversity and Nutrition Retention Groundwater Retention Cultural Value and Wetland Products Tourism and Recreation
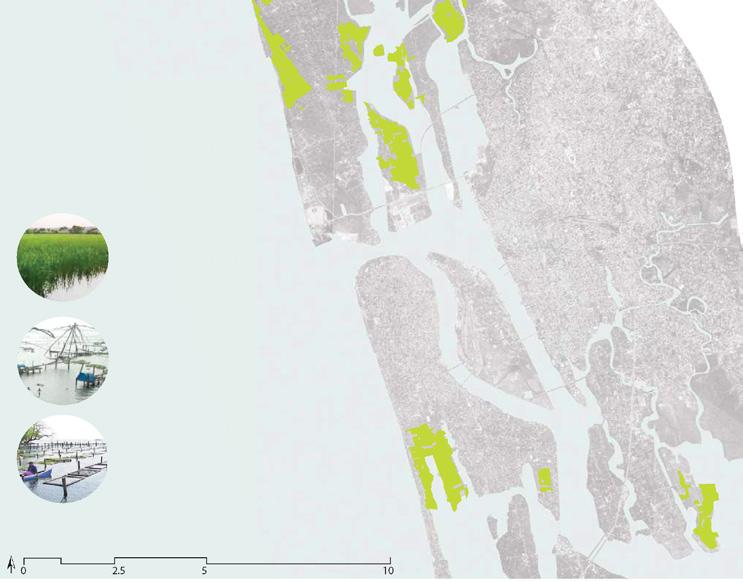
Wetlands that have cultural and economic value including tourism
Wetlands that help in flood management and shoreline stabilization
Wetlands that help in biodiversity and nutrition retention
Wetlands that help in groundwater retention
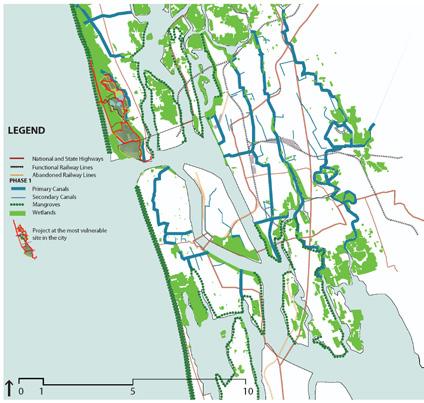
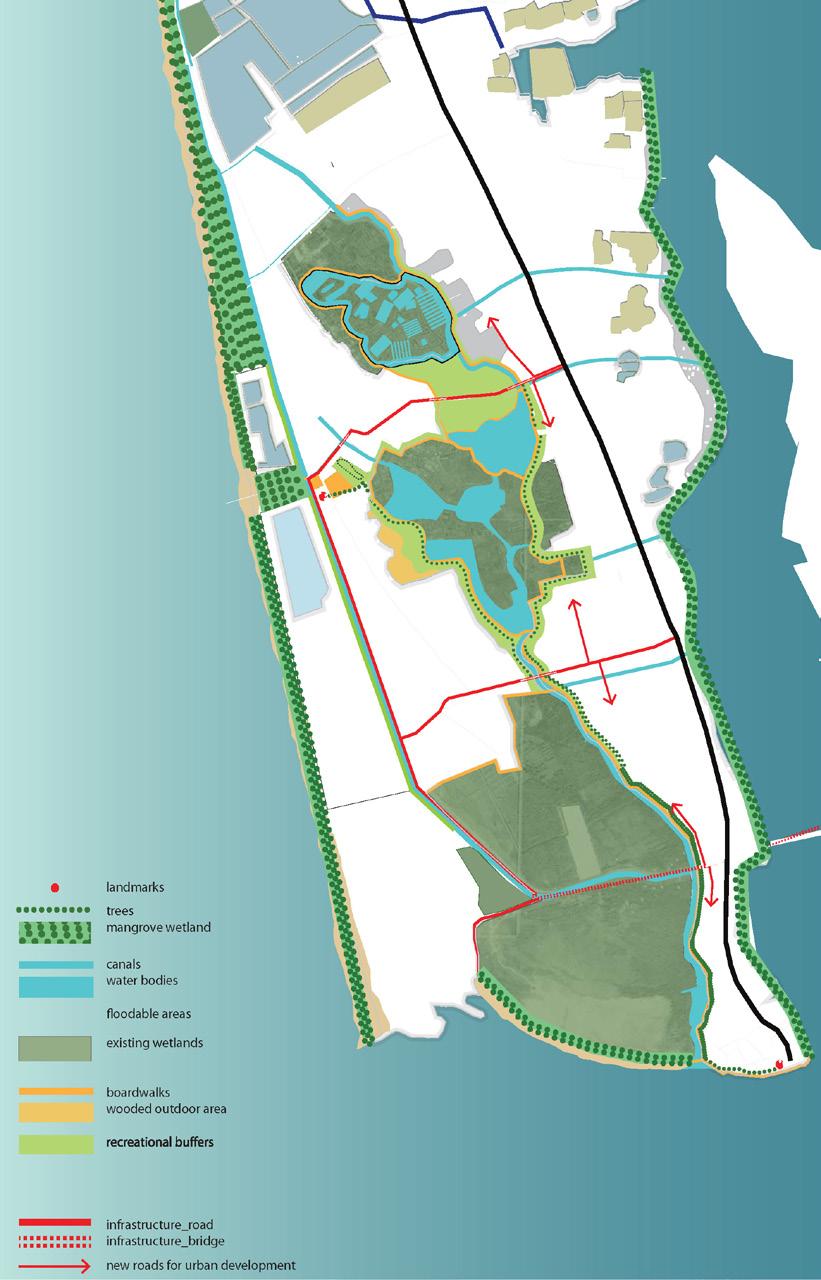
In order to protect the wetlands and the canal system, and ensure their role in flood management, the project proposed a four-phase strategy.
Phase 1 - includes regenerating old canals, planting mangroves and creating floodplains. Coastal erosion and flooding will be managed by replenishing the beaches and reestablishing coastal floodplains using a sand engine and planting mangroves. One wetland that is under the threat of development will be protected as a wetland with public spaces around it.
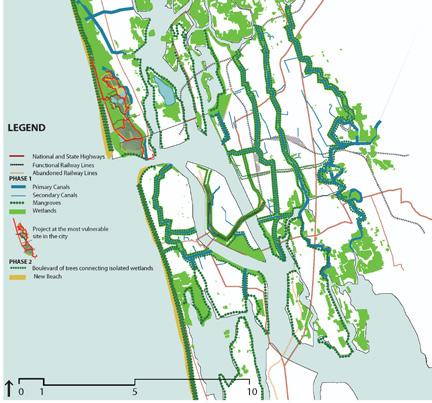
Phase 2 - a green structure along the blue is created to be the structural backbone of the city. More vegetation is planted along abandoned railway lines and canals to ensure an ecological flow of birds and other animals through the city.
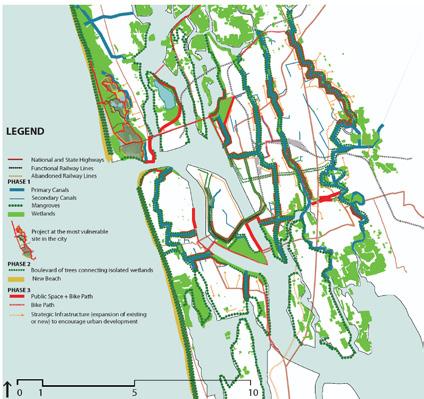
Phase 3 - to make the blue-green structure a part of the urban life, the next step is to create a continuous structure of public spaces along the blue-green structure. Roads are laid out next to them to encourage urban development along them.
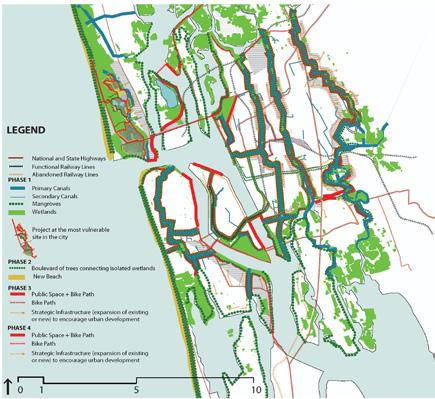
Phase 4 - the public space network established in Phase 3 is expanded all over the city in this phase.
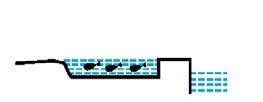
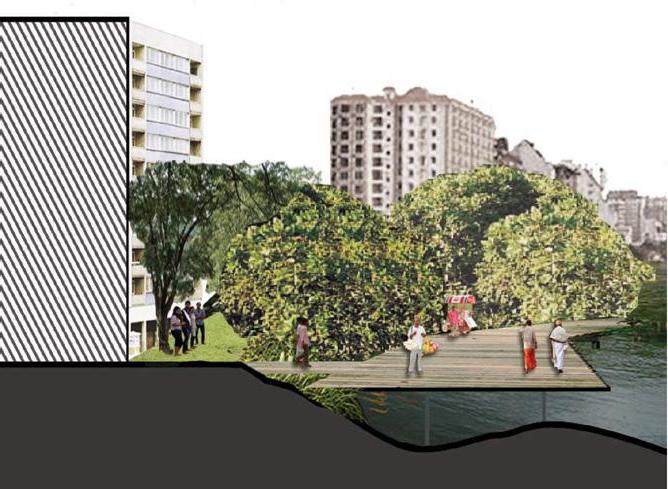
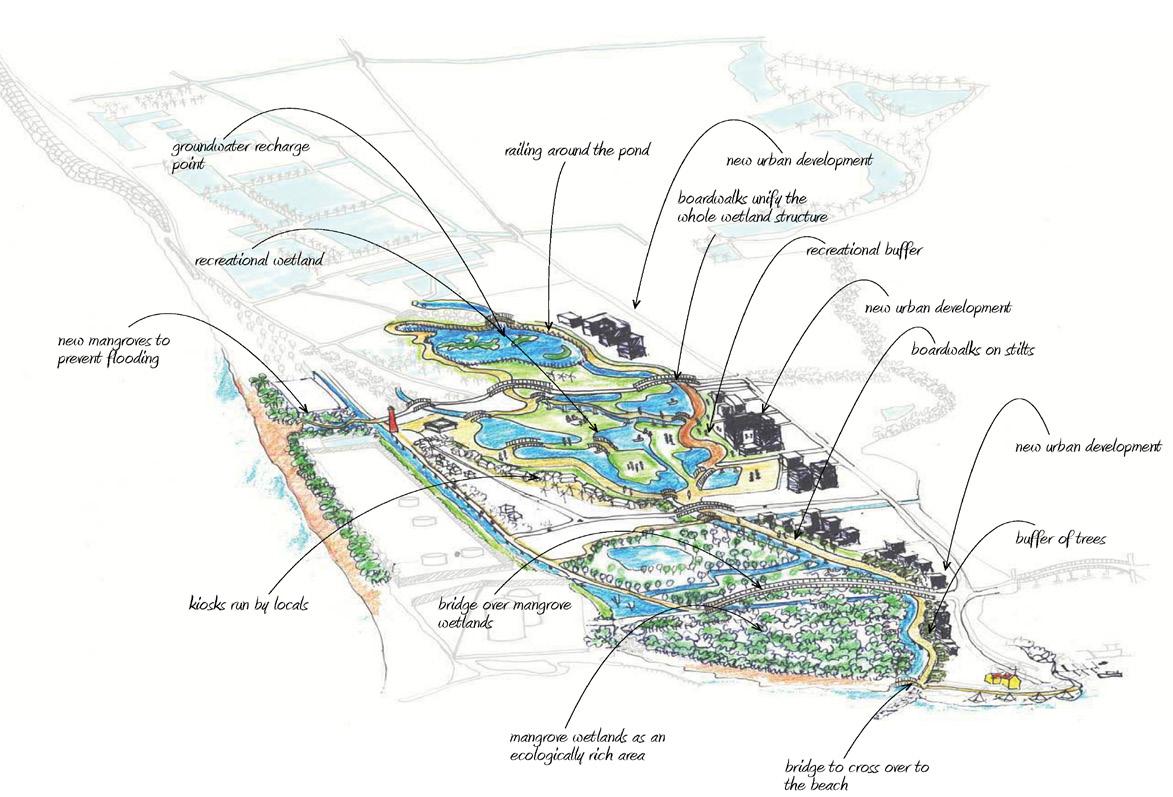
Walking promenade on stilts framing the wetland and the potential buildings nearby.
Section BB
Plan Before urban development
Wetlands that also act as public spaces
Section BB
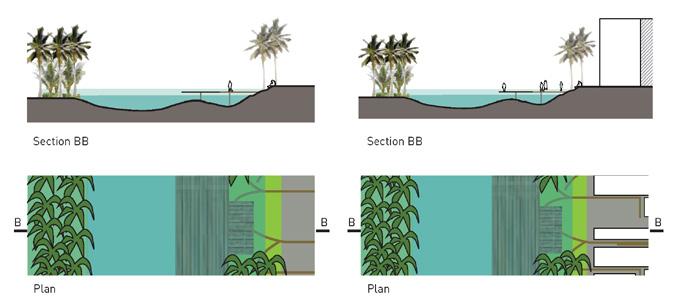
Plan After urban development
Section CC
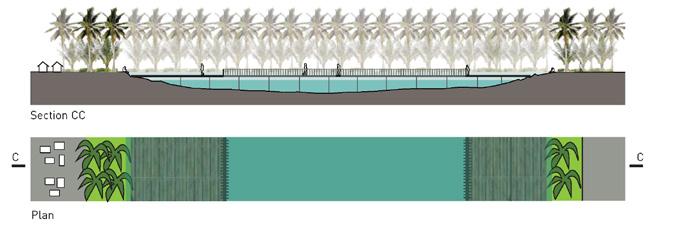
Plan
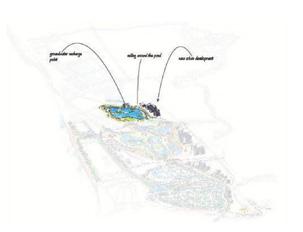
Wetlands that are points of groundwater recharge
Section DD
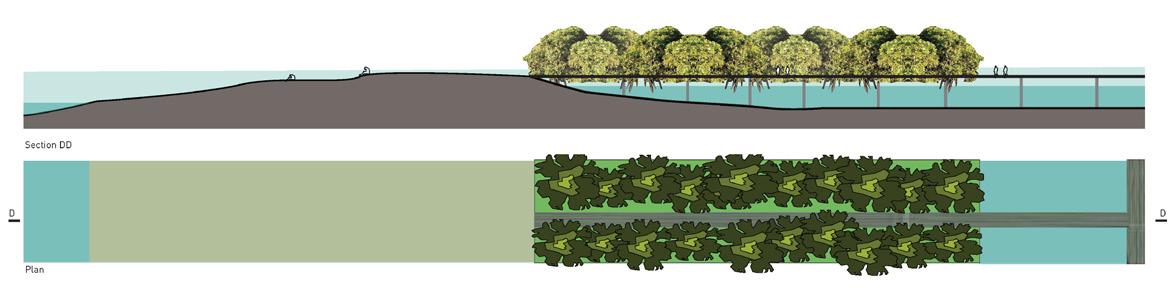
Plan Wetlands that border the coast The proposal for this wetland is a scaled down version of the proposal at the city scale. Similar to the strategy at the city scale, the strategy at the local scale also attempts to set off centres of growth in the future.
The design will 1. Investigate how wetlands act as flood management systems and 2. Organise urban development around these wetlands rather than on it.
At this scale, the fragmented wetlands are unified into a single structure to create a better flood management structure.
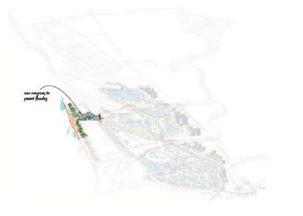
This is achieved by building a bridge over the wetlands. The green structure is organised based on the different roles it has to play – flood management, groundwater recharge point, ecological and recreational functions.
Some of the wetlands will be converted to unique public spaces by programming them. This way, these wetlands can become a seam rather than an edge, and act as a connector in the area.
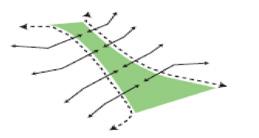
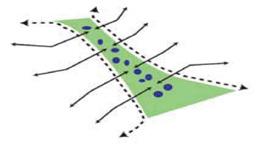
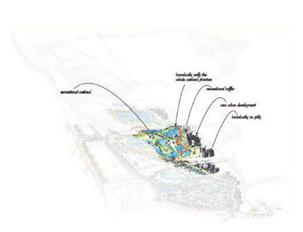
Sketch of the wetlands with the proposed wetland structure and urban growth around it
The edges of the wetlands are defined by trees and a pedestrian loop. Based on landmarks and surrounding wetland types, different routes that can be made part of this pedestrian loop have been identified. According to the types of wetlands and the edges, the spatial experience identified with each part of the route will be different.
In this way, the wetland is anticipated to play a role in flood management as well be part of the urban life.
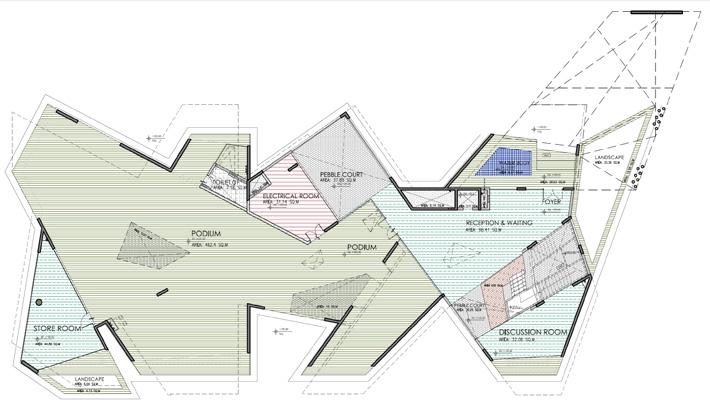
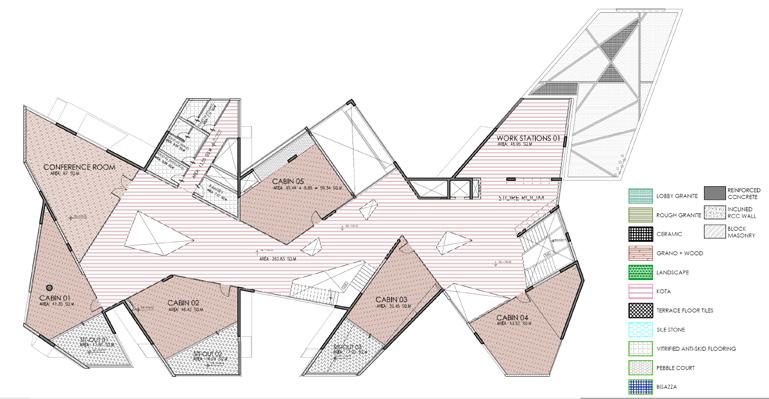
5. PBSS OFFICE (ARCHITECTURE)
Year: 2010-2011 Organisation: InFORM Architects, Bangalore, India Type of project: Architecture
I was involved in various aspects of this project like preparing design schemes, working drawings, and bill of quantities.
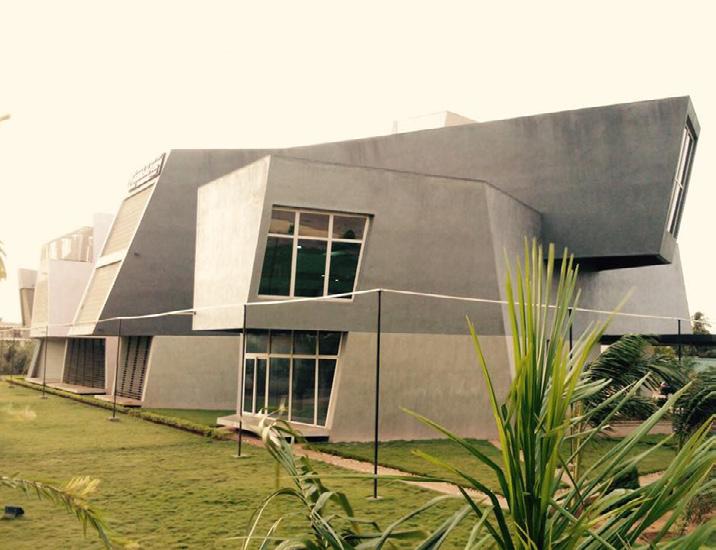
Flooring layouts of the building PBSS Corporate Headquarters
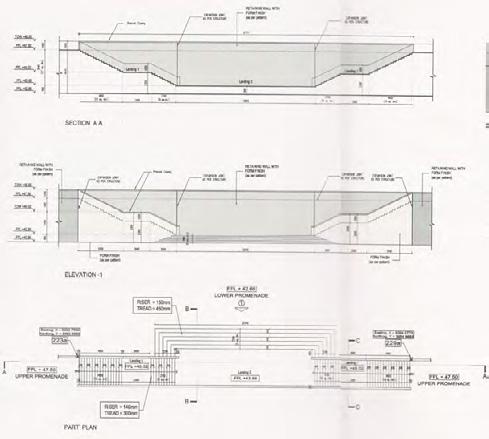
6. SABARMATI RIVERFRONT DEVELOPMENT PROJECT
Year: 2008-2009 Organisation: HCP Design and Project Management Pvt Ltd, Ahmedabad, India Type of project: Urban Design
During my time on the project, I worked on the riverfront promenades, ownership plans, town planning schemes etc. The promenade had numerous access points to the river that I worked on, one of which is shown here.
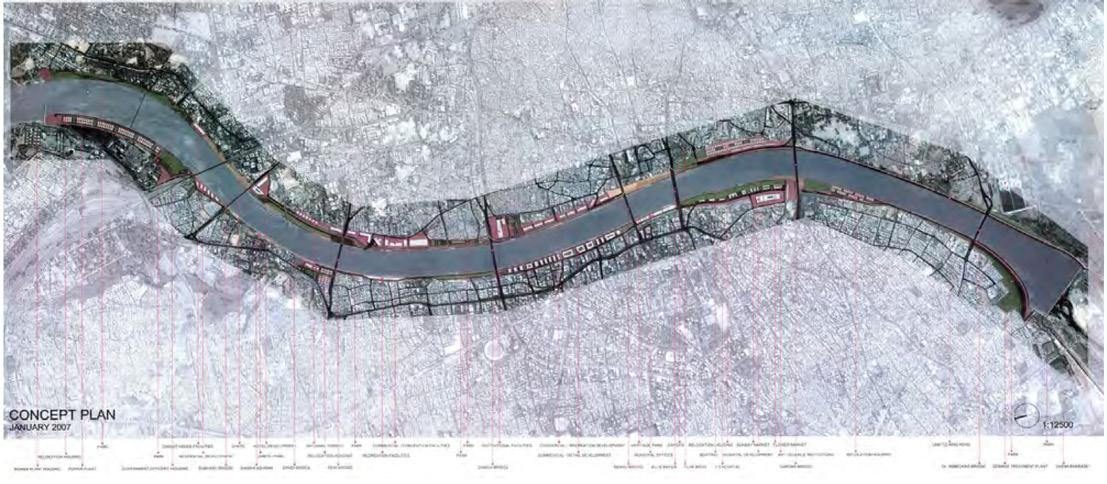
Sabarmati Riverfront Concept Plan
7. SKETCHES AND RENDERINGS
Year: 2011 - 2012 Organisation: TU Delft
These are some sketches and renderings I made for different projects while studying at TU Delft.
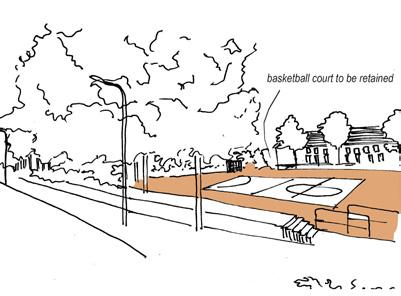
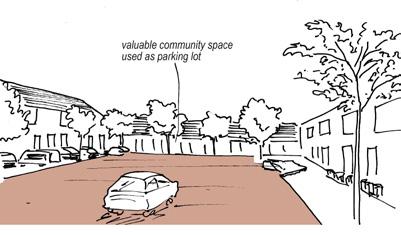
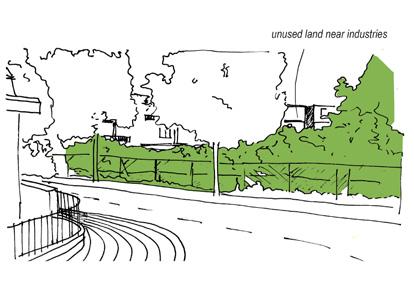
Sketches made for a neighbourhood study.
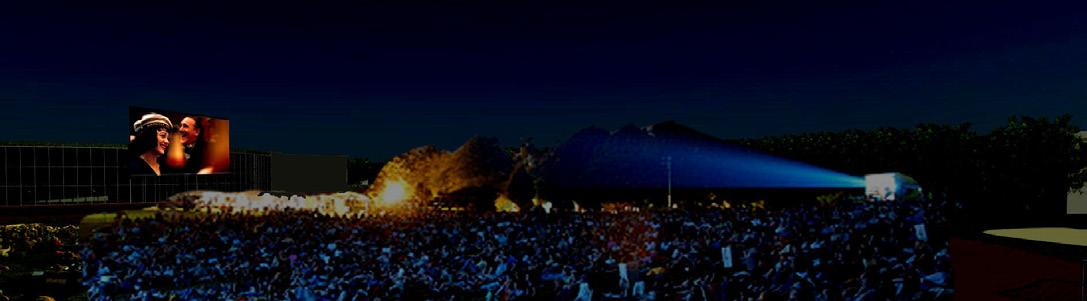
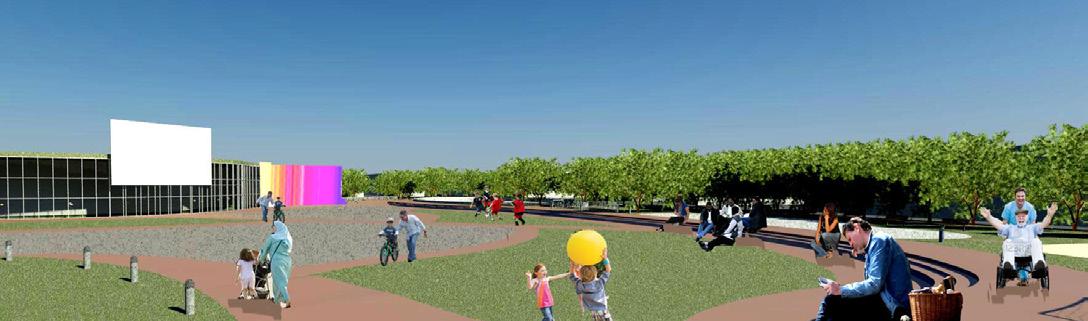
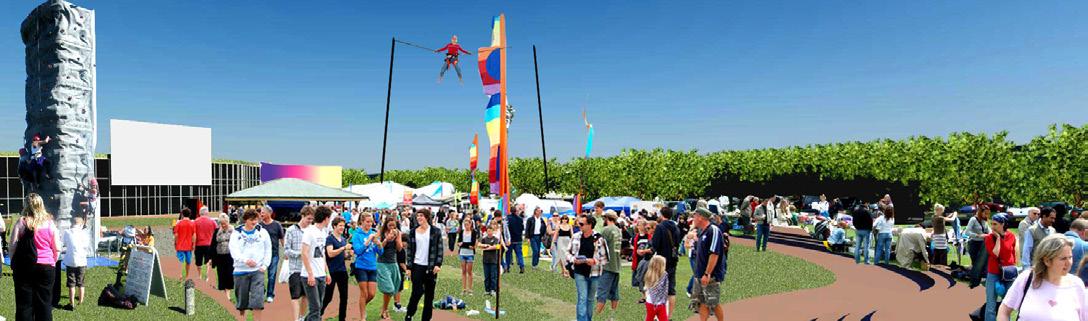
Rendering of a market square (during a normal day, during festivals and movie nights) done for a project.
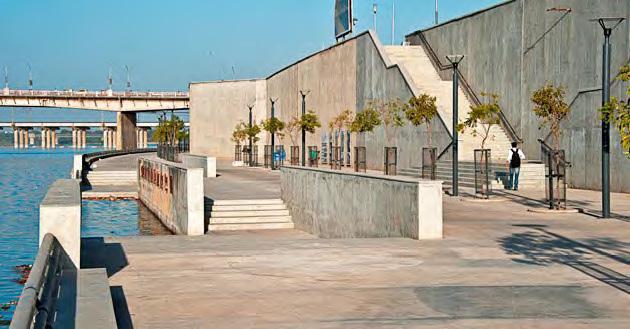
Strength: Water reflects built heritage SWOT analysis done for a project
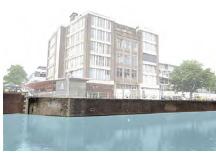
Weakness: Poor water-land relationship Opportunities: Possibility for more waterfront activities
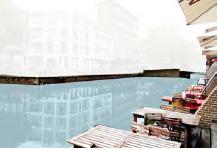
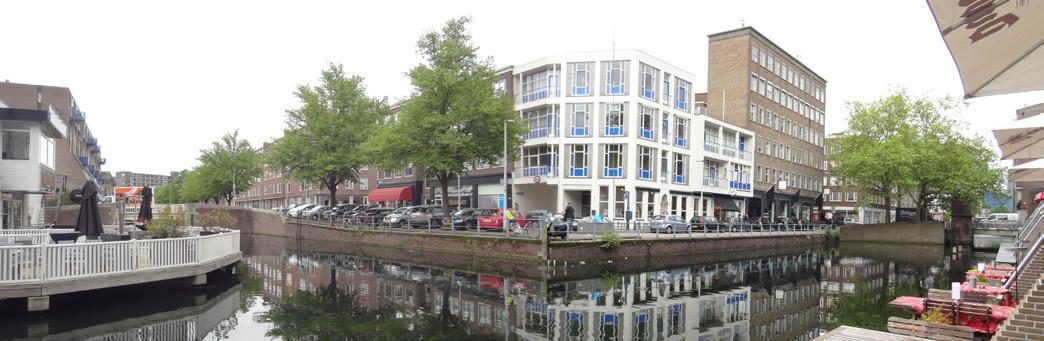
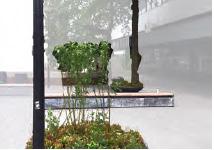
Threat: Obstructing street furniture on the waterfront
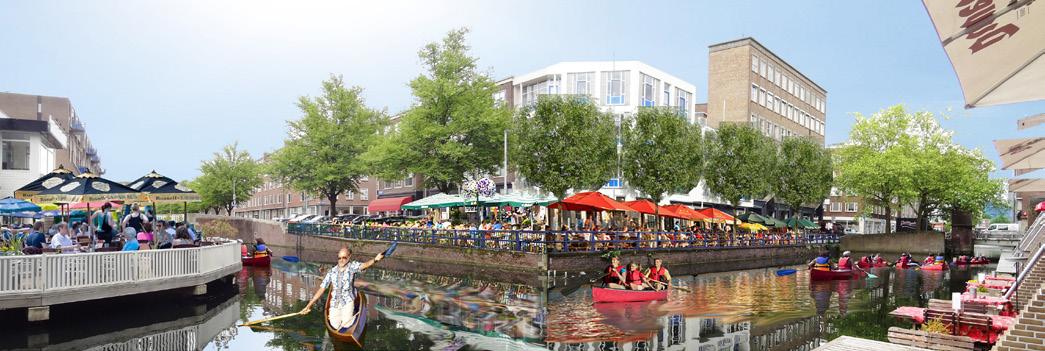
Before-and-after renderings done for a canal in Rotterdam that is activated with waterfront patios and canoeing.
8. OTHER GRAPHICS
Year: 2018 - 2019 Organisation: The Centre for Active Transportation (TCAT) Type of project: Graphic Design
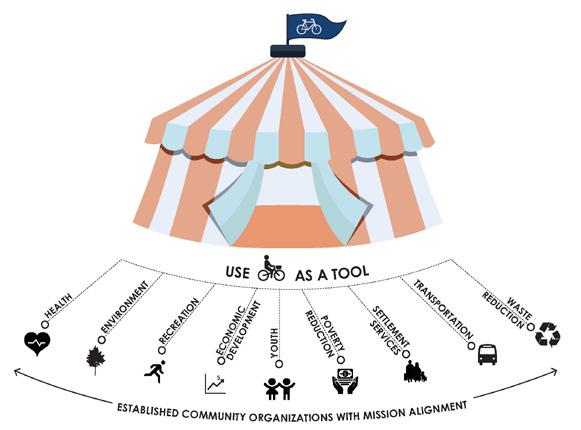
This infographic on this page was made for the Policy Toolkit on participatoryplanning.ca.
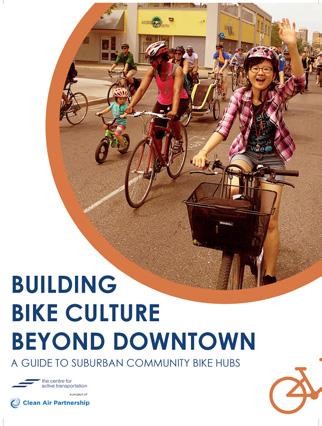
AT TCAT, I also designed reports such as Increasing Cycling in Canada and Building Bike Culture Beyond Downtown including all the graphics that were in them. Some of them are displayed in the next few pages.
Convenient and safe public transit and active transportation facilities increase physical activity, and decrease the amount of cars on the road. Providing attractive and safe streets can mitigate stressful commutes Street connectivity encourages active transportation and increases physical activity. Mixed land use creates walkable communities
Complete communities have access to jobs, education, healthy food choices, and essential services within a neighbourhood Exterior lighting can increase perception of safety
Complete Streets are designed to be safe for all modes of transportation, ages and abilities. They support people to increase physical activity and safely choose active transportation. Increased green spaces and vegetation help with air pollution and provide shade for pedestrians. Attractive and accessible public spaces and parks provide opportunities for social interaction and outdoor physical activity.
Access to green spaces and natural environments supports better mental well-being.
Coverpage: Building Bike Culture Beyond Downtown
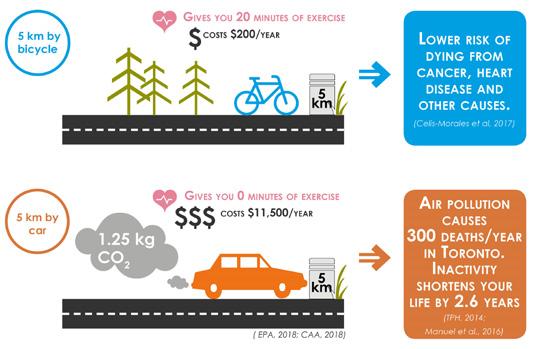
Why cycle?
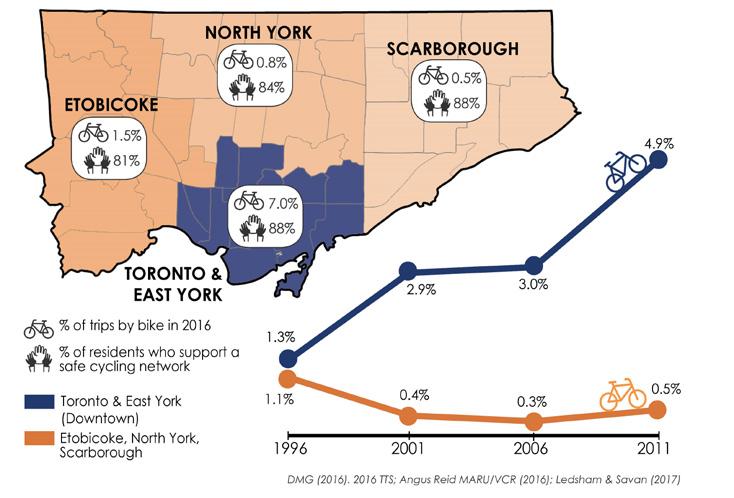
Who cycles in Toronto?
A ‘big tent’ approach to cycling programming
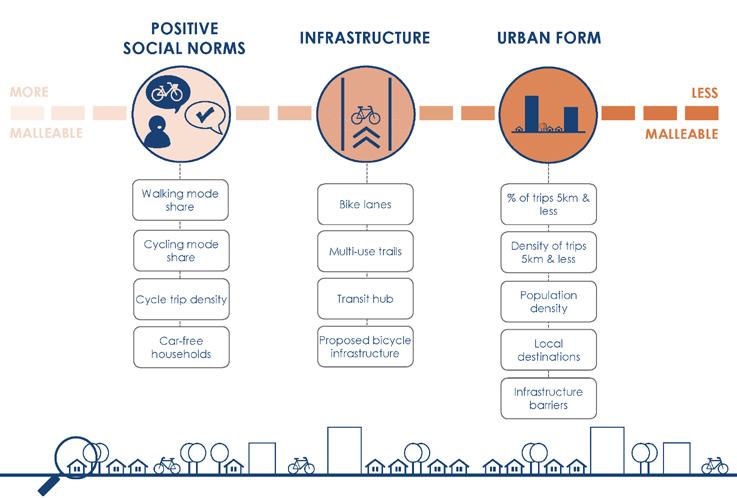
Factors affecting neighbourhood potential for cycling
9. FOODSHARE
Year: 2017 Organisation: Sprout Type of project: Precedent study
Sprout is a charity organisation that does pro-bono landscape architecture for non-profits and community groups.
These pages are from a precedent study I did, as a volunteer, for Foodshare’s outdoor spaces at their Toronto headquarters.
ii. Screens
Screens are an important element to maintain an intimate sense of enclosure and to reduce impact from traffic noise on discussions. The lack of room on the site means that installing proper footings for screens would split up the space where the property line runs down the middle of the street boulevard. An alternative that may be acceptable to the city is to use weighted screens that are not fixed by foundations and can be moved should the city require access to the boulevard. Any plans that make use of the city owned boulevard should be clearly discussed with the city in advance to ensure coordination. If not discussed there is a high risk the city would remove unapproved elements. Figure 19: Screen out the distractions
Figure 20: Re-puroosed windows and planter box screen
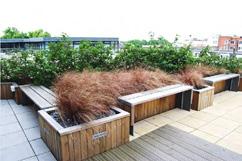
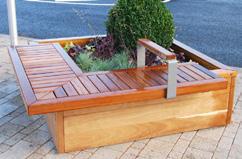
18 18 i. Seating spaces integrated with planters Seating in the lunch spot can go beyond regular benches and picnic tables. Ideas that integrate benches and planters can be used to tie this space together with the goal of demonstrating urban agriculture in small fragmented spaces.
Figure 35, 36: Variations on planter with bench
27
Figure 37: Planted table with benches
28 ii. Tables
Instead of conventional picnic tables, planted tables which could take the form of a picnic table, coffee table or even a counter table are recommended for the lunch spot.
iii. Counters & Service Space Keeping in mind, Foodshare’s daily lunch, creating small scale operational facilities to encourage outdoor use would be an encouraging option for staff and visitors and highlight the social dimension of a more sustainable way of living.
Figure 38: Planted counter Figure 32:: Screen and planters from wooden pallets
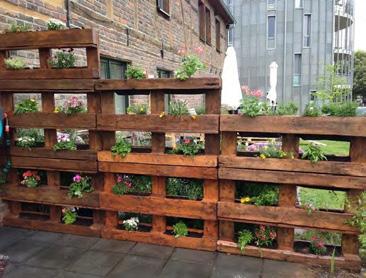
Figure 33: Trellis with planter
10. DRIP POP-UP
Year: 2016 Event: Ryerson Green Infrastructure Hackathon Type of project: Competition winner, team project
The Ryerson Green Infrastructure Hackathon (2016) was a multiday workshop for students and new graduates to come up with a practical solution to implement green infrastructure.
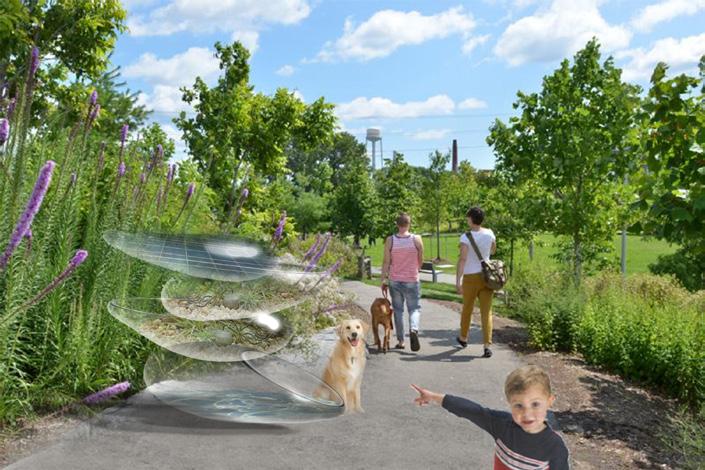
Our proposal, the DRIP Pop-Ups, was a series of art installations that would educate communities while simultaneously activate public spaces. It will help cities like Toronto reach the goal of a fully informed and engaged citizenry.
The aim was to educate the communities on stormwater issues that impact their neighbourhood and Toronto, educate the public about the ecological benefits of stormwater management through green infrastructure and activate public spaces.
They are designed to be scalable, adaptable and interactive. Three versions are proposed here.
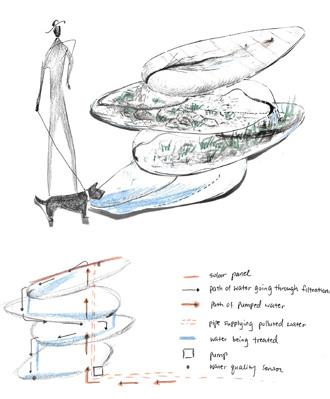
Conceptual render of the DRIP Pod that can be installed in a park.
solar panel path of water going through filtration path of pumped water pipe supplying polluted water water being treated pump water quality sensor
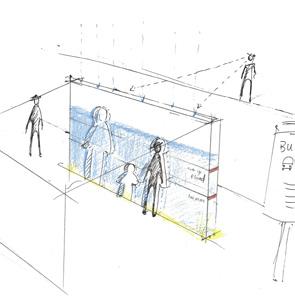
lights capture of rainfall water visual markers of water level
DRIP Pod filters stormwater using vegetation. DRIP Metre illustrates normal and major storm event flood levels using rain water.
less drought-resistant vegetation
wireframe with soil
movement of water Permeable DRIP Chime Impervious DRIP Chime concrete funnel
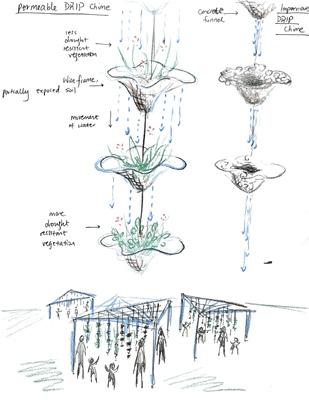
more drought-resistant vegetaion
DRIP Chime demonstrates the impact of permeable and impermeable surfaces on stormwater runoff.


