9 minute read
Beyond
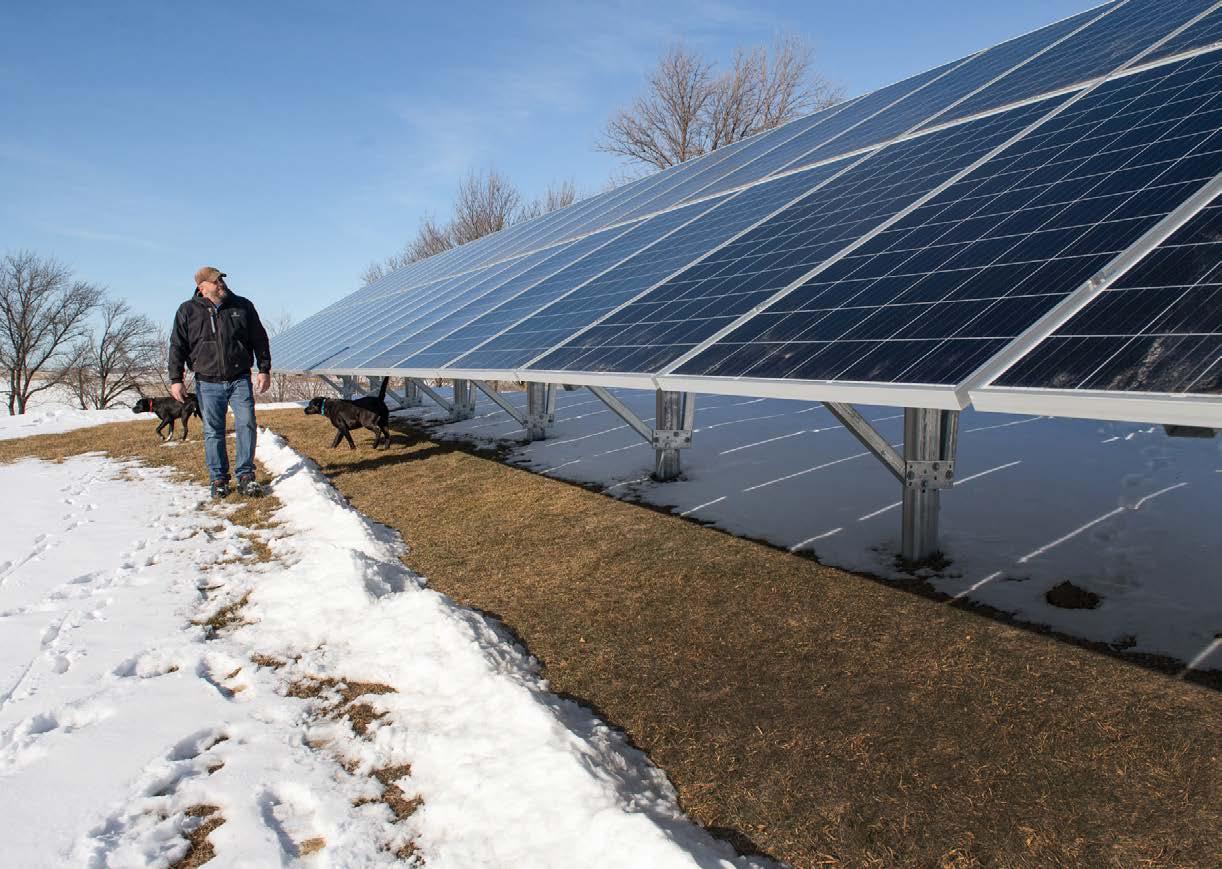
Kevin McGrain inspects his solar panels on his farm near Hornick.
Beyond Consumer Trends
BY KATIE JAMES
Fitting conservation into profitability
When Kevin McGrain started farming no-till in 1996, his neighbors watched from afar, expecting the seemingly crazy practice to fail. But on McGrain’s farm, failure would have looked like doing nothing at all in the face of extreme erosion.
Now, 25 years later, the Hornickarea soybean, corn and cattle farmer reaps the benefits of better soil health, stronger weed control, more dollars and more time. A crucial practice at the backbone of his farm, cover crops and solar panels now add to the sustainability of his row-crop operation.
“I don’t think consumers know how we’ve been improving the ways we farm for decades now,” says McGrain. “The conservation practices we do now would have blown my father’s mind 40 years ago.”
Consumer trends have indicated an increasing desire for product sustainability, from fashion to farming. This eco-driven mindset influences purchasing decisions, according to the Iowa Food & Family Project’s annual Consumer Pulse Survey. 43% of Iowa consumers rated the conservation practices farmers implement as either “somewhat” or “very” important in their grocery shopping decision making.
For Perry-area farmer Tom Vincent, sustainability is a buzzword, but it does the job of getting consumers to think about agriculture.
“If you’re a consumer concerned about greenhouse gases, the no-till farmer has a great story to tell,” says Vincent, who also serves as a director on the Iowa Soybean Association (ISA) board. “We’re growing better crops and sequestering more carbon through better farming practices.”
Many in-field conservation practices McGrain and Vincent employ not only contribute to soil and water health but also pave the way for stronger yields and better profitability.
“I try to be a good steward, but at the end of the day, there has to be a business component to it,” says McGrain. “I have to run my business, and I can’t keep it going if I don’t think about numbers.”
The business of conservation
For the ISA Research Center for Farming Innovation, conservation and profitability go hand in hand.
“As we work with farmers across Iowa, the goal is to always be better and to look for ways to continually improve,” says Todd Sutphin, sr. research program manager who oversees ISA’ field services team. “It’s about advancing overall performance.”
Sutphin and the field services team work to approach farming innovation holistically. He says profitability, agronomy and conservation create wellrounded operations.
This trifecta, Vincent argues, is what defines sustainability.
“The higher yields I can achieve on my land area that is well-suited for production agriculture, then theoretically, the less land that may be considered fragile or provides habitat needs to be put into production to grow the food, fuel and fiber the world needs,” says the central Iowa soybean and corn farmer. “And when farmers are profitable, we can keep going and make investments like bioreactors and other projects to contribute back to the environment long term.”
The Iowa Food & Family Project’s survey shows an additional 51% of Iowa grocery shoppers rate “how food is grown and raised” as an important part of their decision-making. The checkoffdriven ISA research team points out that while in-field conservation practices certainly have a positive impact on soil and water, the edge-of-field and other value-added practices farmers employ contribute back to their farms and overall environment.
Beyond the field
An ISA field services team member says one of his many roles is helping farmers incorporate habitat into their operations.
“Production agriculture has to be attentive to management on multiple fronts, including crop protection products and the risk they carry on species,” says Corey McKinney, ISA field services program manager. “This is why ISA is working on incorporating habitat into operations while maintaining productivity and profitability.”
McKinney works to establish targeted habitat like pollinator plots and restore oxbows, which are c-shaped, off-channel wetlands home to many native Iowa species. This work comes at no cost to farmers. Nearly 30 habitat sites across Iowa have been restored or are in the planning process for work this year.
“Conservation practices are not done all at once,” reminds Sutphin. “I like to look at it as a continuum. It’s our job at ISA to help farmers along that continuum and to know that not all innovation is going to work and not every practice is suited for every farm.”
While consumers push for more sustainable practices in every industry – including agriculture – farmers face the reality that conservation is easier when dollars are available. Programs like the newly established Soil & Water Outcomes Fund – a subsidiary of ISA – pays farmers on a per-acre basis for environmental outcomes related to water quality, soil health and carbon sequestration help.
McGrain’s long-term message to consumers is that he, and most farmers, try to be better every single year.
“I want people to look at my farm and say, ‘That’s the right way to do things’,” he says. “I want them to know my farm is more environmentally friendly than it was a decade ago or even five years ago and that it will only keep getting better.”
Contact Katie James at kjames@iasoybeans.com.
— Kevin McGrain, Hornick
McGrain farms no-till and uses cover crops and solar panels to improve his farm’s viability, profitability and environmental footprint.

Diving into soybean quality
Survey, campaign show U.S. soy advantage

BY BETHANY BARATTA
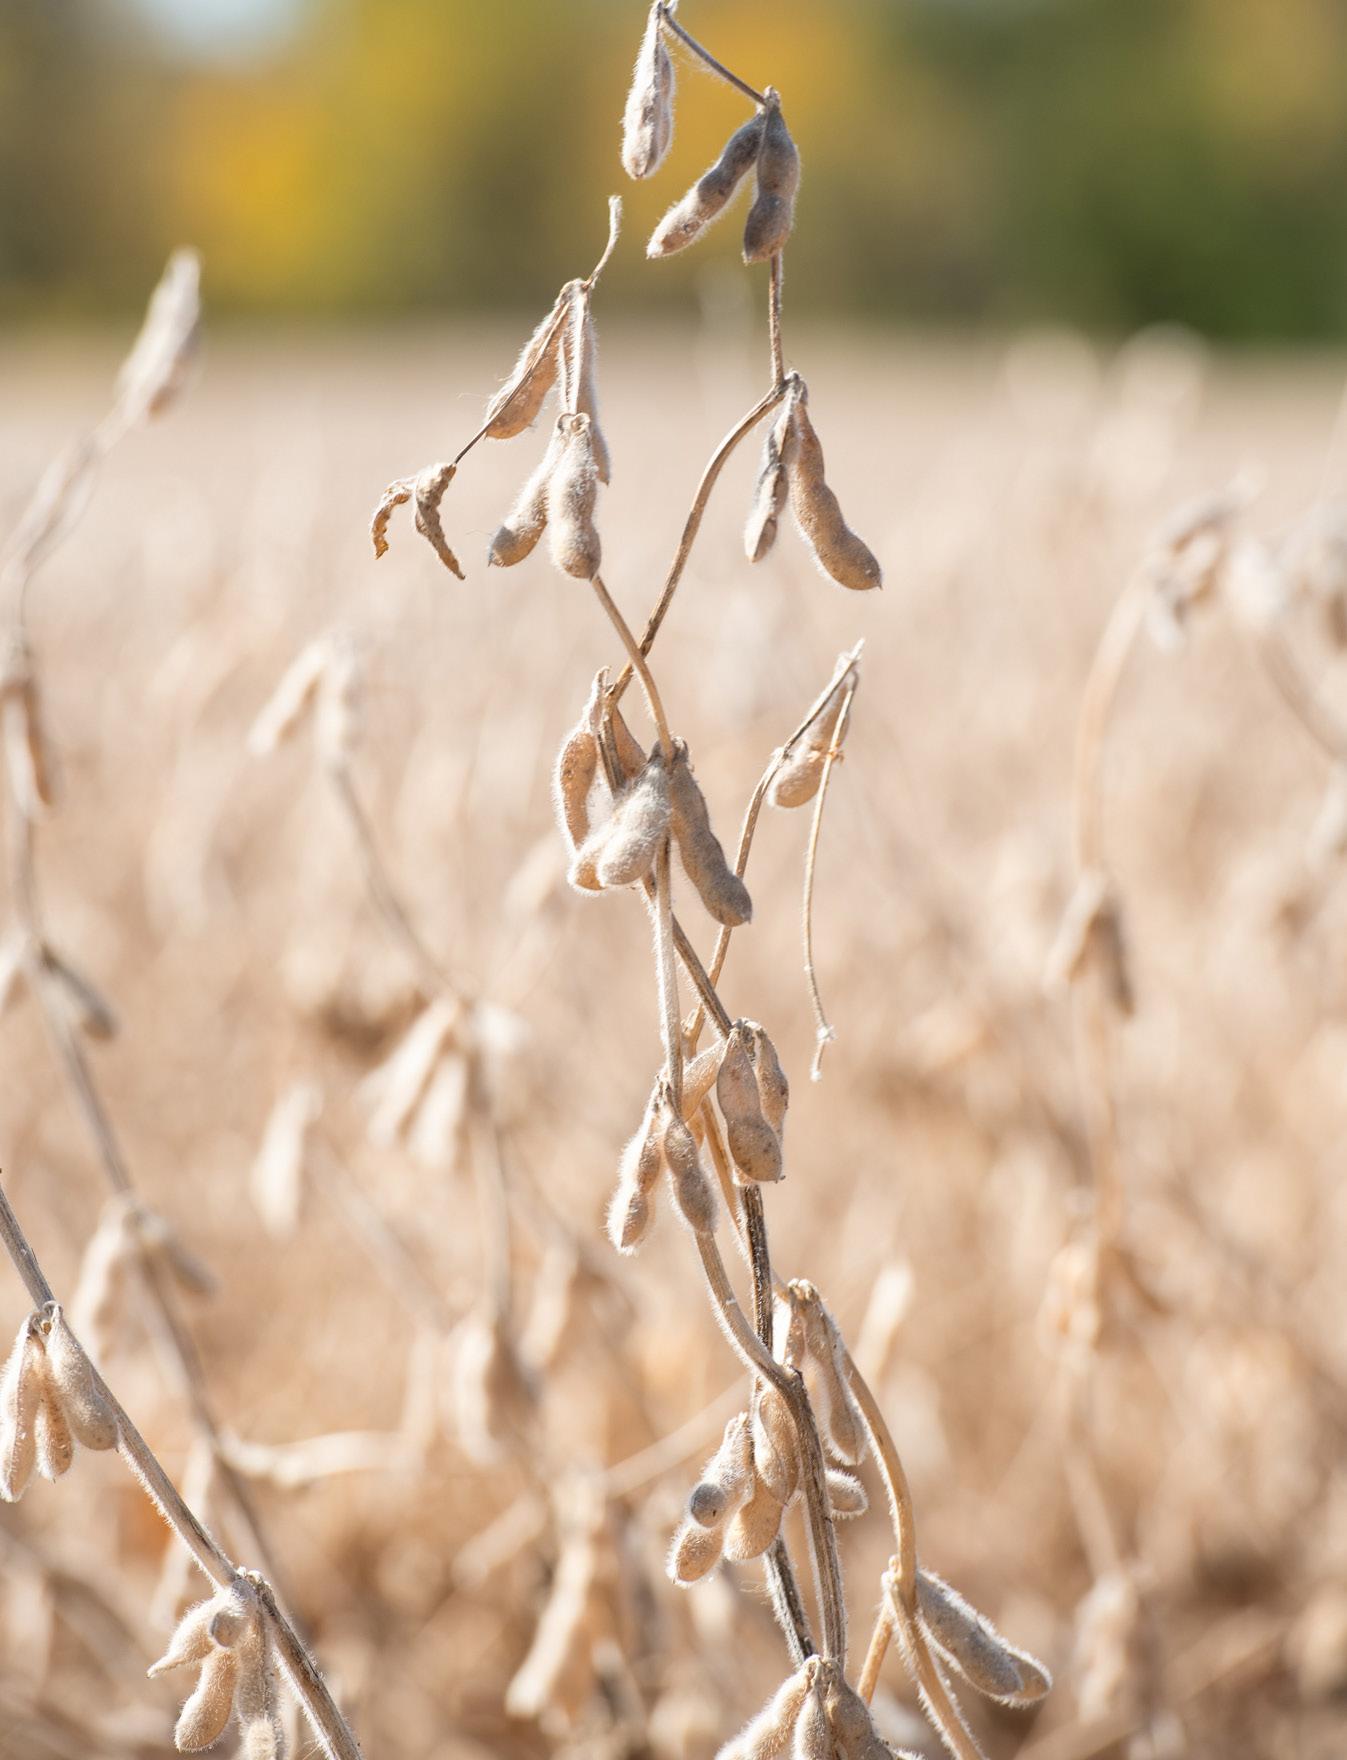
Soybeans contain protein and soybean oil. But the percentage of each component varies year to year depending on the geographical area in which the soybeans are grown and the weather during the growing season.
A survey conducted by the University of Minnesota seeks to analyze the quality of the U.S. soybean crop. It’s one tool used to show the rest of the world how the U.S. fares annually regarding protein, oil and amino acid concentrations.
Seth Naeve, associate professor and extension agronomist at the University of Minnesota, leads the efforts, sending paperwork and collection bags to selected U.S. soybean growers.
The 2020 soybean quality survey largely reflected the effects of the weather in the Midwest – too much moisture, not enough moisture and everything in between.
2020 results
Many of the 1,285 respondents to the survey noted their 2020 growing season began too wet and turned too dry during seed-fill stages.
“When excessive rainfall early is coupled with drought conditions late in the season, significant reductions in protein content are often noted,” Naeve says. “These conditions were widespread in 2020 and likely resulted in a large portion of the protein-to-oil shift.”
Naeve says protein and oil contents have an inverse relationship. When one value goes higher, the other goes lower. The results of the 2020 survey showed just that: lower protein content and higher soy oil concentration.
The average protein content in the 2020 soybean crop was 33.2%, down 0.9 percentage point from the 2019 survey average and down 1.1 points compared to the prior 10-year average.
Meanwhile, the average oil content for the 2020 soybean crop was 20.5%, up 1.5% from the 2019 crop. This was also up 1.6% compared with the prior 10-year average.
“Both protein and oil smashed alltime record values based on survey data going back 34 years,” Naeve says.
Average protein was nearly one percentage point lower than the previous low of 34.1% (found in 2008, 2017, 2018 and 2019). However, oil was nearly one percentage point higher than the previous record high of 19.8% set in 2015.
From the 206 samples sent from farmers in Iowa, the Iowa soybean crop averaged 32.8% protein, down from 33.5% in 2019. Oil content was 20.8%, up from 19.2% in 2019.
All survey respondents receive a postcard after the results are finalized showing how their sample stacks up with others in their growing region and the U.S.
Iowa Soybean Association (ISA) farmer-member Chris Gaesser’s sample was in line with the Iowa average, showing lower protein and higher oil content than his 2019 crop. He’s participated in the survey the past five years.
“I’m very pro-research in general, but I’m also interested in learning how our soybeans vary year to year based upon the variability in growing conditions,” says Gaesser, who farms near Corning.
The survey results are fascinating but don’t impact his planting decisions, he says.
“Until there’s some incentive to grow a specific quality or select for it, there aren’t a lot of reasons to change what we’re growing,” Gaesser says.
Survey history
The American Soybean Association, United Soybean Board and U.S. Soybean Export Council (USSEC) has supported the survey of the quality of the U.S. soybean crop since 1986. It’s intended to provide insight into off-the-farm new crop quality data to aid international customers with their purchasing decisions.
“It started as a way to give our global customers, particularly those in Japan, a snapshot of what they might be expecting to receive for the upcoming year,” says Paul Burke, senior director of U.S. Soy marketing for USSEC.
The information has been valuable to customers in Japan, where the U.S. has a 65% market share, according to USSEC.
Dare to compare

While customers look to Naeve’s survey as one of the first impressions of the quality of the U.S. soybean crop, he says there are other measures of soybean value and quality, which also help international buyers make their purchasing decisions.
USSEC conducted a survey of soybeans being loaded onto vessels for export, while also conducting the annual off-farm quality survey. The onvessel loading survey showed that U.S. soybeans averaged 34.24% protein and 19.34% oil.
The USSEC Dare to Compare global digital marketing campaign takes Naeve’s survey one step further in providing information to soybean buyers.
One component of the campaign shows the value of U.S. soy’s nutritional profile.
A new meta-analysis quantifying the relationship between country of origin and the chemical composition, protein quality and nutritive value of soybean meal demonstrates the U.S. soy advantage over Argentina, Brazil and India. It reaffirms the importance of considering country of origin when making purchasing decisions and formulating feed rations for swine and poultry diets.
The Nutrient Value Calculator built by Genesis Feed Technologies builds on nutritional data to help traders and buyers better analyze the economic value of soybean meal in global markets.
Feed millers should have great interest in this calculator as it factors in price, protein and other attributes like amino acids and energy. It’s a realtime comparison between various soy suppliers, Burke says. The calculator indicates that U.S. soybean meal could be a leading contributor to cost reduction in broiler diets.
When comparing cost reductions with incorporation of data from the meta-analytical study, premiums that can be earned by using U.S. soybean meal in feed production range from $14.57 to $23.24 per metric ton over Argentine soybean meal and $2.48 to $10.26 per metric ton over Brazilian soybean meal, according to USSEC.
“U.S. soy and soybean meal products offer a price advantage and rank first on a number of important nutritional attributes when compared to other origins, including remarkable amino acid and energy profiles,” Burke says.
Contact Bethany Baratta at bbaratta@iasoybeans.com.
Chris Gaesser notes that his soybeans were in line with the Iowa average for the survey, showing lower protein and higher oil.
Dare to Compare:
With higher sucrose levels, a well-balanced amino-acid profile, higher digestibility, increased metabolizable energy and lower fiber content, protein quality traits are better for U.S. soybean meal than from other origins.

