
Link: https://euanmearns.com/the-carbon-cycle-a-geologists-view/
Please see link above for source text.
The Carbon Cycle: a geologist’s view
Posted on October 10, 2014 by Euan Mearns
Executive Summary
1. IPCC AR5 carbon cycle model sees 8.9±1.4GtC emitted in a nonspecified year. 2.6±1.2GtC was sequestered in land biomass, 2.3±0.7GtC sequestered in the oceans mainly by plankton and 4GtC remained in the atmosphere. These numbers are estimates but seem to be a reasonable rendering of current understanding.
2. Since the beginning of the industrial revolution a total of 240GtC from human emissions have accumulated in the atmosphere while a similar amount has been sequestered by the non-permanent reservoirs of the deep ocean and terrestrial biomass, soils and biodetritus. What will be the fate of the emissions C in these nonpermanent reservoirs and of that which remains in the atmosphere?
3. The IPCC favour the Bern model for removal of C from atmosphere to sinks. This is founded upon the concept of reservoirs that have different “speeds of response” using 4 Taus (half life) of 1.2, 18.5 and 173 years and 1 Tau with infinity. The latter two represent 48% of emissions which basically says that 48% of emitted CO2 is going to hang around for a very long time. I am not aware of any physical basis for this approach which I argue is deeply flawed.
4. Emissions can be matched to the evolution of the atmosphere using a single exponential decay model with decline rate of 2.8%
representing a half life of about 24 years. If emissions can be modelled using a single exponential, why use 4?
5. The concept of “reservoir speeds” is flawed. The appropriate way to approach this problem is to look at the amount of C sequestered by individual reservoirs on an annual basis. This approach shows that annual primary production of marine life of 50GtC that exports 13 GtC to the ocean depths is far more significant in the short term than rock weathering that perhaps deposits 0.2GtC into the shallow ocean.
6. The concept that rock weathering by carbonic acid represents an important sink for CO2 emissions is a difficult one for a geologist to understand. All that this process does is to convert a relatively minuscule quantity of CO2 to HCO3 and deposits this in the ocean via river water. The CO2 simply takes a different route compared with direct absorption of CO2 into the oceans from the atmosphere where it is converted to HCO3 automatically by the pH equilibrium.
7. The deep oceans have far higher C content and lower pH than surface waters. This makes it virtually impossible for C to be absorbed into the oceans to be sequestered by the solubility pump that does not appear to exist at the present day apart from the initial solution of CO2 into surface waters as part of the annual atmosphere – ocean flux.
8. It appears that virtually all of the manmade emissions that are sequestered are removed by photosynthesis, trees on land and phytoplankton in the oceans. Land based sequestration is in live and dead biomass, biodetritus and soils. In the oceans, dead plankton sink quickly by gravity taking organic material and carbonate into the deep ocean where it is stored. It is relevant to ask for how long these sinks can go on absorbing ever larger quantities of CO2.
9. If emissions were to be switched off, the biological pumps would
continue working and would pump down atmospheric CO2 to preindustrial levels in around 120 years (5* the 24 year half life). The fate of the emissions stored in these temporary reservoirs is another issue. Rates of geological (permanent) removal appear to be very slow, roughly 0.4 GtC per year. And so it would take about 3250 years to remove a 1300 GtC slug of C. This “slow” process is removing C from non-permanent reservoirs, not from the atmosphere that will return to pre-industrial levels of CO2 quickly.
This post has grown out of a lengthy conversation with climate concerned commenter Dennis Coyne following my last post on this topic. We are trying to find the answer to two basic questions 1) where has the 56% of manmade emissions that have been sequestered gone? and 2) how long will the 44% of emissions that have accumulated in the atmosphere linger if emissions were to be switched off?
The latest IPCC carbon cycle model, which looks like a credible piece of work, is a good place to begin (Figure 1). In summary (all figures GtC per year for a non-specified year in the recent past):
In this post I question some popular beliefs surrounding fast and slow sinks, the solubility pump, the rock weathering sink and CO2 sequestration by ocean currents. I also dwell on the ocean carbon cycle that is dominated by biological activity where 11 Gt of organic carbon derived from plankton dies and sinks to the ocean depths every year! This is a lengthy and complex post where I lay my neck on the line on a number of issues.
When I began writing this post I was working off the Grid Arendal carbon cycle that I guess should now be viewed as an outdated cartoon. That model had so much wrong with it my blood pressure was up. I’m pleased to say that most of the concerns I had are addressed by the AR5 carbon cycle (Figure 1). And so part of the objective of this post is to provide a summary of the more up to date data and to try and lay to rest many misconceptions circulating in the minds of bloggers, journalists, politicians and I dare say some climate scientists. It is a vast and complex topic. It is inevitable that some of what I have to say will be wrong. Some of you may think it is all wrong
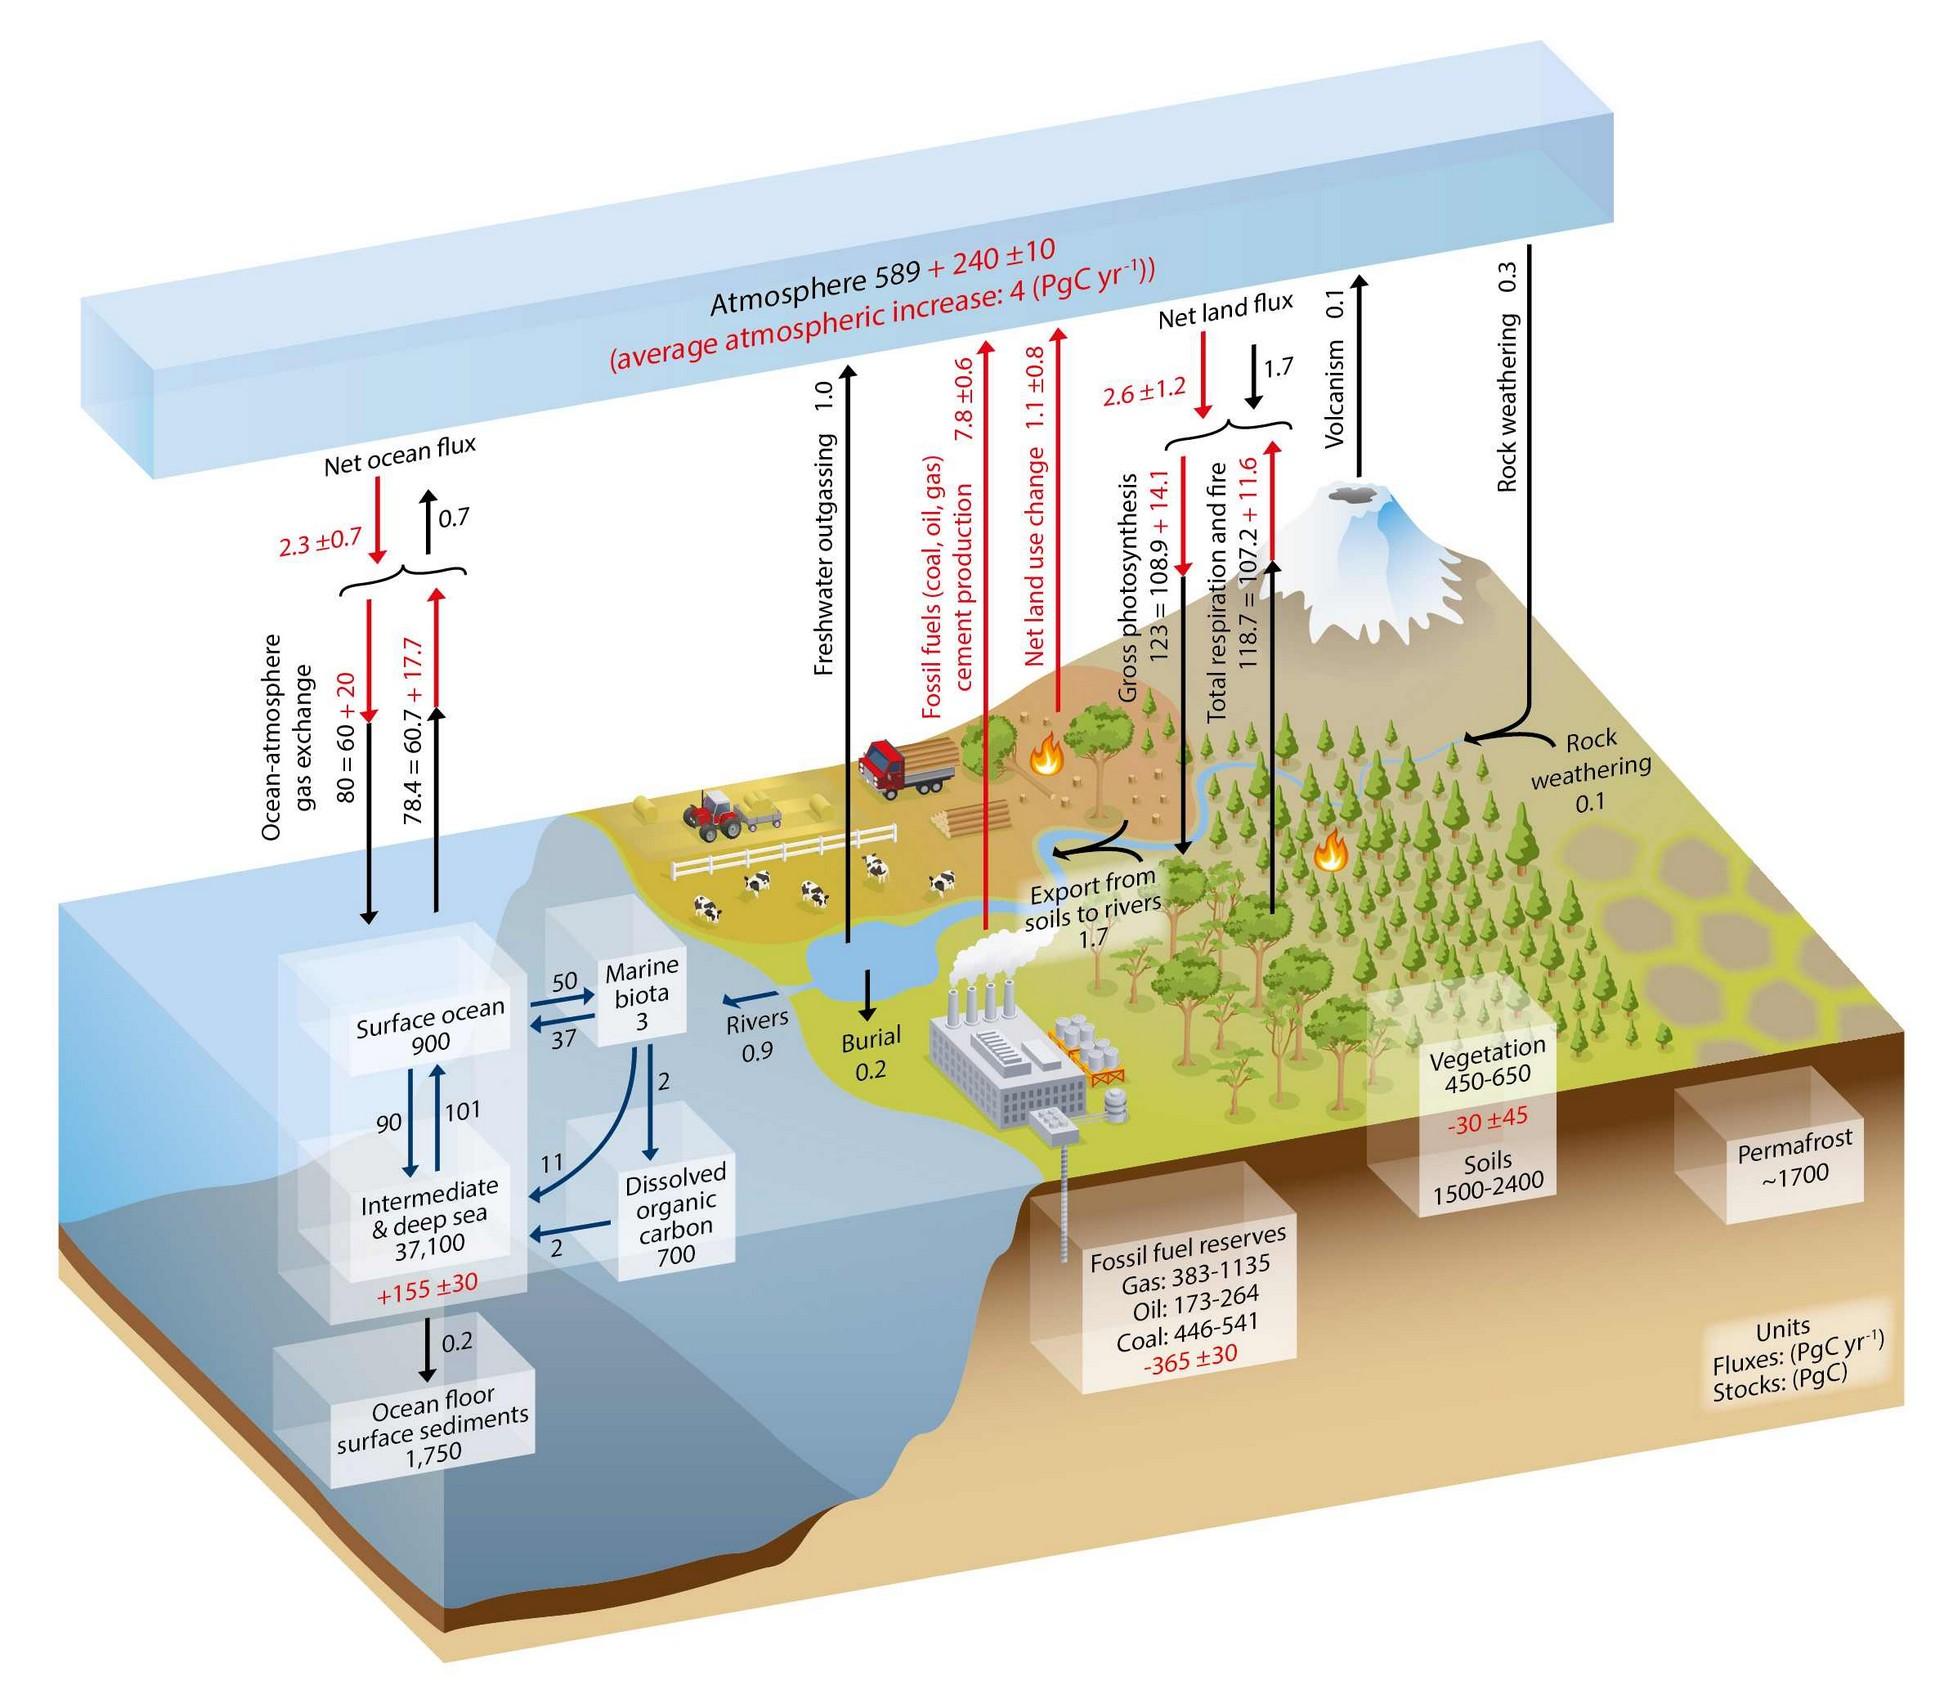 Figure 1 The carbon cycle from IPCC AR5.
Where have the emissions gone?
A good starting point is to understand that about 56% of manmade emissions have been sequestered and that even as emissions have grown, about 50% are sequestered every year. I am using the emissions and atmosphere model developed by Roger Andrews, considered superior to official data since it combines emissions from fossil fuels, cement and deforestation. Roger’s model runs from 1910 to 2010. Because of the complexity of carbon geochemistry (next section) it is also convenient to express all numbers as billions of tonnes of carbon (GtC) as opposed to CO2. All numbers are approximate.
Atmosphere 1910: 640 GtC
Atmosphere 2010: 828 GtC
Increase 1910 – 2010: 188 GtC
Emissions 1910 – 2010: 425 GtC
Sequestered emissions: 425-188 = 237 GtC = 56% of total emissions for the period
And what are the active sinks and their sizes:
Terrestrial vegetation (trees): 450 to 650 GtC
Soils and bio-detritus: 1500 to 2400 GtC
Marine organisms: 3GtC*
Surface ocean water: 900 GtC
Intermediate and deep oceans: 37,800 GtC
Atmosphere: 829 GtC
Total: 41,482 to 42,582 GtC
Total less atmosphere: 40,653 to 41753
* 3 GtC marine organisms alive at any one time masks a gigantic 50GtC annual productivity.
The total emissions 1910 to 2010 represent 1.0% of all sinks and sequestered emissions of 237 GtC represent 0.6% of all sinks excluding atmosphere. Emissions are relatively tiny compared with the size of the sinks. Whether or not the deep oceans are a potential sink for removal of man made emissions is clearly an important part of the story.
The carbon dioxide – bicarbonate continuum
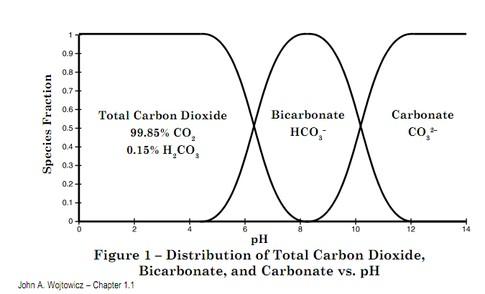
Carbon dioxide – carbonate geochemistry is complex and to be honest I don’t fully understand this myself. I’m not sure many people do. Four main chemical species are involved:
carbon dioxide: CO2
carbonic acid: H2CO3
bicarbonate: HCO3-
carbonate: CO3–
The reaction goes:
CO2 + H2O = H2CO3 = HCO3- + H+
The reaction can go either way, from left to right or from right to left. The equilibrium is dependent upon temperature, pressure and pH (acidity). Note the production of an H+ ion that is the cause of concern in ocean acidification. In the surface ocean environment it is pH that exerts main control and Figure 2 shows that ocean surface pH of around 8 strongly favours the bicarbonate species often referred to as dissolved inorganic carbon or DIC.
ions. The deeper oceans have pH approaching 7 where a little CO2 will coexist with bicarbonate.
MYTHS AND MISCONCEPTIONS
The Misconception of Fast and Slow Sinks
If we look at the oceanic part of the Grid Arendal Carbon Cycle (Figure 3) we see three different kinds of data 1) the size of Carbon reservoirs in GtC , 2) the flux between the reservoirs in GtC and 3) the rate of process denoted by colour (See Figure 2). The rate of process is a link between the size of the flux and the size of the reservoir – fair enough. The flux figures are all per annum and so in fact the amount of CO2 exchanged each year between the atmosphere and ocean surface is about the same as between surface and deep water. These two processes are operating at the same rate, its just that the deep ocean cycling is slow compared with the vast size of the reservoirs involved. This kind of representation and others like it have perpetuated the misconception of sinks operating at different speeds.
As far as I can tell from looking at the AR5 carbon cycle virtually all CO2 is removed from the atmosphere by photosynthesis (trees and phytoplankton) and sequestered emissions are being stored in the active nonpermanent sinks. The rate of permanent removal from those nonpermamnent sinks is so slow (geological) it can all but be ignored for human time scales. The question boils down to for how long can the nonpermanent sinks go on absorbing manmade emissions?
The Myth of The Solubility Pump
I have always understood there to be two main marine processes for the removal of CO2 from surface to greater ocean depths. The first being the biological pump and the second being the solubility pump. Houghton in fact devotes little space to describing these processes on pages 32 to 36 of his book [1]. For the solubility pump I envisaged either diffusion leading to surface C being pumped away or mechanical mixing processes burying C laden surface waters in the depths.
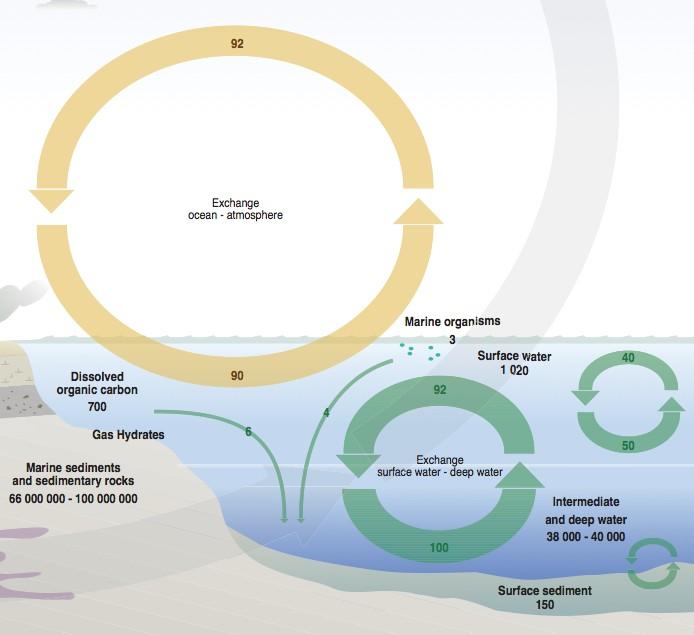 Figure 3 The ocean carbon cycle according to Grid Arendal.
I was consequently fairly surprised to learn that the deeper ocean layers have considerably higher C contents than the surface. This is particularly so for the Pacific Ocean that is significantly different to the Atlantic Ocean (Figure 4). Not far below the surface of the Pacific Ocean we in fact encounter water with pH below 7.3 – it is almost acid! (see also Figure 5). The reason for this is rotting marine organic matter at depth the dissolution of carbonate rain from the surface (see below).
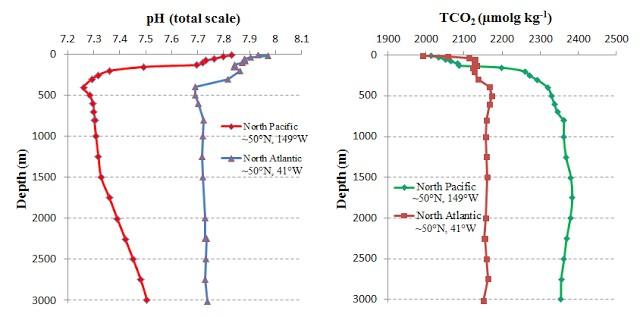
Diffusion normally works from high to low concentration, hence it is impossible for diffusion to remove C from the surface since deeper waters have the higher content.
Furthermore, mixing shallow with deeper water will inevitably result in an increase not a decrease of the C in the surface layer. I may stand to be corrected but I cannot see how C in solution in surface waters can be sequestered into deeper waters by a solubility pump.
The Myth of The Rock Weathering Sink
It seems to have become engrained in the folk lore of climate science that weathering rocks somehow creates a sink for CO2. The first time I read about this some years ago in a paper by J. Hansen I didn’t understand it and I do not understand it today. The storyline goes CO2 combines with water to make carbonic acid that weathers rocks and is subsequently fixed into river water as calcium bicarbonate ions and shortly thereafter gets
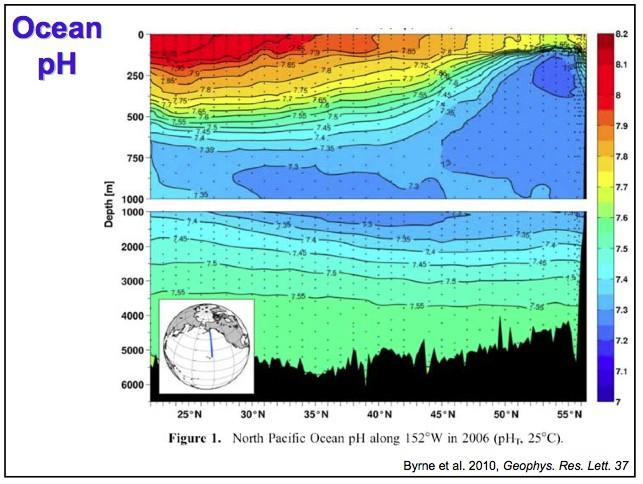 Figure 5 Pacific Ocean pH with depth along a transect from Alaska (right) to Hawaii (left). Note different depth scales on upper and lower panels. The upwelling of low pH deep water is I believe “the far end” of the oceanic thermohaline circulation (Figure 6) [3]. Deep water upwelling such as this brings vital nutrients for plankton from the deep ocean into surface layers. Note that the source of this image is a teaching pdf that contains many great slides.
dumped in the sea. The flux is small, around 0.4 GtC (gross) according to IPCC AR5. This gets blown into a huge amount by integrating the effect over geological time. I contest that this is not valid. The correct approach is to compare the size of the annual flux with other processes. Rock weathering merely moves a tiny quantity of CO2 from atmosphere to ocean via a different route. Furthermore, since speciation is pH dependent, and waters associated with silicate bedrocks are often acid, it is not clear to me that the bicarbonate ion would be favoured.
The AR5 carbon cycle does in fact show 1GtC per annum being released back to atmosphere from the riverine flux (freshwater outgassing). The riverine system works as follows:
Rock weathering: 0.4 GtC
Export from soils to rivers: 1.7 GtC
Total input to rivers: 2.1 GtC
Freshwater outgassing: 1 GtC
Burial in estuaries and deltas: 0.2 GtC
Export from rivers to oceans: 0.9 GtC
Total export from rivers: 2.1 GtC
Half of the rock weathering component seems to go straight back into the atmosphere and the approximate 0.2 GtC that makes it to the sea is insignificant compared with the ±80 GtC ocean-atmosphere and ±120 GtC biosphere-atmosphere exchanges. I find it hard to conceive how rock weathering, a process that accounts for 0.1% of the annual carbon cycle has been elevated by climate scientists to be one of the most important controls on Earth’s CO2 budget and temperature history.
What rock weathering does do is to liberate cations into solution that may eventually become the salt in sea water or the Ca in limestone. But there are a host of weathering processes that can do this, for example the hydrolysis of plagioclase feldspar to the clay mineral kaolinite. Much of rock weathering in fact takes place as a result of soil formation where organic acids released by tress play a crucial role.
Totally absent from the rock weathering debate is the potential liberation of
CO2 from the vast C reservoir that rocks contain. Grid Arendal sees between 66,000,000 and 100,000,000 GtC in those sinks, the biggest number by far on the chart. Bacterial processes for example consume C and produce CO2.
The Myth of Ocean Currents Sequestering CO2
Time to bust a myth that I myself flirted with recently (though I never stated this explicitly) and that is that oceanic thermohaline and meridional overturning may remove C laden waters from the surface and bury them at depth. You just need to look at Figure 4 to see how impossible this concept is. For a start, surface waters are depleted in C relative to deep waters. The oceanic carbon cycle (Figure 1) shows that overturning of deep to shallow waters introduces 11 GtC from deep to shallow layers each year instead of removing it. Oceanic circulation in general may sequester surface water depleted in C in the seas between Norway and Greenland but these return to surface as deep waters enriched in carbon and other nutrients in the Indian and Pacific Oceans (Figure 6). Upwelling of deep low pH, nutrient enriched waters is a key part of the biological pump component of the ocean carbon cycle (see below).
DISCUSSION
The Ocean Biological Pump
The representation of the ocean biological pump [4] shown in Figure 7 bears important information. It shows 3 Gt organic carbon in the surface ocean and this tallies with the number in the AR5 carbon cycle (Figure 1). But it also shows net primary production of 50 Gt per year and net export of 10 Gt C per year. This is shown in Figure 1 as the 50Gt per annum transfer from surface water to marine biota. The Tau (half life) for surface ocean C is only 0.06 years – 22 days! This is not the Amazon forest, growing slowly over centuries but an extremely rapid turn over of microscopic plankton.
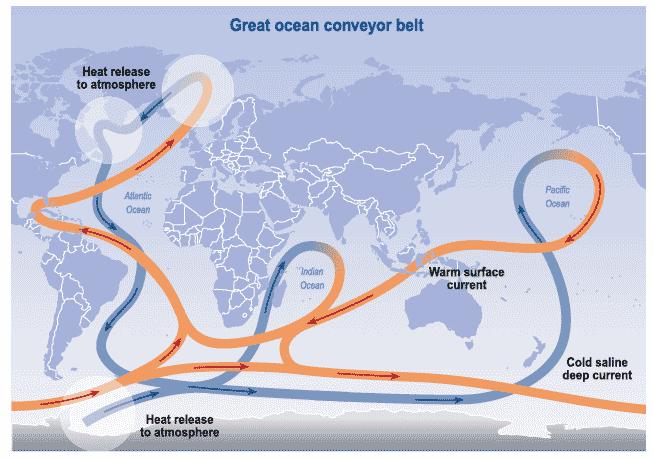 Figure 6 Oceanic thermohaline circulation. Source is UK Met Office.
According to this scheme the surface oceans never contain more than 3 Gt organic carbon and yet they export 10 GtC per year brought about by the extremely fast cycle of growth, death and removal of dead organisms mainly by gravity.
There are two main types of plankton in the oceans that form the base of
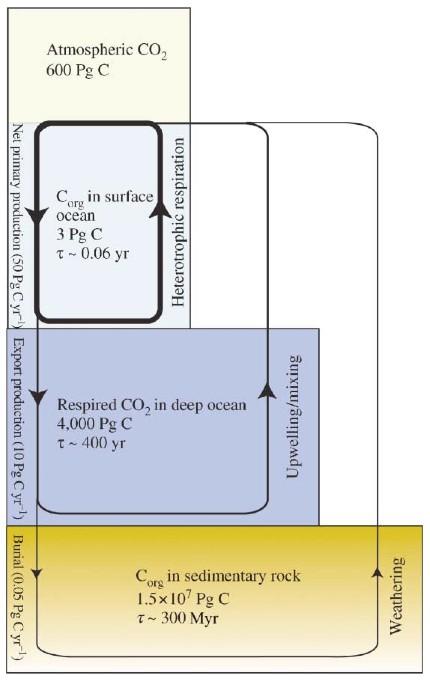 Figure 7 The ocean biological pump from Sigman and Haug [4].
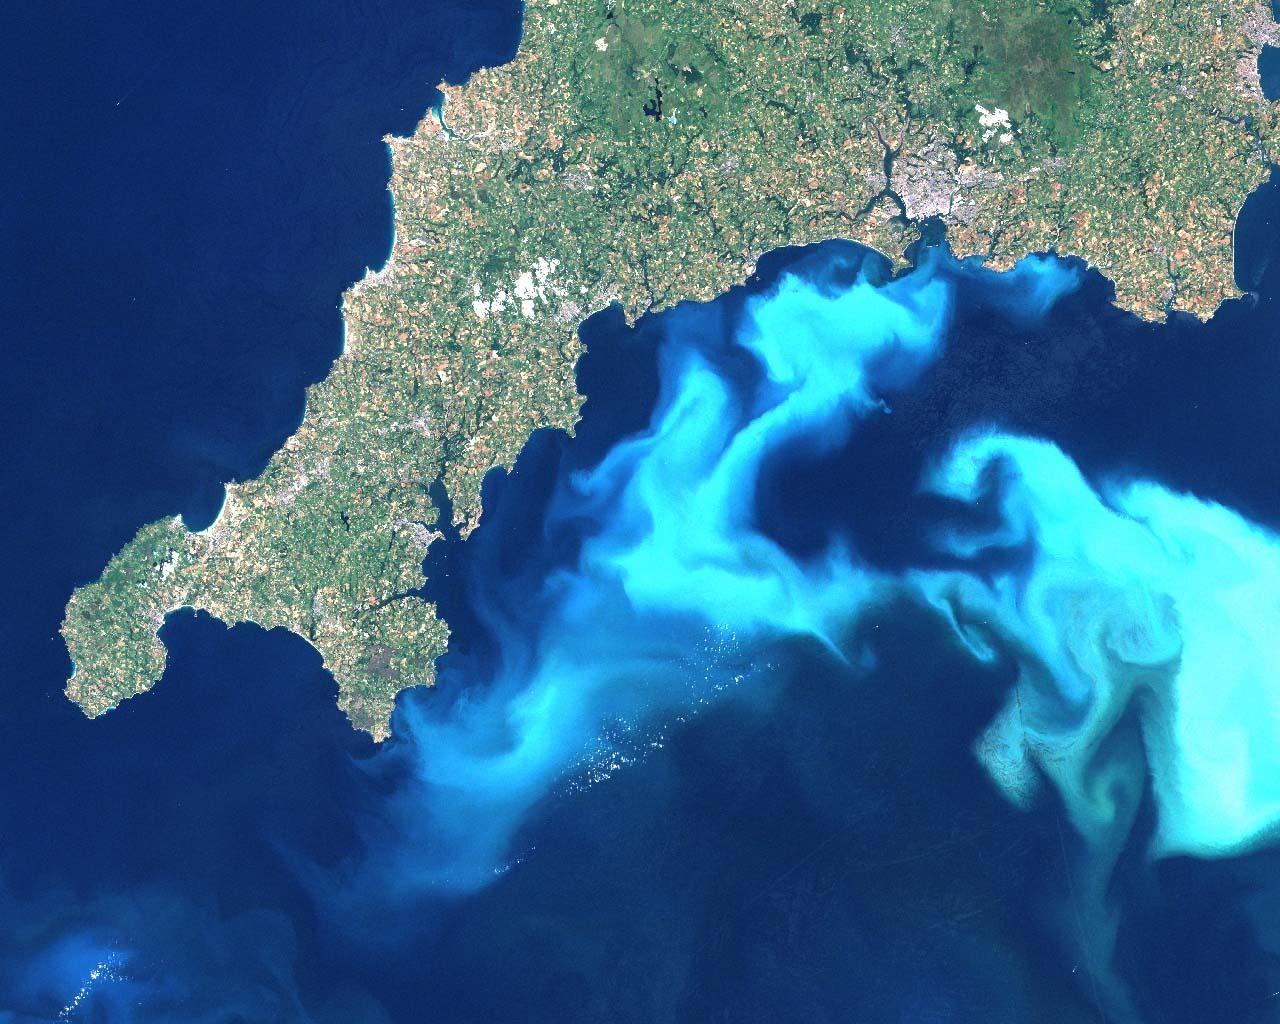
the food chain. Phytoplankton (Figure 8) contain chlorophyll and fix CO2 from the upper ocean layer via photosynthesis and they are considered to be plants. Zoo plankton eat the phytoplankton. Ocean algal blooms are one manifestation of phytoplankton growth (Figure 9). The deeper ocean is subject to a continuous rain of this dead organic and carbonate material that locks atmospheric C into microscopic creatures that die and sink evidently transferring about 10 GtC from upper to deeper ocean layers each year. That is a large amount!
“Phytoplankton are singlecelled, free-floating, non-swimming plants. Zooplankton, which consist of small animals and the larval forms of invertebrates and fish, together with phytoplankton make up the group called plankton. The predominant forms of phytoplankton are diatoms, golden brown algae, green algae, blue green algae, and dinoflagellates. Over 20,000 species of diatoms alone exist in the world. They have an exoskeleton composed of silica and have no means of locomotion.” Source.

Figure 9 Given right conditions, algae (phytoplankton) sometimes grow out of control to produce blooms that can be harmful. But they do remove large amounts of CO2 from surface waters. The image shows an algal bloom off the SW coast of England.
There is in fact major uncertainty over the size of this flux. The UK National Oceanographic Centre (NOC) saying [5]:
The biological carbon pump is a major term in the global carbon cycle, transferring approximately 5-15 GT C yr-1 from the surface ocean to the oceans interior (Henson et al., 2011). It is of comparable magnitude to the annual increase in CO2 in the atmosphere driven by anthropogenic remobilisation of fossil fuel reserves and without it we believe that atmospheric CO2 would be order 200ppm higher (Parekh et al., 2006). Small changes in its functioning and or strength could radically affect
ocean atmosphere partitioning of CO2.
AR5 sees 13 GtC, Sigman and Haug see 10 GtC per year and NOC sees a range of 5 to 15 GtC transported from surface to deep ocean each year. Compared with annual emissions of 9Gt, the uncertainty here is quite significant. So much for settled science. The whole picture is made more complicated by annual returns from the depths to surface that cancel much of the biological removal of C. But the main conclusion is that this process is fast, driven by photosynthesis and is storing some emissions (2.3±0.7 GtC per year) in the vast non-permanent reservoir of deep ocean water.
One aspect of the Sigman and Haug scheme shown in Figure 6 that I don’t fully understand is the bottom panel showing 15,000,000 Gt organic carbon in sedimentary rocks. That’s fine. And they also show a return to atmosphere of some of that C which tallies with what I say above must happen. It is the rate of the burial process that I don’t understand. They show 0.05 Gt organic carbon per year being sequestered by ocean sedimentation which seems far too low. The AR5 carbon cycle has a figure 0.2GtC sequestered to the oceans and another 0.2 GtC sequestered in deltas. These numbers seem very low and so I did a cross check on geological sedimentation rates to find that these figures for geological burial are in fact quite high. One concern must be that removal of emissions from non-permanent reservoirs into the geological record occurs on geological time scales that are too long to be relevant to Mankind.
Models for the sequestration of CO2
The Bern model, favoured by the IPCC, is based on sinks acting at different speeds removing CO2 from the atmosphere which I have already argued is an invalid approach. From the preceding it is possible to see that the 1.2 and 18.5 year Taus are perhaps representations of the “fast” oceanic biosphere and terrestrial biosphere pumps (see below). But as far as I can tell these fast photosynthetic processes are responsible for the removal of virtually all CO2 from the atmosphere into non-permanent reservoirs –plants, soils, bio-detritus and deep ocean water.
It seems to have become engrained in the folklore of climate science that manmade CO2 emissions may linger for many millennia in the atmosphere [6]. I do not know what evidence exists to support this notion. The scientific logic hurdle that needs to be overcome is how one views the 44% of emissions to date that have not been sequestered. The Bern view seems to be that they are hanging around waiting for “slow processes” to grab them. My view is that photosynthesis is rate / capacity limited and has not yet had time to grab them. Stop emissions today and photosynthesis will draw down the 44% of emissions that linger in the atmosphere long before glacially slow rock weathering has the chance to do anything meaningful.
The pressing question today is for how long can these non-permanent reservoirs go on absorbing ever larger quantities of carbon since permanent sequestration of organic matter into mudrocks and bicarbonate into limestones appears to take place so slowly so as to not be significant on human, multi-century time scales?
If we consider a pulse of Carbon about 1,300Gt is size (comment by Dennis Coyne) being human emissions and just over half of this will be absorbed by these non-permanent sinks over the time span that the pulse is emitted and the remainder will be absorbed in the decades following the cessation of emissions. Can the deep ocean absorb 610Gt of carbon? With a reservoir that is already 41,000 Gt it would seem to me that adding an additional 1.5% should be no major challenge.
The terrestrial biomass side of the story is perhaps not so straightforward where the reservoirs are perhaps 2500 GtC. Absorbing an additional 690Gt would represent an uplift of 28% in that C budget. Is it possible for trees to simply double in size under the influence of CO2 fertilisation? And the terrestrial bio-mass side of the story is already in difficulty owing to deforestation. IPCC AR5 actually sees a net reduction of 30Gt in that non-
permanent store since pre-industrial times even although 2.6Gt are being sequestered via that route every year for the time being (Figure 1).
It should be abundantly clear that every effort needs to be made to halt or even reverse deforestation at all levels on Earth. Carbon stored in a living tree is carbon stored. Carbon stored in a fallen tree is carbon stored some of which will enter the longer lived store of bio-detritus. The carbon stored in our forests is little different to that stored in fossil fuel – it has simply been removed from the atmosphere more recently. The BIG difference between burning wood and burning coal is that the tree had the possibility to grow bigger and to remove even more carbon from the atmosphere. The practice of clearing hardwood forests to generate electricity that is labelled ‘Green’ has to be one of the most crazy policies ever devised by the Green movement. Second only to clearing forests to grow biofuel in Brazil and Indonesia.
How long will manmade emissions linger?
This series of posts on the carbon cycle began with Roger Andrews pointing out that emissions can be matched to what has actually happened in the atmosphere (Mauna Loa) using a single exponential decline function [7]. If emissions appear to fit a single exponential decline why seek a more complex explanation? Phil Chapman introduced an interesting concept based on equilibrium distribution of increased carbon between the various active sinks. At that time, the very large deep ocean sink was not in our minds active whilst in fact it appears to be one of the main destinations for emissions. Adding the deep ocean to the equilibrium distribution model makes any residual manmade CO2 in the system trivial.
Figure 10 shows what would have happened to emissions had we switched off combusting fossil fuel in 1995 according to my (and Roger’s) model. The biological pumps, energised by elevated CO2 levels, would keep pumping and would quickly draw down atmospheric CO2. But their effect declines exponentially as the PCO2 in the atmosphere is drawn down by their action.
Figure 10 The chart shows annual additions of emissions since 1965, based on Roger Andrews’ emissions model that has a component for deforestation, and how they decline. The wedge at the bottom is the pre1965 emissions stack. A 2.8% per annum exponential provides an excellent fit between atmosphere and non-sequetered emissions. The black line shows how the atmosphere actually evolved. The red arrow shows how the atmosphere would have evolved had emissions been switched off in 1995. According to the IPCC Bern model if emissions were switched off then the atmosphere would move side ways following a horizontal trajectory. It is not at all clear to me why the processes that were sequestering the pre-1995 emissions should suddenly stop doing so if
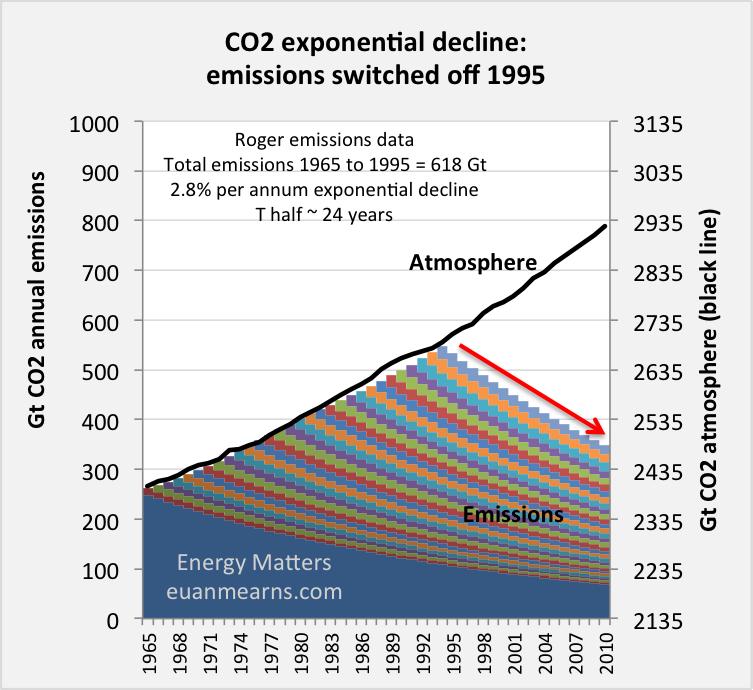
emissions were switched off.
The “best fit” single exponential for my model has a half life of 24 years and following the rule of thumb that after 5 half lifes most of the perturbation is consumed I will assert that the atmosphere will have returned close to preindustrial levels in 120 years post switching emissions off. At this point it is possible to build a bridge towards Bern and IPCC since in this model virtually all emissions are stored in non-permanent sinks. The AR5 carbon cycle sees only 0.4GtC per annum going into long-term geological storage. Thus, a 1300 GtC “pulse” may take 3250 years to eventually be removed from the non-permanent active sinks “forever”. That is quite a long time in which mishaps may occur. Much would depend upon the stability of equilibrium. It is possible to envisage forests grown fat on the CO2 binge, having problems when the nutrient supply gets switched off. A forest dying may return emissions CO2 to the atmosphere before it becomes geologically sequestered. But this would be a self regulating process since the increase in atmospheric CO2 that this may cause would prevent other forests dying elsewhere. In the oceans I suspect that rotting organic matter, given time, will become part of deep marine mudstones.
Up to the point when emissions are switched off 56% of all prior emissions are already sequestered into the non-permanent reservoirs. I can think of no reason why the biological processes active before 1995 should somehow stop working. The pre 1995 emissions that remain in the atmosphere would continue to be sequestered at the same rate as before, i.e. 2.8% per annum, drawing down the atmosphere to pre-industrial levels after about 120 years.
References
[1] Houghton Global Warming, The Complete Briefing
[2] Fun with Krill
[3] Hawaii.edu Teaching slide deck – well worth a look!
[4] The Biological Pump in the Past D. M. Sigman and C. H. Haug
[5] UK National Oceanographic Centre
[6] David Archer: Fate of fossil fuel CO2 in geologic time
[7] Roger Andrews The residence time of CO2 in the atmosphere is …. 33
years?
Share this: LinkedIn
More This entry was posted in Climate change and tagged algae, bern model, carbon cycle, CO2, emissions, ipcc, land biomass, ocean acidification, phytoplankton, plankton, rock weathering, solubility pump. Bookmark the permalink.
Cycling Coal to Balance Electricity Grids
24 Responses to The Carbon Cycle: a geologist’s view
Blowout week 41 →
Peter Shaw says:
October 10, 2014 at 1:09 pm
Your Fig 1 has a small but important omission. I’ll simplify the chemistry slightly for the general reader.
Most of the Earth’s solid surface is basalt rock (the seabed). A major mineral in this is forsterite (a magnesium silicate). Alteration of forsterite by water produces several minerals, including brucite (magnesium hydroxide).
In natural waters, this strips dissolved CO2, with end-product some form of limestone.
(Water from submarine mud volcanoes associated with ocean trenches can have a remarkably high pH.)
If the AR5 diagram includes terrestrial volcanic emissions, it should also include this geochemical sequestration.
Geology teaches of episodes of flood-basalts, probably deposited where rapid weathering can occur. As this chemistry is well capable of
stripping all CO2 from the air, it shouldn’t be discounted.
Euan Mearns says:
October 10, 2014 at 2:43 pm
Hi Peter, I remain skeptical that weathering of sub-areal basalts would actually sequester any CO2 but rather dump HCO3- into runoff where it becomes indistinguishable from the HCO3already in the ocean. And as you know much of the basalt on the ocean floor is covered by ocean floor sediments, probably too far removed from seawater to have any impact. But basalts when they are extruded at mid ocean ridges are a completely different matter where we have large scale hydrothermal systems pumping seawater through the newly formed ocean crust. Do you know if carbonate mineralisation is common in that environment? I did a quick search and did find some references to carbonate mineralisation in ophiolites. If you had any mineral / chemical reactions to share I’d be interested to see them. Carbonate mineralisation of mid ocean ridge basalts, if it takes place, would be a real sink, removing CO2 / HCO3 – from seawater and locking it away. Carbonate mineralisation within ocean sediments (diagenesis) is another possible process.
Peter Shaw says:
October 10, 2014 at 5:16 pm
Euan –
The usual alteration sequence is olivine -> serpentine -> talc, where MgO:SiO2 ratio is (resp) 2, 1.5 & 0.75. So MgO (as hydroxide) is produced at each step. The hydroxide (brucite) is found in sea-bed cores around ridges low in the alteration zone, where you would expect it (ref. mislaid, sorry).
Magnesium carbonate is (relatively) soluble, but as seawater also contains calcium (as temporary hardness)
the end-product is eg dolomite, which isn’t. This carbon cycle has a period of ~1E7 yrs, so might be the Bern “infinity”.
Although generally slow, this sequestration can locally be fast (as you imply for hydrothermal regions).
Consider the numbers: 25000 km of MOR times 500m fracture depth times 5cm/yr spreading is a lot of potential sequestration.
I see debate about how much CO2 is introduced via undersea volcanoes, but none on the removal which must accompany it.
I think your Fig 1 (ex AR5) is incomplete.
Rui N Rosa says:
October 10, 2014 at 2:11 pm
Thanks for this comprehensive study. Very relevant issues to me. I refer to te Executive Summary:
Point 6:
Comment: CO2 dissolves carbonate rocks, for instance openning up caves and carving karstic landscapes –
http://geomaps.wr.usgs.gov/parks/cave/karst.html
http://geomaps.wr.usgs.gov/parks/cave/karst.html – insoluble carbonates becoming soluble bicarbonates such that every atmospheric CO2 molecule carries an extra molecule of CO2 by underground or susface water to sea. But in silicate rock (mostly eruptive either plutonic or volcanic) silicates are converted from insoluble silicates to insoluble carbonates – and “free” CO2 is replaced by the mostly abundant SiO2 (sand, sandstones). Thre is no runoff. This natural weathering processes is thought to be a promising path to accelerate the geological sequestration of CO2 into basalts and ultramafic rocks. The extent of the ongoing natural process is difficult to quantify (missing sink?!).
Point 7:
Comment: It is necessary that the deep ocean is saturated in CO2 to maintain the continuous sedimentation of organic and inorganic
carbon by combination of biological pumping and gravity – to form many of the sedimentary rocks we find all around and are permanently being produced.
Point 9:
Comment: CO2 is continually sent into the atmosphere from the crust and the mantle, through techtonic activity either volcanic or diffuse. Most of it derives from the breakup of carbonate sedimentary rocks, which are converted into silicate rocks in subduction zones, closing the geological branch of the carbon cycle. Much of that CO2 is emmitted in the oceanic ridges and volcanic arcs.
Thanks and Regards
Euan Mearns says:
October 10, 2014 at 3:01 pm