4 minute read
No Reliable Scientific Evidence Supporting the Proposed Rule


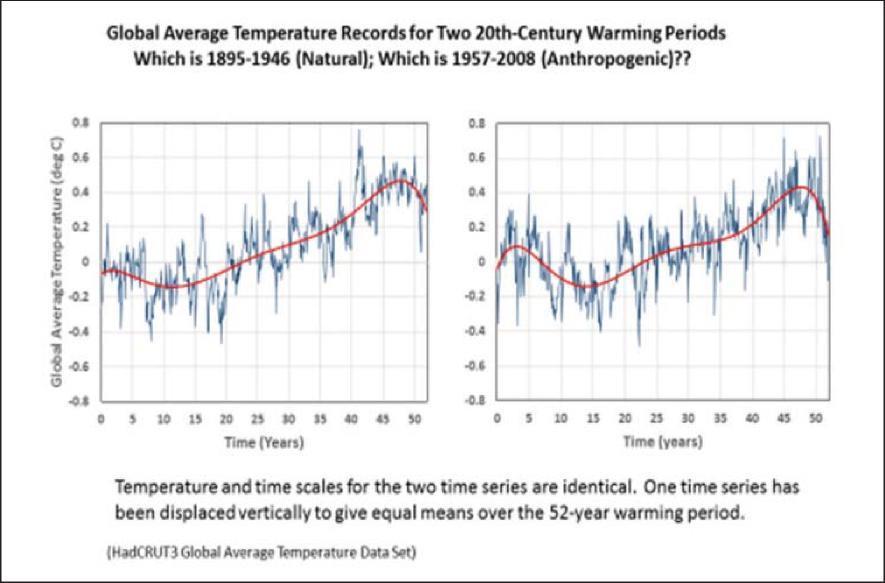
since the late 1980s, shown below: 5 I (Prof. Lindzen) show two recent warming periods, one 1895-1946 on the left and the second 1957-2008 on the. right.6 Both look nearly the same.
However, increased CO2 could not be responsible for the warming on the left between 1895-1946 because there was so little fossil fuel and other human CO2 emissions during that time, as the chart above shows. Fossil fuel emissions were trivial then. Accordingly, using scientific method, this data is another contradiction of the theory that higher fossil fuel CO2 emissions will create catastrophic global warming. It’s yet further proof that there is no climate related risk caused by fossil fuels and CO2, and thus further demonstrates is no reliable scientific evidence supporting the proposed rule.
E. The IPCC CMIP and Other Models Fail to Reliably Predict Temperatures, Thus
Confirming There is No Reliable Scientific Evidence Supporting the Proposed Rule
As noted, nowhere in the 500+ pages of the proposed rule is there any explanation of the scientific basis of the rule. Instead it states, for example: “Several commenters referred to various reports by the Intergovernmental Panel on Climate Change (“IPCC”) to demonstrate that there is scientific consensus that climate
5 Boden, T.A., G. Marland, and R.J. Andres. 2017. Global, Regional, and National FossilFuel CO2 Emissions. Carbon Dioxide Information Analysis Center, Oak Ridge National Laboratory, U.S. Department of Energy. 6 Lindzen, “On Climate Sensitivity,” CO2 Coalition (Dec. 2019), p. 13.
change is the result of global warming caused by human-induced emissions of greenhouse gases and poses significant global risks.” 87 Fed. Reg., p. 21339 (emphasis added). As noted, consensus has no value as reliable scientific evidence Scenario analysis is one of the ways suggested to comply with the proposed SEC rule: “We note that there are a number of publicly-available climate-related scenarios that could form the basis of a registrant’s scenario analysis….If a registrant uses scenario analysis to assess the resilience of its business strategy to climate-related risks, investors may benefit from the use of scientifically based, widely accepted scenarios, such as those developed by the IPCC, International Energy Agency (“IEA”), or Network of Central Banks and Supervisors for Greening the Financial System (“NGFS”)”, and that “The TCFD [Task Force on Climate-Related Financial Disclosures] has summarized a number of publicly available scenario analysis models.” 87 Fed. Reg., p. 21357 (footnotes omitted). It is not practical to discuss all these references, so this comment is focused on the IPCC because it is the single most cited source of the theory that dangerous global warming is caused by human emissions of fossil fuels, CO2 and other greenhouse gases. The IPPC is also, the dominant source of the models used in scenario predictions of dangerous climate warming. However, the IPCC CMIP models (Coupled Model Intercomparison Project) do not reliably predict temperatures and therefore should be rejected under basic scientific method, demonstrated next. CMIP5. John Christy, PhD, Professor of Atmospheric Science at the University of Alabama, applied the scientific method to CMIP5 102 predictions of temperatures 1979-2016 by models from 32 institutions. He explained he used “the traditional scientific method in which a claim (hypothesis) is made and is tested against independent information to see if the claim can be sustained,” and produced the following chart:7
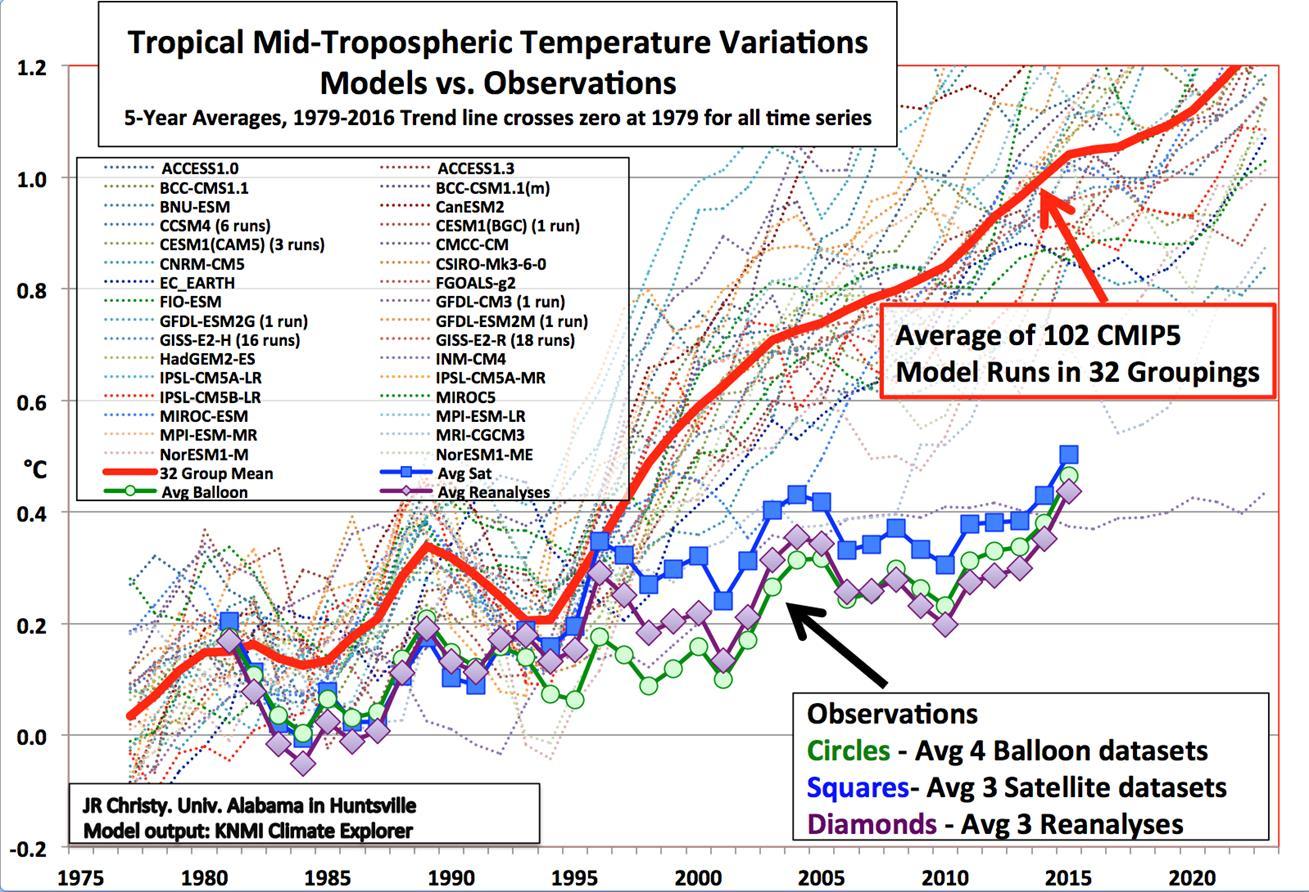
At the bottom, the blue, purple and green lines show the actual reality temperature observations against which the models’ predictions were tested. The dotted lines are 102 temperature “simulations” (predictions) made by the models from 32 institutions for the period 1979-2016. The red line is the consensus of the models, their average. The graph clearly shows 101 of the 102 predictions by the models (dotted lines) and their consensus average (red line) fail miserably to predict reality.8 Focusing on the consensus red line, he concluded: “When the ‘scientific method’ is applied to the output from climate models of the IPCC AR5, specifically the bulk atmospheric temperature trends since 1979 (a key variable with a strong and obvious theoretical response to increasing GHGs in this period), I demonstrate that the consensus of the models [red line] fails the test to match the real-world observations by a significant margin. As such, the average of the models is considered to be untruthful in representing the recent decades of climate variation and change, and thus would be inappropriate for use in predicting future changes in the climate or related policy decisions.” Id., p. 13 (emphasis added). Thus, the models that produced the 101 predictions fail the Feynman test under scientific method. They do not “work,” and therefore provide no reliable scientific evidence for the proposed rule. CMIP6. Steven Koonin, Phd., a Cal-Tech physicist, professor at New York University and author of Unsettled (2021), concluded: “One stunning problem is that … the later generation of [CMIP] models are actually
8 The one model that closely predicted the temperatures actually observed is a Russian model and is the only model that should be used in science. However, the IPCC did not use it but used the models that it should have rejected.


