7 minute read
3.3 Dansgaard–Oeschger oscillations in the Antarctic record


Fig. 2.7 Pleistocene temperature proxy record
!18O isotopic record from LR04 stack of 53 benthic cores from all over the world (after Lisiecky & Raymo 2005) shows that from about 1.5 million years ago some interglacials continued reaching the previous interglacial average temperature (solid horizontal line), while others showed a decreasing trend in interglacial average temperature (dashed line), and are not considered interglacials. Periods of higher temperature more recent than MIS 23 that did not reach interglacial levels are usually not assigned an MIS number (asterisks). For the past 600 kyr the world has stopped or very much reduced its previous cooling rate.
Fig. 2.8 Annual insolation changes at high latitudes and the symmetry problem
Changes in annual insolation by latitude and age are shown in a colored scale. They are essentially due to changes in obliquity, since changes in insolation by precession are averaged between seasons within the same year. The high latitude persistent changes in insolation last for thousands of years and correspond quite well to temperature changes in Antarctica, shown as a black line overlay (no scale). Glacial–interglacial cycles show symmetric temperature responses in both hemispheres. The obliquity cycle is schematically shown, shifted 90° (10.25 kyr) so ascending red dashed lines correspond to periods with polar insolation surplus, and descending blue dashed lines correspond to periods with polar insolation deficit. Antarctic temperature responds mainly to obliquity changes, not to high-latitude south summer insolation changes (not shown). The effect helps keep interhemispheric synchronicity during the glacial cycle.
sequence (Fig. 2.7, asterisks). We call them interstadials and are nothing but cool interglacials between cold stadials. The MPT did not involve any change in insolation, or orbital cycles, so proponents of the 100 kyr-Insolation Milankovitch hypothesis are at odds to explain how an obliquity cycle turned into an eccentricity cycle.
The most interesting question is not why some obliquity induced periods of warming fail to reach what we consider interglacial temperatures, but why some still manage to reach them given the cooling of the planet.
2.5.3 Temperature shows a clear response to obliquity-linked changes in 70–90° insolation
Although precessional changes greatly affect the amount of insolation during a three-month period, that change is quickly averaged over the following nine months, leaving total annual insolation unchanged. By contrast obliquity changes add a significant amount of warming at high latitudes (70–90°) year after year over a period of thousands of years and can have an enormous cumulative effect (Fig. 2.8). The temperature proxy record clearly shows temperature decreasing during periods of obliquity-linked polar insolation deficit (dashed blue lines in Fig. 2.8), and increasing during periods of obliquity-linked polar insolation surplus (dashed red lines in Fig. 2.8).
2.5.4 Temperature responds poorly to precessionlinked changes in insolation
Peak summer insolation is dominated by the 23-kyr precession cycle. When a frequency analysis is performed on insolation astronomical data and temperature proxy data, only a very small temperature response to the precession bands is detected (Fig. 2.4c right panel). The only consistent response between astronomical insolation and tem-
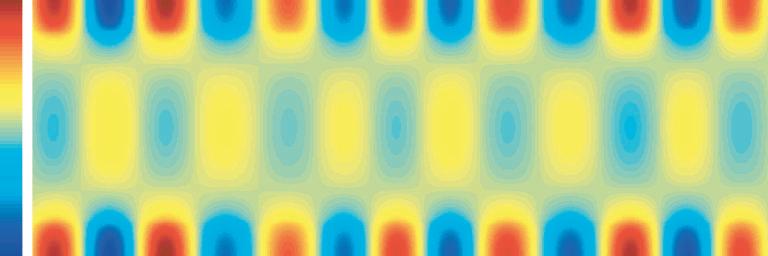
Fig. 2.9 Interglacial alignment with obliquity
Interglacials MIS 1, 5e, 7c–a, 9e, 15a, 15c, and 19c were aligned by temperature at their start. Their obliquities then display a significant degree of synchronization. Obliquity bottoms 20 to 15,000 years before the start of the interglacial. The warming in Antarctica starts about 10,000 years later, and proceeds so fast that interglacial average temperatures are reached by the time obliquity peaks about 19,000 years after it started rising. The interglacial comes to an end with a delay of about 5,000 years over the falling obliquity. EPICA Dome C data after Jouzel, et al. (2007). Astronomical data after Laskar et al. (2004). Some interglacials were not considered for their abnormal duration (MIS 11c, MIS 7e), or abnormal temperature profile (MIS 13a, MIS 17).
Fig. 2.10 Interglacial alignment with 65°N summer insolation
Same as Fig. 2.9 for 65° northern June 21st insolation. Although insolation also has a tendency to align indicating that interglacials cannot take place if insolation is working in the opposite direction, the spread is clearly higher in this case. Insolation for MIS 7c–a came too early and for MIS 15c and MIS 5 too late to be held responsible for driving interglacial warming. Black circles indicate 500 W/m2 at 65°N on June 21st for these three interglacials. EPICA Dome C data after Jouzel, et al. (2007). Astronomical data after Laskar et al. (2004).
perature data is given by obliquity. Not only is there no significant signal for a 23-kyr cycle in the data, but if 65°N summer insolation is so important it becomes difficult to explain why it sometimes has a huge effect on temperatures and at other times it has almost no effect.
2.5.5 Temperature shows better phase agreement with obliquity
When seven interglacials of the past 800 kyr are aligned by temperature, their obliquity curves also align (Fig 2.9). Maximum obliquity takes place within only 4,000 years of the interglacial start, despite being a 41-kyr cycle. Such tight phase coherence between obliquity and temperature indicates that temperature is under obliquity control. Obliquity and temperature phases are shifted by 28.5° (c. 6,500 yr delay) indicating a lag in the climatic response to orbital forcing. A similar phenomenon is observed in present regional temperatures that show a delay of c. 1 month to insolation changes (warmest days are about one month after summer solstice). Milankovitch forcing is much smaller and requires a much longer time to effect much bigger changes.
The same temperature alignment including 65°N 21st June insolation curves (Fig. 2.10) shows much more variability (compare to Fig. 2.9). This variability underscores that for MIS 7c–a, MIS 5e, and MIS 15c insolation could not have driven glacial termination. In the first, interglacial insolation increase took place too early and in the last two it took place too late (Fig. 2.10, circles; see Sect. 2.3.3). This problem has been widely discussed for MIS 5e, know as the causality problem, as there is an abundance of data that shows Glacial Termination II taking place before insolation was sufficiently high to drive it (Fig. 2.5). MIS 7c–a and MIS 15c support that it is not an exception.
2.5.6 Temperature changes almost perfectly match obliquity changes
Allowing for the lag in the temperature response to the obliquity forcing, both show an almost perfect match in their temporal variability. As shown in Fig. 2.11, temperature rarely gets out of the obliquity envelope, although often is unable to show a strong response to obliquity increases. The match is so good that it leaves very little room for precession and eccentricity in determining temperature temporal variability, indicating they can only affect the amplitude of temperature response to obliquity changes and therefore they must be a second order factor.
2.5.7 Interglacials show a duration consistent with obliquity cycles
Average duration of MIS 5e, 7c–a, 9e, 15a, 15c, and 19c interglacials, measured at the –3 °C anomaly in the EPICA data is c. 18,000 years. Average duration of the up swing of the obliquity cycle at 23.5° is c. 18,000 years. Average duration of the northern summer insolation cycle at 500 W/m2 is c. 11,000 years. Interglacials tend to last the same as the obliquity cycle but shifted c. 6,500 years due to Earth's thermal inertia and lagged response to orbital forcing.
2.5.8 Obliquity-paced interglacials solve all Milankovitch Theory problems
Evidence from interglacial pacing, temperature response to obliquity, temperature-obliquity alignment, and interglacial average duration clearly indicates that, in general, interglacials respond primarily to the obliquity cycle as they have always done and still do. Despite a general consensus ignoring what the data clearly indicates, some authors have realized this fact and are proposing hypotheses where changes in insolation driven by obliquity are the main forcing responsible for the glacial cycle (Huybers & Wunch 2005; Huybers 2006; Liu et al. 2008; Tzedakis et al. 2017).
The hypothesis that obliquity drives the glacial cycle solves most of Milankovitch Theory problems. The 100kyr problem is solved because there is no 100-kyr cycle, just a 41-kyr cycle that skips one or two beats. And it solves the 41-kyr problem for similar reasons. It solves the causality problem because now glacial terminations usually start at the bottom of the obliquity cycle and therefore MIS 5e termination is well underway at 135 ka when 65°N summer insolation is still too low. It also solves the lack of asymmetry in the polar response, as the obliquity cycle is symmetrical in both poles.
2.6 The 100-kyr ice cycle
Having showed that interglacials are paced by obliquity and not by eccentricity, and that they do not follow a 100kyr cycle, it is time to revisit the actual 100-kyr cycle. The
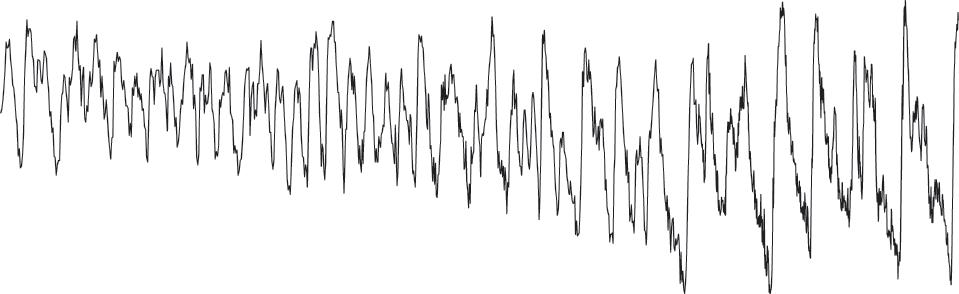
Fig. 2.11 Temperature changes due to axial tilt changes
Black curve, temperature anomaly at EPICA Dome C ice core for the past 800,000 years, lagged 6,500 years. Red curve, changes in obliquity of the planetary axis in degrees. The fall in obliquity always terminates interglacials. EPICA Dome C data after Jouzel et al. (2007). Astronomical data after Laskar et al. (2004).


