About


The climate of our planet depends on numerous facts like:
Incoming solar energy
Mixture of gases in the atmosphere
Distribution of Continents und Oceans
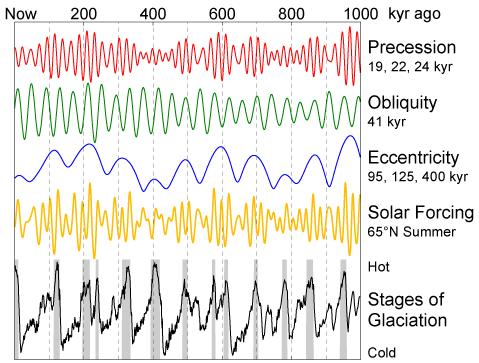
The incoming solar energy oscillates, but not only with a period of 11-years.
The variations of Earth obliquity, Precession of rotational axis, relative to the direction to the Sun and Eccentricity of the orbit, have a strong influence.
These are the Milankovitch cycles, which cause changes in solar forcing, as we see on the next page.
Es ist erlaubt, die Datei unter den Bedingungen der GNU-Lizenz für freie Dokumentation, Version 1.2 oder einer späteren Version, veröffentlicht von der Free Software Foundation, zu kopieren, zu verbreiten und/oder zu modifizieren; es gibt keine unveränderlichen Abschnitte, keinen vorderen und keinen hinteren Umschlagtext.
Source https://commons.wikimedia.org/wiki/File:Milankovitch_Variations.png?uselang=de
The distribution of Continents und Oceans around the globe have strong influence on the climate.
It contributes to the local formation of deserts and ice.
For the global distribution of energy, Ocean- currents are more important than Wind.
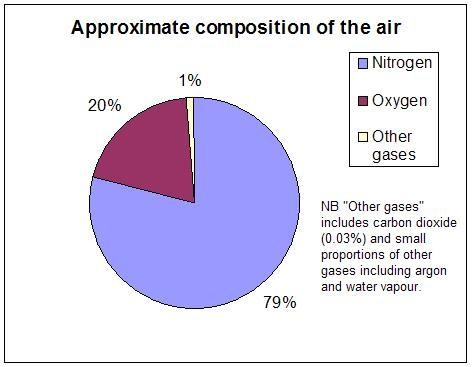
The composition of our Atmosphere changed considerably in earth-history.
Within the first 80% of earth-history there was almost no oxygen, but in later times it reached up to 35% .
In these days people are alarmed. They fear the changing content of CO2 , N2O , CH4 and O3 may considerably change the climate.
I have created this pie chart. It shows the typical composition of atmospheric air. Charlie123 16:22, 23 Jun 2005 (UTC)
This file is licensed under the Creative Commons
Attribution-Share Alike 3.0 Unported
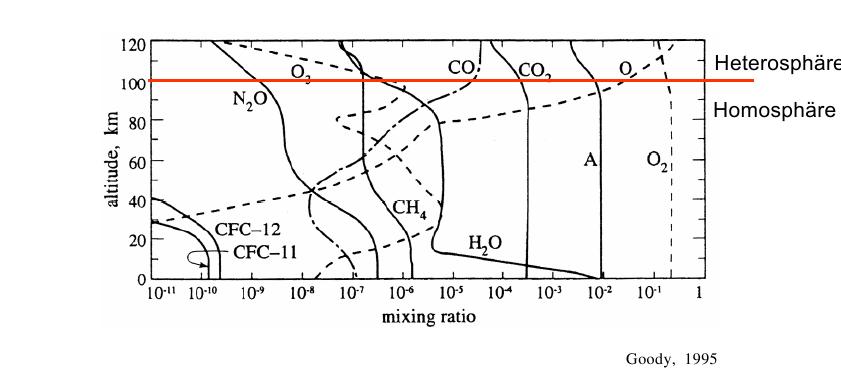
Some trace gases show
Extreme vertical variability
Are important due to their radiation-properties
An important question is to what extent did these tracegases already change the climate and how it will go on?
People speak about tipping-points. If they happen there will be no way back.
Is there a scientific base for these statements or do they only say so to cause panic?
Let`s have a closer look at how CO2 influences climate.
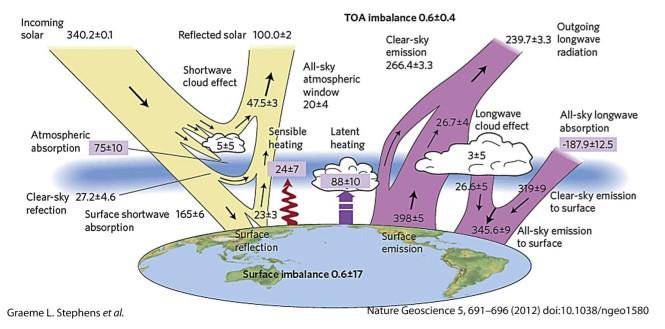
The following scheme shows the numerous things, that have influence on the incoming energy from the sun and the outgoing energy to space.
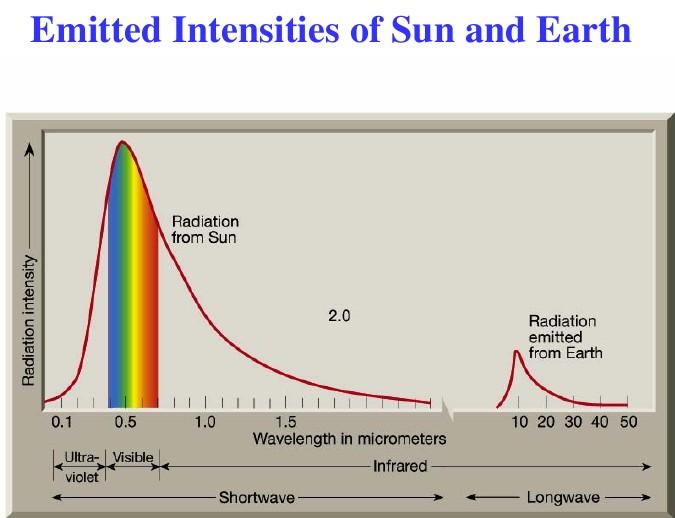
And finally a slide of the frequencies, ultraviolet to infrared, relevant for climate change.
Source: Howard (Cork) Hayden, CO2 and Climate: A Tutorial
Cosmic rays
Gamma rays
X- rays
Heat- radiation
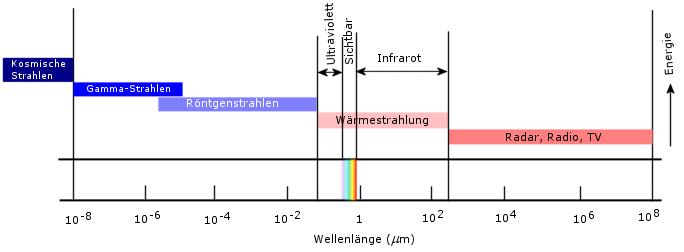
Here the different frequencies on Earth.
Source Vorlesung Grundlagen der Meteorologie
Following this general overview now we come to the details.
As a layman we have a lot of questions.
How do physics of the gases influence the transport of energy by radiation in the atmosphere and change the climate?
What influences there in which way??
How will this influence change in the future?
Are these scientific findings sufficiently tested and approved?
We start with the first question: How does physics of the gases influence the transport of energy by radiation in the atmosphere and change the climate?
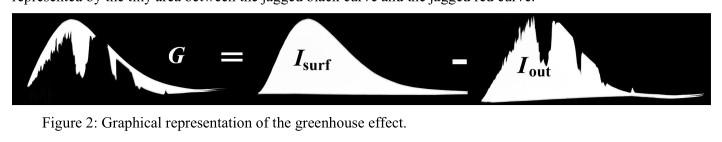
In the graphic two slides down we see on the left a scheme of the energy transport from the surface of our planet to space.
The height of the mountain shows the amount of energy and from left to right we find the frequencies, at which the energy is radiated.
The graphic at the right side shows a smaller surface.
An irregular part of the surface disappeared at the top rim.
That is caused by the influence of the greenhouse-gases, hindering the energy transport at certain frequencies.
Let`s see how this works in detail.


Source: Howard (Cork) Hayden, Basic climate physics
How were these differences measured?
Two different measurement systems were used:
1)By use of radiometers from satellites it was possible to investigate the atmosphere as a whole.
2)Radiometers, installed in weather balloons, measured the atmosphere surrounding the ascending balloons,
To check and confirm these observed results, Wijngaard and Happer downloaded over 1/3 million rovibrational lines from the most recent HITRAN database to calculate the per-molecule forcings.
The white surface left hand G is heating the planet, it´s the difference between the incoming amount of energie Isurf from the sun and the amount radiated to space, shown in the right image named Iout.
Source: Howard (Cork) Hayden, Basic climate physics
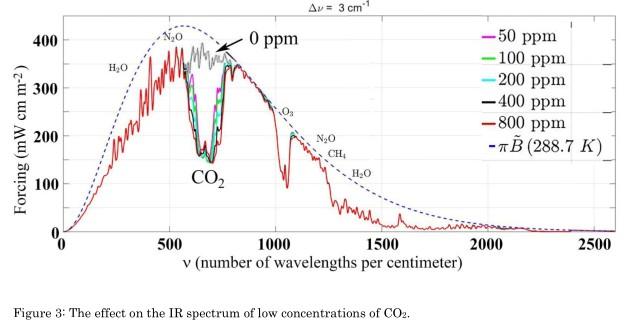
The influence of different concentrations of trace gases in our atmosphere are shown in the following image.
It demonstrates the effect of 0 ppmv CO2 in green line, 400 ppmv CO2 in black line, (about the present content of our atmosphere) as well as 800 ppmv CO2 in red line, twice the present content of CO2.
As can be seen without difficulty, there is little difference between the black and the red line.
We realize:
That additional CO2 in our atmosphere will have only minor additional influence.
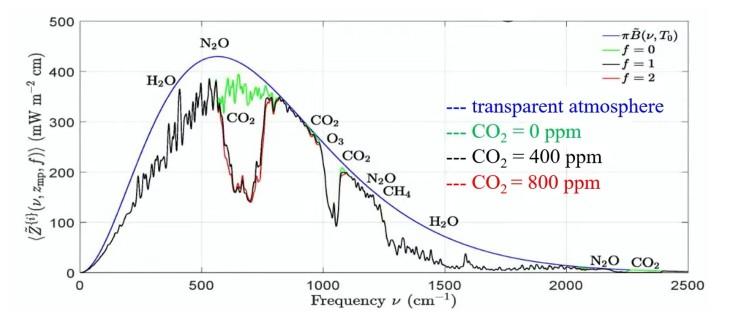
Source: Howard (Cork) Hayden, Basic climate physics
Source: Howard (Cork) Hayden, CO2 and Climate: A Tutorial
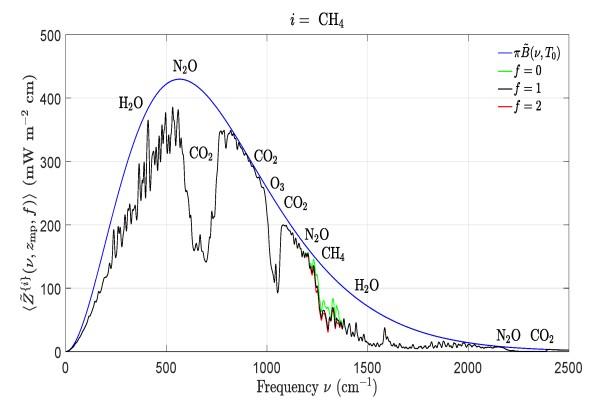
The same kind of saturation, but with considerably minor influence, can be seen for methane, CH4, as shows the next image.
And a similar kind of saturation is observed for N2O und O3 .
These three gases, CH4, N2O und O3 together, have less influence on the climate than CO2.
Source Dependence of Earth’s Thermal Radiation on Five Most Abundant Greenhouse Gases arXiv:2006.03098v1
Source Dependence of Earth’s Thermal Radiation on Five Most Abundant Greenhouse Gases
arXiv:2006.03098v1 [physics.ao-ph] 4 Jun 2020 W. A. van Wijngaarden and W. Happer
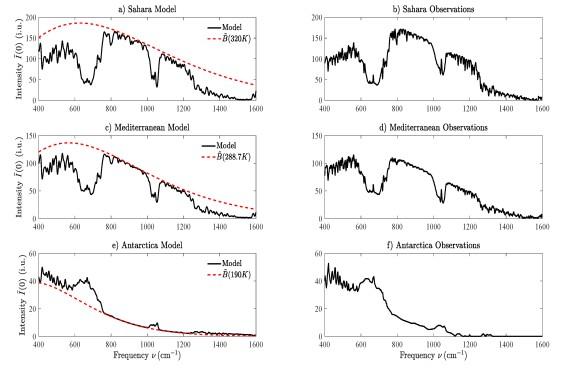
An important question is, how good or bad do calculations agree with the measurements in the atmosphere. That can be seen in the following image.
Calculations (left hand) are compared to results of observations (right hand)
Only for the Antarctic real differences have been found.
These are caused by the fact that warmer gases in the higher atmosphere radiate more energy to space than the cold surface of ice at the bottom is able to replace.
Source: Dependence of Earth’s Thermal Radiation on Five Most Abundant Greenhouse Gases
arXiv:2006.03098v1 [physics.ao-ph] 4 Jun 2020 W. A. van Wijngaarden and W. Happer
Source: Dependence of Earth’s Thermal Radiation on Five Most Abundant Greenhouse Gases
arXiv:2006.03098v1 [physics.ao-ph] 4 Jun 2020 W. A. van Wijngaarden and W. Happer
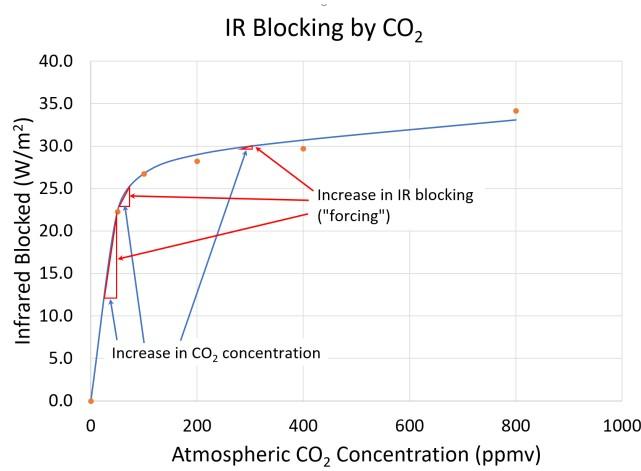
The results, described so far, can be seen in the following image.
As the concentration of CO2 is growing, its additional heating influence decreases considerably.
And it´s the same with N2O , CH4 und O3 .
The results for CO2 are shown in the next image:
Source: Howard (Cork) Hayden, CO2 and Climate: A Tutorial
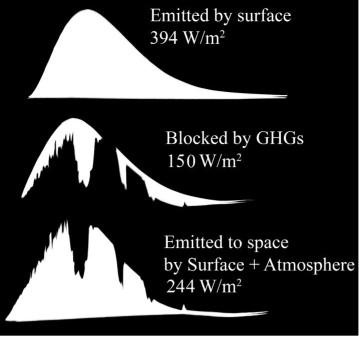
What is our result so far?
Left hand on top we see the ideal case, without atmosphere, where we could not exist.
In the center 150W/m2, blocked by greenhouse- gases in our atmosphere.
And at the bottom 244 W/m2 leaving on top of our atmoshere by radiation.
Source: Howard (Cork) Hayden, CO 2 and Climate: A Tutorial
Our sun delivers 1368 W/m2, arriving on top of the atmosphere.
Only 244 W/m2 reach the surface, and have to be radiated to space again to keep the temperature constant.
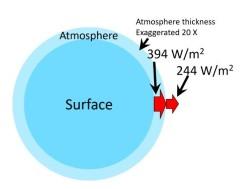
Of the 394 W/m2, actually radiated from the surface of our planet at 400 ppmv CO2 , only 244 W/m2, are reaching space.
Source: Howard (Cork) Hayden, CO2 and Climate: A Tutorial
To reach thermal equilibrium after doubling the CO2 content, the temperature of the planet´s surface must get warmer to be able to radiate to space additional 3,5 W/m2 . That would be 0,65°C.
Source: Howard (Cork) Hayden, CO2 and Climate: A Tutorial
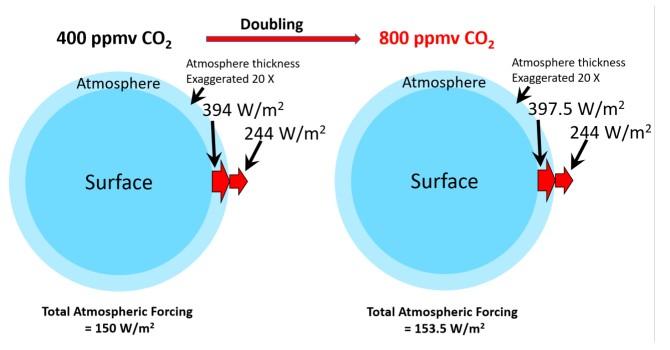
The last mentioned value of 0,65°C seems to be conservative. Instead of 3.5 W/m2, used in other publications and 3,7 W/m2, used by IPCC until they published in AR6 3,95 W/m2, Happer’s calculations show that the doubling should produce a “forcing” of under 3 W/m 2 .
That would cause additional warming of less than 0,5°C, the third of the warming experienced within the last 150 years.
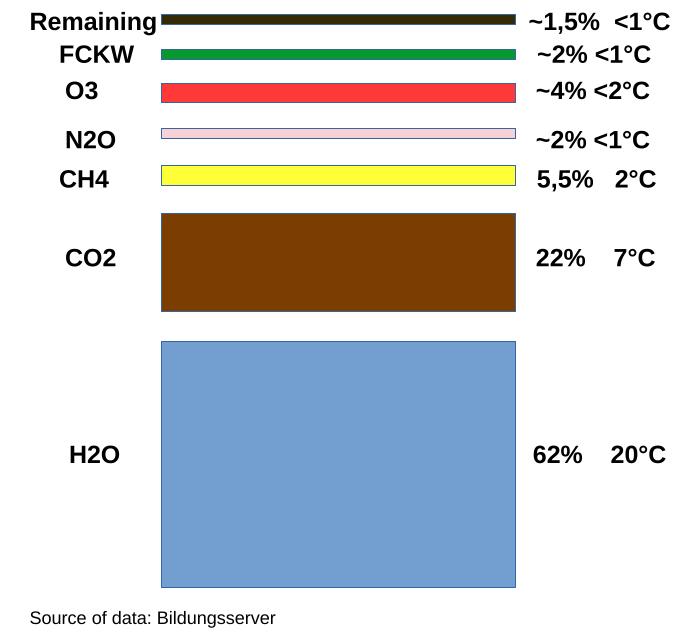
The following image shows the contribution of different gases to climatechange.
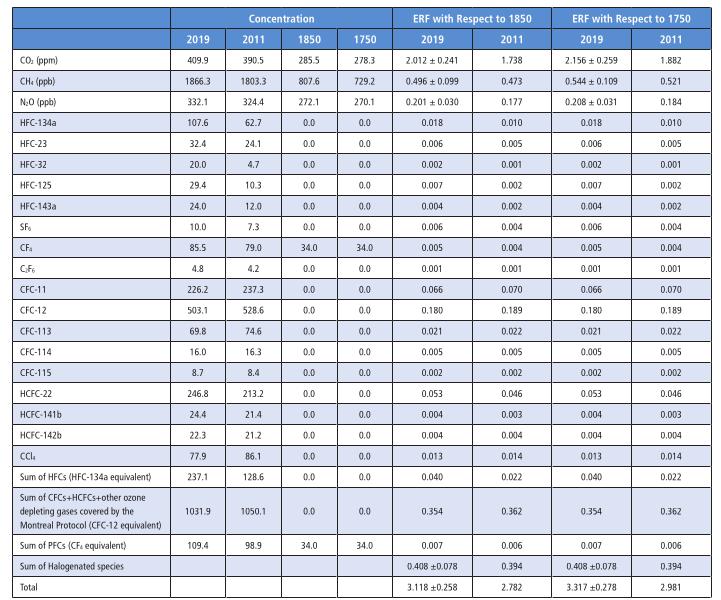
The influence of the gases on climate-change ist reported by IPCC as well, as can be seen in the following table.
The major contribution comes here from CO2, as H2O is omitted.
The values of the trace gases go down to 0,001 W/m2
In the lower part of the list we find a large number of halogenated hydrocarbons, used as refrigerants until the Montreal- Agreement.
Since they are banned, its content in the atmosphere is slowly shrinking.
Source: IPCC AR6, WG1, Page 948
The following image shows how small the influence of CO2 already was at the beginning of industrialisation, and how the additional influence diminished over the years.
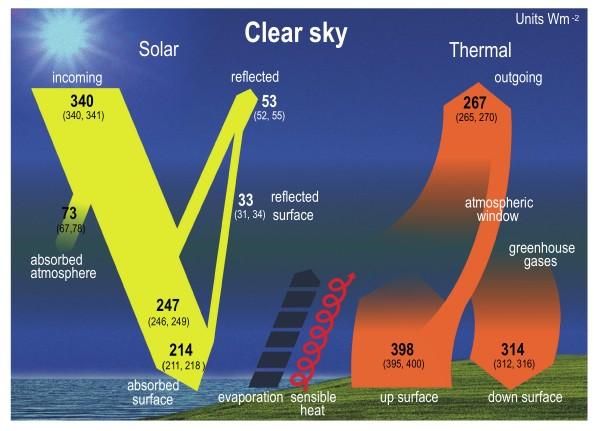
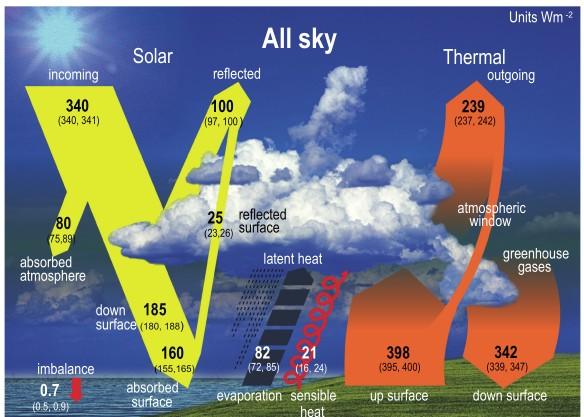
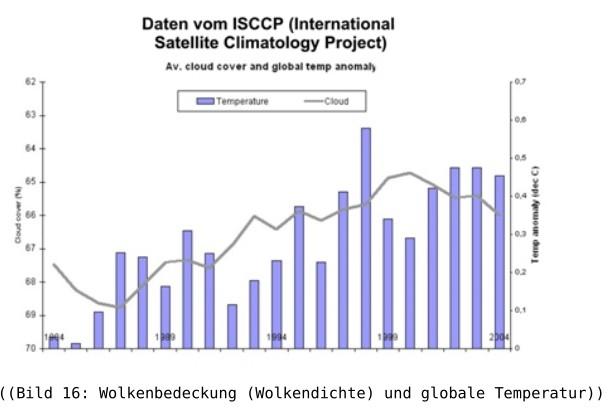
Next we find an image that shows, what influences the climate in times of a clear sky.
What influences the climate in times of a covered sky can be seen from a later image.
CO2-content of the Atmosphere at begin of Industrialisation
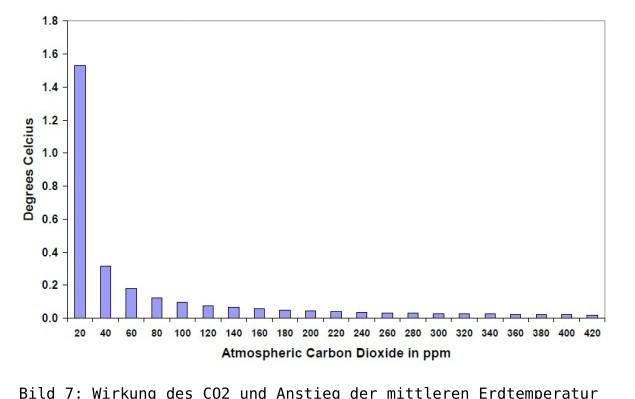
Source: Heinz Hug; Anthropogener Treibhauseffekt
Source: IPCC AR6, WG1, Seite 934
What happens on an Earth without Atmosphere and water can be calculated without difficulties.
With the present atmosphere, humidity and numerous gases it is more complicated, and the Clouds make it even more complicated.
Depending on it´s structure, clouds can have cooling- or heating influence.
Quelle: IPCC AR6, WG1, Seite 934
Source: Heinz Hug; Anthropogener Treibhauseffekt
As we see in this graph, Clouds and temperature do not coincide at all.
Without Greenhouse Gases the mean temperature on our planet would be -19 degree Celsius.
(Source: IPCC_sar_wg_1_full_report.pdf; page 57)
The so named natural climate change, raised the temperature to +14 degree Celsius.
The so called man-made climate-change raised the temperature, as IPCC says, to +15°C.
Other sources publish for an Earth without atmosphere, a temperature of -18°C.
The warming, caused by climate-active gases, would so raise the temperature by 33°C to +15°C
These numbers do not show a warming, caused by climate-active gases.
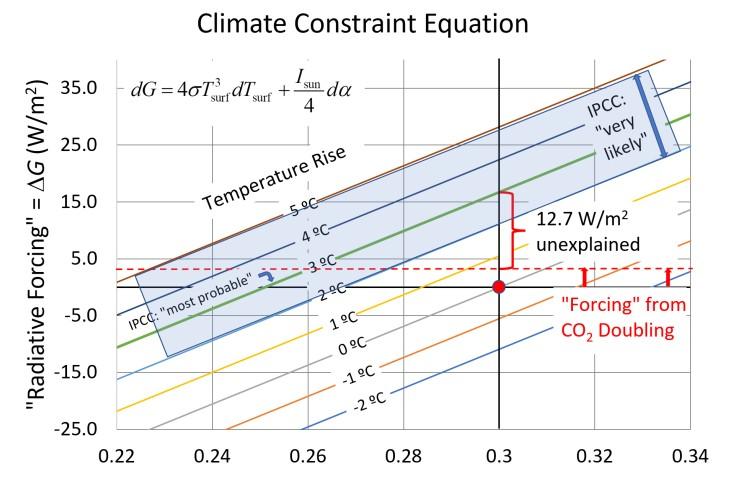
For a doubling of the CO2- content of the atmosphere, IPCC gives in AR6, WG1, page 945 a value of 3.93 W/m2 .
(Assessed effective radiative forcing (ERF), stratospherictemperature-adjusted radiative forcing (SARF) and tropospheric adjustments to 2×CO2 change since preindustrial times).
That is far less, than the necessary amount for the postulated temperatur raise, as shown by Howard Hayden.
Quelle: IPCC AR6, WG1, Seite 934
Prof. Hayden used the following Graph to demonstrate the unexplained amount of radiative forcing.
To reach the temperature postulated by IPCC different numbers for radiative forcing would be necessary than the ones published by IPCC.
By use of the value published by IPCC of 3,93 W/M2, it is by far not possible to reach the raising temperatures between minimum +2°C and maximum +5°C with most likely 3°C.
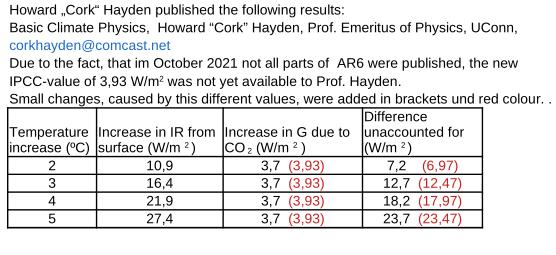
See the following graph and table by Prof. Hayden.
Albedo
Quelle: Howard (Cork) Hayden, Climate Physics 1 thru 10.pdf
A further important difference between a publicaton of IPCC and observations can be found in the following graph, published by Prof. Wijngaarden.
source: Impact of Changing Greenhouse Gas Concentrations on Ontario’s Climate
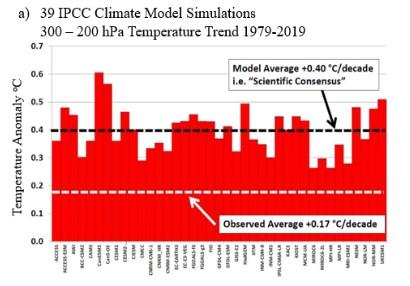
W. A. van Wijngaarden
August 28, 2023
And now a little climate- history.
The next graph shows the changes between cold- and hot stages of glaciation within the last hundred thousend years without people burning coal, oil or gas.
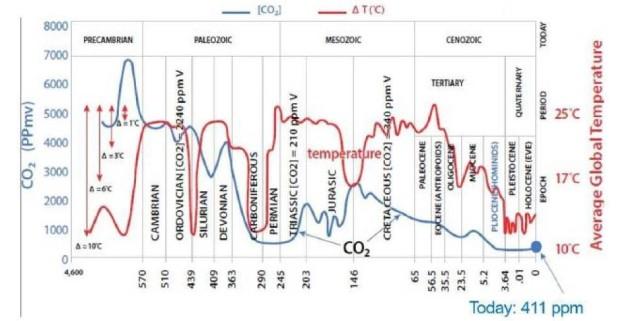
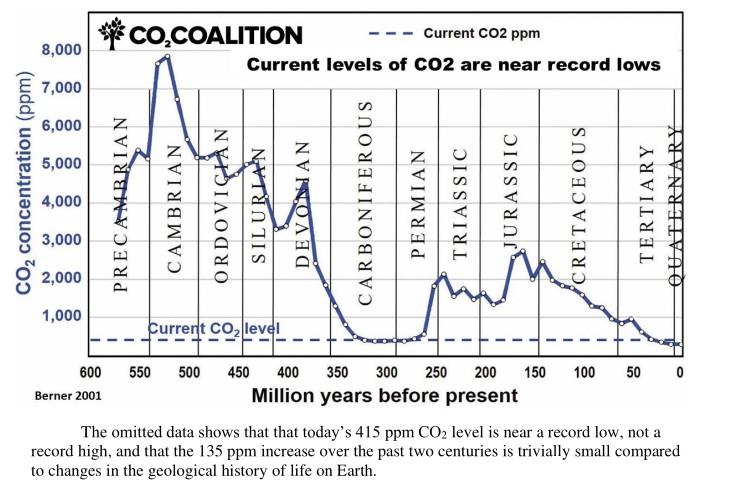
The graph after that shows the CO2 content of our atmosphere within the last 500 million years.
An influence between CO2 and temperature can be excluded.
In detail, the CO2- content in both graphs differs a little, but the general trend ist unequivocal.
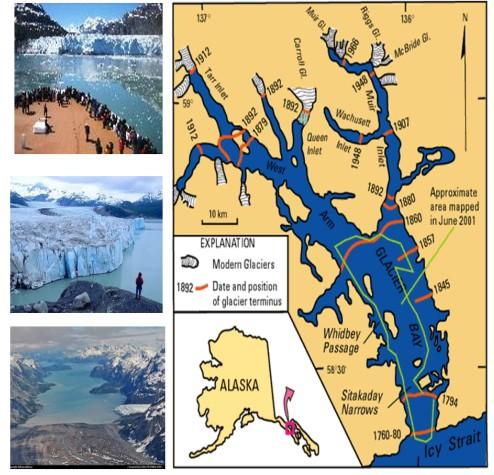
The disappearing glaciers are often named as a result of man-made climate change.
The following picture shows that the fast retreat of glaciers began already before the industrialisation started, causing emission of large amounts of CO2to the atmosphere.
A climate tipping-point did not happen, although higher temperatures were observed, due to proxy dates, between the end of the last glaciation and present, as well as before the last glaciation, i.e. during the Eem interglacial.
During the Eem interglacial, about 120.000 years ago, it was 2 to 3 degrees warmer than today and a tipping point did not occur, before the next glaciation began.
Source: Impact of Changing Greenhouse Gas Concentrations on Ontario’s Climate
W. A. van Wijngaarden
August 28, 2023
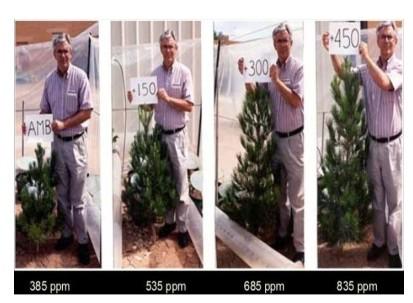
And now an example about the usefulness of CO2 .
It shows how a higher content of CO2 in the atmosphere accelerates the growth of plants like calabrian pines.
It’s the result of experiments with higher CO2- content in the air around plants, performed by the US- Water Conservation Laboratory in Phoenix, Arizona, in 1979 .
Source: Impact of Changing Greenhouse Gas Concentrations on Ontario’s Climate
W. A. van Wijngaarden, August 28, 2023
A sinking content of CO2 reduces the growth of plants, they become stumped.
At less than 150ppmv the last of plants we use as food stop photosythesis and die.
And so do we.