July 19, 2023
U.S. Environmental Protection Agency
EPA Docket Center ID No. EPA-HQ-OAR-2023-0072 FRL-8536-02-OAR
Mail Code 28221T
1200 Pennsylvania Avenue NE
Washington, D.C.
Re: Proposed Fossil Fuel Power Plant Rule: “New Source Performance Standards for Greenhouse Gas Emissions From New, Modified, and Reconstructed Fossil Fuel-Fired Electric Generating Units; Emission Guidelines for Greenhouse Gas Emissions From Existing Fossil Fuel-Fired Electric Generating Units; and Repeal of the Affordable Clean Energy Rule” (the “Proposed Rule”)
Dear Administrator Reagan,
Thank you for the opportunity to comment on the Environmental Protection Agency’s (“EPA”) Proposed Rule. 1
We are career physicists who have specialized in radiation physics and dynamic heat transfer for decades, subjects directly relevant to the global warming debate. Each of us has published over 200 peer-reviewed papers on the science of climate or closely related subjects. Our curricula vitae are attached in the appendix.
At the outset, these comments are organized around two Supreme Court opinions.
First, “‘scientific knowledge’ … must be derived by the scientific method.” Daubert v. Merrell Pharmaceuticals, Inc., 509 U.S. 579, 593 (1993).
Second, an agency rule is “arbitrary and capricious if the agency … entirely failed to consider an important aspect of the problem” and “the relevant data.” Motor Vehicle Manufacturers Association of the United States, Inc. v. State Farm Mutual Automobile Insurance Company, 463 U.S. 29, 43 (1983) (“State Farm”). (It similarly is a major violation of the scientific method not to consider all relevant data, as elaborated below.)
We demonstrate below that (1) EPA failed to consider critically important aspects and data concerning CO2, fossil fuels and climate change, and (2) EPA relied on numerous studies that violate the scientific method. As a result, the Proposed Rule, which could eliminate fossil fuel
1 88 Fed. Reg. 33,240 (May 23, 2023).
I. Summary.
A. EPA Failed to Consider Important Aspects of Climate Change.
In our opinion, the EPA’s Proposed Rule entirely fails to follow the State Farm mandate (and that of the scientific method) to consider each important aspect and relevant data on the issue of climate change.
A cornerstone of modern administrative law, the Supreme Court’s State Farm decision defines as arbitrary and capricious an agency rulemaking where, inter alia, “the agency has entirely failed to consider an important aspect of the problem, offered an explanation for its decision that runs counter to the evidence before the agency.” 463 U.S. at 42.
Time and again, courts have applied State Farm’s principles to invalidate agency rules where the agency failed to consider an important aspect of the problem, or cherry-picked data to support a preordained conclusion. See, e.g., Dep’t of Homeland Sec. v. Regents of the Univ. of Calif., 140 S. Ct. 1891, 1913 (2020) (an agency official “‘entirely failed to consider … [an] important aspect of the problem.’” and that “omission alone renders … [the official’s] decision arbitrary and capricious”); Am. Clinical Lab’y Ass’n v. Becerra, 40 F.4th 616, 625 (D.C. Cir. 2022) (agency rule deemed arbitrary and capricious where “the agency, without adequate explanation, exempted a sizable portion of the laboratories covered by the statute from data reporting requirements”); Natl. Lifeline Ass’n v. FCC, 921 F.3d 1102, 1112 (D.C. Cir. 2019) (agency rule deemed arbitrary and capricious where agency departed from its “prior forbearance policy without reasoned explanation and failing to consider key aspects of the program”).
The Proposed Rule flunks this basic requirement by entirely failing to consider several important aspects of climate change and relevant data:
First, Carbon Dioxide Is Essential to Life Social Benefits. Carbon dioxide is essential to life, creating via the process of photosynthesis the food we eat and the oxygen we breathe. Without carbon dioxide, there would be no human life or other life on earth.
Further, increased levels of carbon dioxide in the atmosphere create more food for people worldwide, including more food for people in drought-stricken areas. To illustrate, increases in carbon dioxide over the past two centuries since the Industrial Revolution, from about 280 parts per million (ppm) to about 420 ppm, 3 caused an approximate 20% increase in the food available to people worldwide, as well as increased greening of the planet and a benign warming in temperature.
Second, Fossil Fuel’s Extraordinary Social Benefits. Fossil fuels also have extraordinary social benefits. They are indispensable in creating nitrogen fertilizer and pesticides that feed nearly half the world; their combustion releases carbon dioxide and thus increases plant growth via increased CO2 fertilization effect, creating more food worldwide; and they provide the most reliable, efficient and low-cost energy for many uses, including the production of 61% of the nation’s electricity.
Third, The Consequences of Net Zero Are Disastrous. Corresponding to these benefits are the disastrous consequences that would flow from “net zeroing” fossil fuels and carbon dioxide and eliminating the enormous social benefits they provide, including the disastrous consequences of eliminating 61% of the nation’s electricity provided by fossil fuel power plants.
The number of people worldwide who are moderately or severely food insecure is 2.3 billion, including over 900 million who face severe food insecurity. 4 Each ton of carbon dioxide emissions eliminated reduces the amount of food available worldwide. “Net zero” would reduce carbon emissions by over 40 gigatons (Gt) every year, and consequently would proportionally reduce the amount of food produced.
As to fossil fuels, one of us (Happer) has made clear that without the “use of inorganic [nitrogen] fertilizers” derived from fossil fuels, the world simply “will not achieve the food supply needed to support 8.5 to 10 billion people,”5 resulting in widespread starvation.
Fourth, The Scientific Method Proves There Is No Risk That Fossil Fuels and Carbon Dioxide Will Cause Catastrophic Warming and Extreme Weather.
• All of the models that predict catastrophic global warming fail the key test of the scientific method: they grossly overpredict the warming versus actual data.
• 600 million years of data prove that today’s CO2 level of 420 parts per million (ppm) is very low, not high.
• 600 million years of data show that higher levels of CO2 do not cause or even correlate with higher temperatures.
3 CO2 levels cited in this comment vary between 400 and 420, depending on when, between 1900 and present day, the levels were measured according to the cited material.
4 UNITED NATIONS, THE STATE OF FOOD SECURITY AND NUTRITION IN THE WORLD, xvii (2022).
5 William Happer, et al , Nitrous Oxide and Climate, CO2 COALITION (Nov. 10, 2022), at 39 (emphasis added).
• Even at today’s relatively low levels, atmospheric CO2 is now “heavily saturated,” in physics terms, meaning that additional increases in atmospheric CO2 can have little warming effect.
B. EPA and Numerous Studies It Relies On Do Not Use the Scientific Method.
As a corollary to the arbitrary and capricious rule under State Farm, an agency must use reliable scientific methods to reach its conclusions. As Daubert emphasized, “any and all scientific testimony or evidence admitted … [must be] not only relevant, but reliable.” Id. at 589.
Here the EPA relies on a number of studies, cited and analyzed below, that do not use the scientific method and therefore are not reliable. Instead, all use what we call the “Unscientific Method”: consensus, peer review, government opinion from the International Panel on Climate Change (“IPCC”), models that do not work, falsifying data by omitting contradictory data, and fabrication of supporting data. None of this produces scientific knowledge; only the scientific method does.
In science, omitting contradictory data is such an egregious violation of the scientific method that it is deemed “falsification.”6 It is illustrated by what can be called the “world is flat analysis,” which involves cherry-picking a limited set of favorable data and then failing to consider contradictory evidence. Under this method, the theory that the world is flat is true if one uses only eyesight data and does not consider the voluminous other evidence that it is round.
The Unscientific Method of analysis, relying on consensus, peer review, government opinion, models that do not work, cherry-picking data and omitting voluminous contradictory data, is commonly employed in these studies and by the EPA in the Proposed Rule. None of the studies provides scientific knowledge, and thus none provides any scientific support for the Proposed Rule.
For all of these reasons, the Proposed Rule should not be adopted.
II. The EPA’s Proposed Fossil Fuel Power Plant Rule.
The EPA “is proposing five separate actions under section 111 of the Clean Air Act (“CAA”) addressing greenhouse gas (“GHG”) emissions from fossil fuel–fired electric generating units (“EGUs”).”7
The EPA asserts, “[e]levated concentrations of GHGs are and have been warming the planet, leading to changes in the Earth’s climate including changes in the frequency and intensity of heat waves, precipitation, and extreme weather events; rising seas; and retreating snow and ice.” 8
Further, the EPA alarmingly states, “CO2 concentration of 415 ppm is already higher than at any time in the last 2 million years,” and asserts “elevated concentrations endanger our health
6 DAVID GOODSTEIN, ON FACT AND FRAUD 135 (2010) (“Falsification is… changing or omitting data or results.”).
7 88 Fed. Reg. 33,240.
8 88 Fed. Reg. 33,249.
by affecting our food and water sources, the air we breathe, the weather we experience, and our interactions with the natural and built environments.” 9
Key “science” cited to support the Proposed Rule is listed at 88 Fed. Reg. 33,249–50 and in the Regulatory Impact Analysis.
1. EPA.
• 2009 Endangerment and Cause or Contribute Findings for GHGs Under Section 202(a) of the CAA (December 15, 2009). 10
• 2016 Endangerment Findings and Cause or Contribute Findings for GHG Emissions From Aircraft (August 15, 2016). 11
• Climate Change and Social Vulnerability in the United States: A Focus on Six Impacts (2021). Climate Change and Social Vulnerability in the United States: A Focus on Six Impacts (epa.gov).
• Framework for Evaluating Damages and Impacts (“FrEDI”).
2. U.S. Global Change Research Program’s (“USGCRP”).
• 2017–2018 Fourth National Climate Assessment (“NCA4”).
• 2016 The Impacts of Climate Change on Human Health in the United States: A Scientific Assessment.
3. Intergovernmental Panel on Climate Change (“IPCC”).
• 2018 Global Warming of 1.5 °C.
• 2019 Climate Change and Land.
• 2019 Ocean and Cryosphere in a Changing Climate.
• 2021 IPCC Sixth Assessment Report (“AR6”).
4. Regulatory Impact Analysis (RIA), which is significantly based on the Interagency Working Group, “Technical Support Document: Social Cost of Carbon, Methane, and Nitrous Oxide Interim Estimates under Executive Order 13990” (“IWG SCC Estimate”).
5. National Academy of Sciences (“NAS”).
• 2017 Valuing Climate Damages: Updating Estimation of the Social Cost of Carbon Dioxide.
• 2016 Attribution of Extreme Weather Events in the Context of Climate Change.
• 2019 Climate Change and Ecosystems Assessments.
9 88 Fed. Reg. 33,249–50 (footnotes omitted).
10 74 Fed. Reg. 66,496.
11 81 Fed. Reg. 54,422.
6. National Oceanic and Atmospheric Administration’s (“NOAA”) annual State of the Climate reports published by the Bulletin of the American Meteorological Society, most recently in August 2022.
The EPA warns, based on these assessments: “The most recent information demonstrates that the climate is continuing to change in response to the human-induced buildup of GHGs in the atmosphere. These recent assessments show that atmospheric concentrations of GHGs have risen to a level that has no precedent in human history…, and that these elevated concentrations endanger our health by affecting our food and water sources, the air we breathe, the weather we experience, and our interactions with the natural and built environments.” 12
As examples, the EPA cites:
• “more intense hurricanes and more frequent and intense storms of other types and heavy precipitation.”
• “The rate of sea level rise during the 20th Century was higher than in any other century in at least the last 2,800 years.”
• “heatwaves and heavy precipitation are more frequent and more intense, along with increases in agricultural and ecological droughts in many regions.”13
The EPA concludes: “These scientific assessments, EPA analyses, and documented observed changes in the climate of the planet and of the U.S. present clear support regarding … the importance of GHG emissions mitigation.”14
We demonstrate below that many of the key studies egregiously violate scientific method, and thus cannot be used as “scientific” justification for the Proposed Rule.
III. Scientific Theories Are Determined by the Scientific Method, Validating Theoretical Predictions with Observations, Not by Fabricated, Falsified or Omitted Contradictory Data, Models That Do Not Work, Government Opinion, Consensus or Peer Review.
Scientific Method. Reliable scientific knowledge is determined by the scientific method, where theoretical predictions are validated or invalidated by observations. If the theoretical predictions do not work, the theory is rejected and not used. Agreement with observations is the measure of scientific truth.
Scientific progress proceeds through the interplay of theory and observation. Theory explains observations and predicts what will be observed in the future. Observations anchor understanding and weed out theories that don’t work. This has been the scientific method for more than three hundred years.
Professor Richard Feynman, a Nobel Laureate in Physics, incisively explained the scientific method:
12 88 Fed. Reg. 33,250.
13 88 Fed. Reg. 33,249–50 (footnotes omitted and emphasis added).
14 88 Fed. Reg. 33,252.
[W]e compare the result of [a theory’s] computation to nature, ... compare it directly with observations, to see if it works. If it disagrees with experiment, it is wrong. In that simple statement is the key to science. 15
Thus, the scientific method is very simple and very profound: Does theory work with observations? If not, it is rejected and not used.
IV. Unscientific Method Commonly Used by the EPA and Studies.
A.
Fabricated, Falsified, and Omitted Contradictory Data.
Since theories are tested with observations, fabricating data, falsifying data, and omitting contradictory facts to make a theory work is an egregious violation of the scientific method. 16
Richard Feynman stated this fundamental principle of the scientific method: If you’re doing an experiment, you should report everything that you think might make it invalid – not only what you think is right about it.... Details that could throw doubt on your interpretation must be given, if you know them. 17
In Albert Einstein’s words: “The right to search for truth implies also a duty; one must not conceal any part of what one has recognized to be true.”18 One of us (Lindzen) observes that “[m]isrepresentation, exaggeration, cherry-picking, or outright lying pretty much covers all the socalled evidence” marshalled in support of the theory of catastrophic global warming caused by fossil fuels and carbon dioxide, and of the urgent need to achieve Net Zero fossil fuel and other human CO2 emissions. 19
B. Models That Do Not Work.
Models are a type of theory; they predict physical observations. The scientific method requires models to be tested by observations to see if they work. If a model’s prediction disagrees with observations of what it purports to predict, it is wrong and never used as science. The models supporting the climate-crisis narrative simply do not align with observations of the phenomena they are supposedly designed to predict. Instead, they consistently overestimate the warming effect of CO2 emissions, often predicting two or three times more warming than has been observed.
15 RICHARD FEYNMAN, THE CHARACTER OF PHYSICAL LAW 150 (1965).
16 DAVID GOODSTEIN, ON FACT AND FRAUD 135 (2010). “Fabrication is making up data or results,” “falsification is … changing or omitting data or results.”
17 RICHARD FEYNMAN, SURELY YOU’RE JOKING, MR. FEYNMAN! 311–312 (1985).
18 ALBERT EINSTEIN, THE ULTIMATE QUOTABLE EINSTEIN 480 (2010).
19 Richard Lindzen, Global Warming for the Two Cultures, GLOBAL WARMING POL’Y FOUND. (2018), at 10.
On models, we understand that the legal standard is essentially the same as the scientific method: “An agency’s use of a model is arbitrary if that model bears no rational relationship to the reality it purports to represent.” 20
C. Government Opinion.
Nobel physicist Richard Feynman put it unambiguously: No government has the right to decide on the truth of scientific principles. 21
The importance of the scientific principle that government does not determine science was chillingly underscored recently in Sri Lanka and earlier in Russia under Stalin. “Ideologically driven government mandates on agriculture have usually led to disaster,” one of us (Happer) explained. “The world has just witnessed the collapse of the once bountiful agricultural sector of Sri Lanka as a result of government restrictions on mineral [nitrogen] fertilizer.”22
Earlier in Russia, Stalin made Trofim Lysenko the czar of Russian biology and agriculture. His false biology, which rejected well-established genetic science, prevailed for 40 years in the Soviet Union because Lysenko gained dictatorial control, providing one of the most thoroughly documented and horrifying examples of the politicization of science. Lysenko was strongly supported by “scientists” who benefitted from his patronage. Millions died because of his ruthless campaign against genetic science in agriculture. 23
D. Consensus.
What is correct in science is not determined by consensus, but by experiment and observations. Historically, the consensus of scientists has often turned out to be wrong, and many of the greatest scientists in history are great precisely because they broke with consensus. To quote the profoundly true observation of Michael Crichton:
Historically, the claim of consensus has been the first refuge of scoundrels…. If it’s consensus, it isn’t science. If it’s science, it isn’t consensus. 24
20 Columbia Falls Aluminum Co. v. EPA, 139 F.3d 914, 923 (D.C. Cir. 1998) (internal quotation marks omitted). See also Kumho Tire Co. v. Carmichael, 526 U.S. 137 (1999) as to trial evidence, where the Supreme Court upheld the exclusion of a tire expert and his model predicting a tire made by the Kumho Tire Company caused a fatal car crash because, among other things, “the expert could not say whether the tire had traveled more than 10, or 20, or 30, or 40, or 50 thousand miles,” id. at 154.
21 RICHARD FEYNMAN, THE MEANING OF IT ALL 57 (1998).
22 Happer, et al., supra, at 39 (emphasis added).
23 William Happer, Chapter 1 in MICHAEL GOUGH, POLITICIZING SCIENCE 29–35 (2003).
24 Crichton, “Aliens Cause Global Warming,” Caltech Michelin Lecture (Jan. 17, 2003).
E. Peer Review.
Peer review can be helpful in many areas of science, but it does not determine scientific validity. In our decades of personal experience in the field, we have been dismayed that many distinguished scientific journals now have editorial boards that further the agenda of climatechange alarmism rather than objective science. Research papers with scientific findings contrary to the dogma of climate calamity are commonly rejected by peer reviewers, many of whom fear that their research funding will be cut if any doubt is cast on the looming climate catastrophe. Journal editors have been fired for publishing papers that go against the party line of the climatealarm establishment. 25
We also have been dismayed by the trillions of dollars that have been spent on one-sided research predicting catastrophic climate change. Dr. Harold Lewis, a distinguished physics professor, bluntly described this reality:
The global warming scam, with the (literally) trillions of dollars driving it … has corrupted so many scientists … It is the greatest and most successful pseudoscientific fraud I have seen in my long life as a physicist. 26
As a result, we agree with the Supreme Court: “peer review and publication … does not necessarily correlate with reliability.” Daubert, 509 U.S. at 593. Peer-reviewed climate science publications should not be viewed as reliable science and do not determine scientific validity. Agreement of theoretical predictions with observation or experiment is the only touchstone of truth in science.
V. The EPA’s Proposed Rule Failed to Consider Four Critically Important Aspects and Relevant Data.
There is overwhelming scientific evidence that CO2 and fossils fuels provide enormous social benefits for the poor, the United States, people worldwide and future generations; that reduction to Net Zero would be a worldwide disaster; and that there is no significant risk that CO2 and fossils fuels will cause catastrophic warming and extreme events. EPA fails to consider all of this evidence, in violation of State Farm and the scientific method.
A. EPA Failed to Consider CO2’s Essential-to-Life Social Benefits.
1. CO2 Is Essential to Food and Thus to Life on Earth.
CO2 is the basis for nearly all life on earth. 27 We owe our very existence to green plants that, through photosynthesis, convert CO2 and water to carbohydrates and oxygen with sunlight. Land plants get the carbon they need from the CO2 in the air. Other essential nutrients water, nitrogen, phosphorus, potassium, etc. come from the soil. In turn, livestock depend on the availability of green plants to consume, so that humans can consume the livestock. Without CO2, there would be no photosynthesis, no food and no human or other life.
25 See also Richard Lindzen, Climate of Fear, WALL STREET JOURNAL (Apr. 12, 2006).
26 Harold Lewis, October 6, 2010 resignation letter to the American Physical Society.
27 See, e.g., Nongovernmental International Panel on Climate Change (NIPCC), Climate Change Reconsidered II: Biological Impacts (2014), at 1.
2. More CO2, Including CO2 from Fossil Fuels, Produces More Food.
A major social benefit of increasing CO2 in the atmosphere is the indisputable science that it increases the amount of food that plants produce through what is known as CO2 “fertilization.” More CO2 means more food. Sylvan Wittwer, the father of agricultural research on this topic, emphasized the enormous benefits of rising CO2 worldwide:
The rising level of atmospheric CO2 could be the one global natural resource that is progressively increasing food production and total biological output, in a world of otherwise diminishing natural resources of land, water, energy, minerals, and fertilizer. … The effects know no boundaries and both developing and developed countries are, and will be, sharing equally.… [for] the rising level of atmospheric CO2 is a universally free premium. 28
A graphic illustration of the response of plants to increases in CO2 is shown below. Dr. Sherwood Idso grew Eldarica (Afghan) pine trees with increasing amounts of CO2 in experiments, starting with an ambient CO2 concentration of 385 ppm. He showed what happens when CO2 is increased from 385 ppm to 535 ppm, 685 ppm and 835 ppm over 10 years: 29

28 Quoted in NIPCC, Climate Change Reconsidered II: Fossil Fuels (2019), at 322–23.
29 Craig Idso, Increased Plant Productivity: The First Key Benefit of Atmospheric CO2 Enrichment, MASTER RESOURCE (Apr. 21, 2022), https://www.masterresource.org/carbondioxide/increased-plant -productivity-the-first-key -benefit-of-atmospheric-co2 -enrichment/; CO2 COALITION, https://co2coalition.org/wp-content/uploads/2021/08/CO2_3.jpg.
Thousands of experimental results demonstrate that more CO2 increases the amount of food that a large variety of plants produce. 30 This “fertilization” effect varies significantly by type of plant, but Dr. Craig Idso has shown that a 300 ppm increase in CO2 resulted in an average increase of 46%. 31
This implies that each 100 ppm increase of CO2 “fertilization” results in a 15.3% (46%/3) increase, on average, in food supply worldwide. 32
Dr. Idso reported, “[s]ince the start of the Industrial Revolution, it can be calculated … that the 120-ppm increase in atmospheric CO2 concentration increased agricultural production per unit land area” for various crops ranging from 28% to 70%. 33 Using more recent data on the 140 ppm increase of CO2 from 280 ppm in 1750 to 420 ppm today and the formula above, people worldwide benefited by a 21% increase in agricultural productivity since 1750. And doubling CO2 from 400 to 800 ppm would result in an additional increase of about 60% (4 x 15.3%).
What if the Net Zero fossil fuel and CO2 policy was in effect in 1750 and CO2 did not rise from 280 ppm to 420 ppm? There would be 21% less food worldwide.
3. More CO2 Increases Food in Drought-Stricken Areas.
Another enormous social benefit of increasing CO2 in the atmosphere is that droughtstricken areas will have more food. In regions of the world suffering from drought, more CO2 means there will be more food, because increasing CO2 lessens water lost by plant transpiration: One of the principal benefits plants receive from elevated levels of atmospheric CO2 is an increase in their water use efficiency. At higher CO2 levels, plants generally do not open their leaf stomatal pores as wide as they do at lower CO2 concentrations. The result is a reduction in most plants’ rates of water loss by transpiration …. At higher atmospheric CO2 concentrations, plants need less water to produce the same — or an even greater — amount of biomass. 34
None of these enormous social benefits of CO2 essential to life and the voluminous data supporting them was considered by the EPA in the Proposed Rule.
30 See, e.g., NIPCC, Climate Change Reconsidered II: Biological Impacts (2014); Craig Idso, “What Rising CO2 Means For Global Food Security” CO2 Coalition (2019); Plant Growth Database, CENTER FOR THE STUDY OF CARBON DIOXIDE AND GLOBAL CHANGE, http://www.CO2science.org/data/plant_growth/dry/dry_subject.php.
31 Craig Idso, The Positive Externalities of Carbon Dioxide, CO2 COALITION (2013), at 3, (discussed in GREGORY WRIGHTSTONE, INCONVENIENT FACTS 19 (2017)).
32 Dr. Idso advised there is a linear relationship between CO2 levels and the amount of food produced for most plants through 800 ppm. (Personal communication).
33 Nongovernmental International Panel on Climate Change (NIPCC), Climate Change Reconsidered II: Biological Impacts (2014), at 322.
34 Craig Idso, What Rising CO2 Means for Global Food Security, CO2 COALITION (2019), at 13. See also CRAIG IDSO & SHERWOOD IDSO, THE MANY BENEFITS OF ATMOSPHERIC AND CO2 ENRICHMENT (2011).
B. EPA Failed to Consider Fossil Fuels’ Enormous Social Benefits.
1. Burning Fossil Fuels Creates More CO2 and Thus More Food.
As explained, increasing the CO2 in the atmosphere can substantially increase the amount of food available to people worldwide. Fossil-fuel CO2 has the same power to create more food through more photosynthesis. 35
2. Fossil Fuels Are Essential to Making Fertilizers and Pesticides That Feed the World.
In the early 1900s, Fritz Haber and Carl Bosch developed a process and method of production by which natural gas and atmospheric nitrogen oxide (N2) could be converted into ammonia (NH3), an extraordinarily effective fertilizer for growing plants. The importance of fossil fuel-derived nitrogen fertilizers cannot be overstated. It is “estimated that nitrogen fertilizer now supports approximately half of the global population” by itself. 36 The importance of these fertilizers is shown in the following chart: 37
Crop yields relative to yields in 1866 for corn, wheat, barley, grass hay, oats and rye in the United States. Also shown from the year 1961 is the annual mineral nitrogen fertilizer (in Tg = megatonnes) used in agriculture. Crop yields are from

35 “Contrary to the claims of proponents of the Green New Deal and Net Zero, fossil fuels are the greenest fuels… uniquely among energy sources, fossil fuel use emits CO2, which is the ultimate source of the elemental building block, carbon, found in all carbon-based life, i.e., virtually all life.” Indur M. Goklany, Fossil Fuels are the Greenest Energy Sources, CO2 COALITION (Aug. 30, 2022).
36 Hannah Ritchie, Max Roser and Pablo Rosado, How Many People Does Synthetic Fertilizer Feed?, OUR WORLD IN DATA (Nov. 7, 2017).
37 Happer et al., supra, at 39, fig. 14.
the USDA, National Statistical Service [62] and nitrogen fertilizer usage is from the Food Agriculture Organization statistical database [58]. Note the high correlation between yields and the use of nitrogen fertilizer.
The chart shows a remarkable increase in crop yields after the widespread use of fossil fuel-derived nitrogen fertilizer began around 1950, compared to crop yields from 1866 to 1950. The following chart shows more specifically what happened after the widespread use of nitrogen fertilizer started around 1950, with a threefold increase in cereal crop production between 1950 and 2020: 38
Annual world production of nitrogen fertilizer used in agriculture (blue, in Tg) and world production of all cereal crops (orange, in gigatonnes) from 1961 to 2019. Data from reference [58]. The threefold increase of cereal crop yields was largely due to the use of mineral nitrogen fertilizer. Additional contributors to the increased yields were other mineral fertilizers like phosphorus and potassium, better plant varieties like hybrid corn, increasing concentrations of atmospheric CO2, etc.

The proportion of the world’s population that depends for life on nitrogen fertilizer is shown in the chart above. 39

This is not mere theory. Sri Lankan President Rajapaksa in April 2021 banned “the importation and use of synthetic fertilizers and pesticides and ordered the country’s 2 million farmers to go organic.” 40 The result was disastrous. “Its rice production has dropped more than 50%, while domestic rice prices have increased more than 80%.” 41 This is a real-life warning of the worldwide disaster that would result from eliminating fossil fuels.
Further, many pesticides (and countless other chemicals in everyday use) are produced from gas and oil, including chlorobenzene, neonicotinoids, and pyrethroids. About one billion pounds of pesticides are used each year in the United States to control weeds, insects, and other pests.
The use of pesticides has resulted in a range of benefits, including increased food production and reduction of insect-borne disease. Those benefits would be greatly diminished and more expensive if nitrogen derived from fossil fuels were unavailable.
39 Ritchie, et al., supra.
40 Helen Raleigh, Sri Lanka Crisis Shows the Damning Consequences of Western Elites Green Revolution, FEDERALIST (July 15, 2022).
41 Id
Thus, eliminating fossil fuels would be disastrous by itself for eliminating fertilizers and pesticides that the world’s food supply depends on, and without which there would be massive human starvation.
3. Fossil Fuels Are the Most Reliable, Efficient and Low-Cost Source of Energy.
The third extraordinary social benefit of fossil fuels is that they provide low-cost energy and resulting jobs. Affordable, abundant fossil fuels have given ordinary people the sort of freedom, prosperity and health that was reserved for kings and queens in ages past.
The following chart of the GDP per person for the last 2,000 years powerfully illustrates what has happened: 42

Moreover, the following chart shows the powerful relationship between rising CO2 and rising GDP: 43
42 Rupert Darwall, Climate Noose: Business, Net Zero and the IPCC’s Anticapitalism
GLOBAL WARMING POLICY FOUNDATION (2020), at 21.
43 NIPCC, CLIMATE CHANGE RECONSIDERED II: FOSSIL FUELS 4 (2019).
C. EPA Failed to Consider the Disastrous Consequences of Net Zeroing Fossil Fuels and CO2.
The rule also fails to consider the overwhelming scientific evidence that reducing CO2 emissions to Net Zero and eliminating fossil fuels would be disastrous to millions of people worldwide by destroying these social benefits, including:

• eliminating nitrogen fertilizer that is essential to feeding nearly half the world;
• reducing the amount of food available worldwide, especially in drought-stricken areas;
• eliminating the most reliable, efficient and low-cost source of energy;
• eliminating the source of 61% of the nation’s electricity.
D. EPA Failed to Consider the Reliable Science That Proves There Is No Risk That Fossil Fuels and CO2 Will Cause Catastrophic Global Warming and Extreme Weather.
1. The Models Predicting Catastrophic Warming and Extreme Weather Fail the Key Scientific Test: They Do Not Work.
The EPA explained the model it used to make all its estimates justifying this Proposed Rule, the increased deaths due to increasing temperatures, as well as climatedriven changes in air quality, transportation impacts due to coastal flooding resulting from sea level rise, increased mortality from wildfire emission exposure and response costs for fire suppression is called the Framework for Evaluating Damages and Impacts (“FrEDI”). The EPA further explained FrEDI “uses climate modeling outputs from the fifth phase of the Coupled Model
Intercomparison Project” (“CMIP5”). 44 The IPCC is the dominant source of the models used by everybody analyzing climate change, in our experience.
The CMIP models do not reliably predict temperatures and “bears no rational relationship to the reality they purport to represent.” Columbia Falls Aluminum, 139 F.3d at 923. They and FrEDI, therefore, should never be used under both scientific and legal standards.
The importance of the scientific and legal failure of the CMIP models underlying all of the EPA’s Proposed Rule cannot be overemphasized. There is no scientific basis for the catastrophic projections of extreme weather 45 being used as justification for extreme action to essentially close down fossil fuel electricity generating plants. 46
Here are the details:
CMIP5. John Christy, Ph.D., Professor of Atmospheric Science at the University of Alabama, applied the scientific method to CMIP5’s 102 predictions of temperatures from 1979 to 2016 by models from 32 institutions.
He explained he used “the traditional scientific method in which a claim (hypothesis) is made and is tested against independent information to see if the claim can be sustained,” and produced the following chart: 47
44 88 Fed. Reg. 33,252; E PA Technical Documentation on the Framework for Evaluating Damages and Impacts (FrEDI) (Oct. 2021), at 8. n.8, technical-documentation-onthe-framework-for-evaluating-damages-and -impacts_maintext.pdf (epa.gov).
45 The wildfire, tornado, hurricane, sea level rise and other extreme weather predictions are also scientifically fallacious for using the “world is flat method” of analysis of cherry-picking limited periods of time and omitting contradictory data from a longer period of times, demonstrated in Part V.
46 See, e.g., 88 Fed. Reg. 33,249–52.
47 John Christy, House Comm. Science, Space and Technology (Mar. 29, 2017), at 3, 5.
At the bottom, the blue, purple and green lines show the actual reality temperature observations against which the models’ predictions were tested.
The dotted lines are 102 temperature “simulations” (predictions) made by the models from 32 institutions for the period 1979–2016.
The red line is the consensus of the models, their average.
In our opinion and his, the graph clearly shows 101 of the 102 predictions by the models (dotted lines) and their consensus average (red line) fail miserably to predict reality. 48 Focusing on the red consensus line, Dr. Christy concluded, and we agree:
When the ‘scientific method’ is applied to the output from climate models of the IPCC AR5, specifically the bulk atmospheric temperature trends since 1979 (a key variable with a strong and obvious theoretical response to increasing GHGs in this period), . the consensus of the models [red line] fails the test to match the realworld observations by a significant margin. As such, the average of the models is considered to be untruthful in representing the recent decades of climate variation and change, and thus would be inappropriate for use in predicting future changes in the climate or related policy decisions. 49

48 The one model that closely predicted the temperatures actually observed is a Russian model and is the only model that should be used in science. However, the IPCC did not use it but used the models that it should have rejected.
49 Id. at 13 (emphasis added).
Thus, in our opinion, the models that produced the 101 predictions fail the Feynman test under scientific method. They do not “work,” and “bears no rational relationship to the reality they purport to represent.” Columbia Falls Aluminum, 139 F.3d at 923. Thus, CMIP5 provides no reliable scientific evidence for FrEDI and the Proposed Rule.
Nor can EPA fix the problems by using CMIP6. We examined the analysis of the CMIP6 by Professor Steven Koonin, Ph.D., a Cal-Tech physicist, professor at New York University and author of Unsettled (2021) which devoted an entire chapter to “Many Muddled Models.” 50 He concluded, and we agree:
One stunning problem is that … the later generation of [CMIP] models are actually more uncertain than the earlier one[s].
The CMIP6 models that inform the IPCC’s upcoming AR6 [Climate Change reports] don’t perform any better than those of CMIP5. 51
He elaborated on CMIP6’s failure using the scientific method in detail:
• “An analysis of 267 simulations run by 29 different CMIP6 models created by 19 modeling groups around the world shows that they do a very poor job [1] describing warming since 1950 and … [2] underestimate the rate of warming in the early twentieth century.”52
• “Comparisons among the [29] models [show] … model results differed dramatically both from each other and from observations ... [and] disagree wildly with each other.”53
• “One particularly jarring failure is that the simulated global average surface temperature … varies among models … three times greater than the observed value of the twentieth century warming they’re purporting to describe and explain.” 54
• As to the early twentieth century warming when CO2 levels only increased from 300 to 310 ppm, “strong warming [was] observed from 1910 to 1940. On average, the models give a warming rate over that period of about half what was actually observed. That the models can’t reproduce the past is the big red flag -— it erodes confidence in their projections of future climate.”55
Thus, the CMIP6 models also fail the fundamental test under scientific method: they do not work and do not provide reliable scientific evidence for the Proposed Rule.
50 STEVEN KOONIN, UNSETTLED (2021).
51 Id. at 87, 90 (emphasis added).
52 Id. at 90.
53 Id
54 Id. at 87.
55 Id. at 88, 95.
The EPA’s Proposed Rule fails to consider the overwhelming scientific evidence that FrEDI based on CMIP5 cannot pass the basic test of scientific and legal method and therefore should never be used. Professor Koonin concluded, and we agree:
The uncertainties in modeling of both climate change and the consequences of future greenhouse gas emissions make it impossible today to provide reliable, quantitative statements about relative risks and consequences and benefits of rising greenhouse gases to the Earth system as a whole, let alone to specific regions of the planet. 56
Moreover, the temperature swings that humans experience daily in non-tropical regions are far greater than the changes that models relied upon by EPA predict will occur over years or decades. We cope well with the larger fluctuations, and there is no reason for alarm or concern about much smaller ones. As one of us wrote:
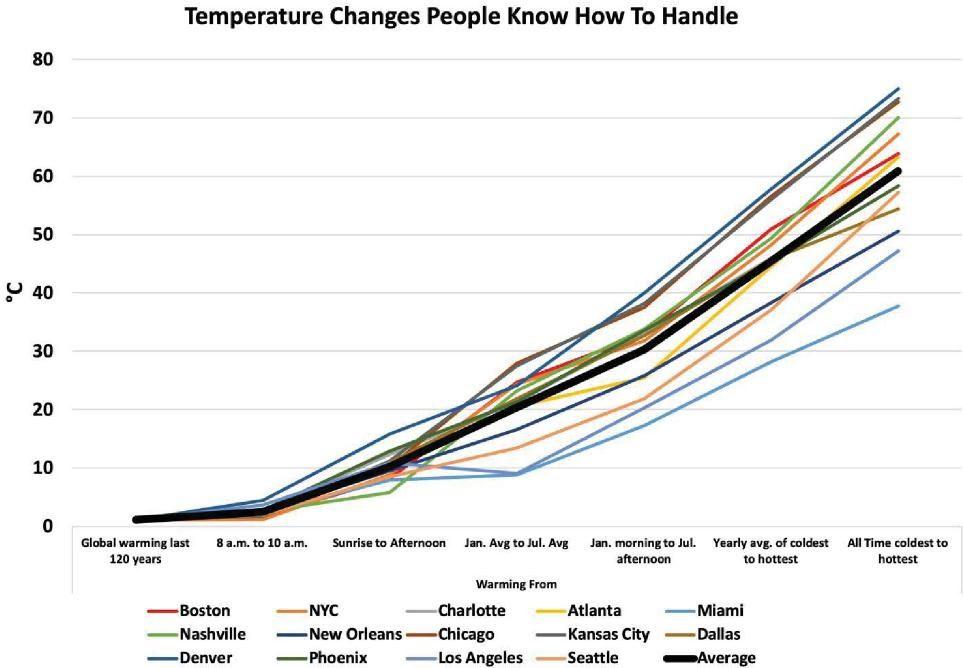
Indeed, the 1.2 degree Celsius global temperature change in the past 120 years, depicted as alarming is only equivalent to the thickness of the “Average” line in [the figure] below. As the figure shows, the difference in average temperature from January to July in these major cities ranges from just under ten degrees in Los Angeles to nearly 30 C degrees in Chicago. And the average difference between the coldest and warmest moments each year ranges from about 25 C degrees in Miami (a 45 degree Fahrenheit change) to 55 C degrees in Denver (a 99 degree Fahrenheit change). 57
56 Id. at 24, 96.
57 Richard Lindzen and John Christy, The Global Mean Temperature Anomaly Record, CO2 COALITION (Dec. 4, 2020), at 12.
There is no scientifically proven risk that CO2 and fossil fuels will cause catastrophic global warming, and the Proposed Rule should not be adopted.
2. 600 Million Years of Data Show Today’s 420 ppm CO2 Level Is Low.

The EPA, like many, asserts that today’s CO2 level is dangerously high and engages in what science deems falsifying data by cherry-picking a short period of geological time to prove its point: “CO2 concentration of 415 ppm is already higher than at any time in the last 2 million years,” and “elevated concentrations endanger our health by affecting our food and water sources, the air we breathe, the weather we experience, and our interactions with the natural and built environments.” 58
Two million years raises the obvious scientific question, what happened over geological time? The EPA omits and fails to consider the contradictory data over 600 hundred million years that prove CO2 levels today are near a record low: 59
The omitted hundreds of millions of years of data prove that:
• CO2 levels were more than 2,000 ppm for over half of the last 600 million years.
• Today’s 420 ppm is not far above the minimal level when plants die of CO2 starvation, around 150 ppm, when all human and other life would die from lack of food.
• CO2 levels ranged from a high of over 7,000 ppm almost 20 times higher than today’s 420 ppm, to a low of 200 ppm, close to today’s low 420 ppm.
58 88 Fed. Reg. 33,249–50 (footnotes omitted).
59 GREGORY WRIGHTSTONE, INCONVENIENT FACTS 16 (2017)
• The often highly emphasized 140 ppm increase in CO2 since the beginning of the Industrial Age is trivial compared to CO2 changes over the geological history of life on Earth.
What about temperatures?
3. 600 Million Years of CO2 and Temperature Data Contradict the Theory That High Levels of CO2 Will Cause Catastrophic Global Warming.
The chart below shows 600 million years of CO2 levels and temperature data. 60 It shows an inverse relationship between CO2 and climate temperatures during much of Earth’s history over the last 600 million years.

Higher levels of CO2 correlated with lower temperatures and vice versa. Although the data are based on various proxies, with the attendant uncertainties, they are good enough to demolish the argument that atmospheric CO2 concentrations control Earth’s climate and the theory that fossil fuels and CO2 will cause catastrophic global warming. They will not.
The blue line shows CO2 levels. The red line shows temperature.
Specifically, the chart shows:
• When CO2 was at a record high at about 7,000 ppm, temperatures were at a nearrecord low.
• CO2 levels were low when temperatures were at the highest they have ever been, about 60 million years ago.
• CO2 concentrations and temperatures are usually inversely related over 600 million years. For hundreds of millions of years, temperatures were low when CO2 levels were high, and temperatures were high when CO2 levels were low.
• CO2 levels have been relatively low for the last 300 million years and have been declining from 2,800 ppm to today’s 420 ppm over the last 145 million years.
• Temperatures have been higher than today over most of the 600 million years and life flourished (but not in Ice Ages).
Neither contemporary observations nor the geological record support computer modeling-based claims that CO2 is the “control knob” on the earth’s climate. There have been tremendous fluctuations in global temperature, including ice ages and warm periods, when there was negligible use of fossil fuels. A thousand years ago, during the medieval warm period (about 850–1250 A.D.), Greenland supported Norse farmers who grew crops such as barley, which cannot be grown there now because of the cold. There followed the Little Ice Age that lasted from about 1250–1850 A.D.; glaciers have been retreating ever since then. None of these fluctuations, far more dramatic than anything predicted by the studies on which EPA relies, were caused by, or had any correlation with, changing CO2 levels.
The IPCC provided this chart about the Medieval Warm Period (950–1250) and the Little Ice Age (1450–1850): 61
61 IPCC, CLIMATE CHANGE: THE IPCC SCIENTIFIC ASSESSMENT 203 (1990). We have confirmed this IPPC data from many sources.
The IPCC noted: The late tenth to early thirteenth centuries (about AD 950–1250) appear to have been exceptionally warm … This period is known as the Medieval Climatic Optimum…. This period of widespread warmth is notable in that there is no evidence that it was accompanied by an increase of greenhouse gases. (Emphasis added). 62
The little warming we observe now is a continuation of the 300-year warming that is a recovery from the depths of the Little Ice Age, as shown in the following chart: 63 62

Note that the blue line at the bottom shows that humans did not start emitting any significant amount of CO2 until after 1900, and only a trivial amount since the beginning of the Industrial Age from about 1750 to 1950.

No scientist familiar with radiation transfer denies that more carbon dioxide is likely to cause some surface warming. But the warming would be small and benign. In fact, history shows that warmings of a few degrees Celsius which extended growing seasons have been good for humanity. The golden age of classical Roman civilization occurred during a warm period as did the first great civilizations during the Bronze Age in the Minoan Warm Period.
Thus, applying the scientific method to the 600 million years of omitted and not considered data contradicts the EPA’s theory that fossil fuels and CO2 will cause catastrophic global warming. The theory does not agree with the facts, and the scientific method requires the theory must be rejected. For this reason alone, there is no risk CO2 and fossil fuels will cause catastrophic global warming.
4. Atmospheric CO2 Is Now “Heavily Saturated,” Which in Physics Means More CO2 Will Have Little Warming Effect.
Both of us have special expertise in radiation transfer, the prime mover of the greenhouse effect in Earth’s atmosphere. Radiation physics explains the effect of adding CO2 to the atmosphere.
CO2 becomes a less effective greenhouse gas at higher concentrations because of what in physics is called “saturation.” Each additional 50 ppm increase of CO2 in the atmosphere causes
a smaller and smaller change in “radiative forcing,” or in temperature. The saturation is shown in the chart below. 64
This means that from now on, our emissions from burning fossil fuels will have little impact on global warming. We could double atmospheric CO2 to 840 ppm and have little warming effect.
Saturation also explains why temperatures were not catastrophically high over the hundreds of millions of years when CO2 levels were 10 to 20 times higher than they are today, shown in the chart above.

Further, as a matter of physics, saturation explains why reducing the use of fossil fuels to Net Zero would have a trivial impact on climate, also contradicting the theory it is urgently necessary to eliminate fossil fuel CO2 to avoid catastrophic global warming. Adding more CO2 to the atmosphere slightly decreases the amount of long-wave infrared radiation that goes to space, called the “flux.” The details are shown in the graph below. 65
The blue curve shows the heat energy the Earth would radiate to space if our atmosphere had no greenhouse gases or clouds. The magnitude is measured in Watts per square meter (W/m2). Without greenhouse gases, the total heat loss of 394 W/m2 would soon cool the Earth’s surface to
64 Id. at 7.
65 William Happer & Williaam Van Wijngaarden, Dependence of Earth’s Thermal Radiation on Five Most Abundant Greenhouse Gases, ARXIV (June 8, 2020), 2006.03098.pdf (arxiv.org)
16° F, well below freezing. Most life would end at these low temperatures. Thus, we should be grateful for greenhouse warming of the Earth.
The jagged black curve below the blue curve shows how much less the Earth radiates infrared radiation to space with the current concentration of greenhouse gases: water vapor (H2O), nitrous oxide (N2O), carbon dioxide (CO2), ozone (O3), and methane (CH4). Because of these greenhouse gases, the Earth radiates 277 W/m2 rather than 394 W/m2 to space, 70% (277/394) of what it would radiate with no greenhouse gases.
What would happen if CO2 concentrations were doubled from 400 ppm to 800 ppm?
• without the greenhouse effect, 394 W/m2 would be radiated to space;
• with the greenhouse effect, only 277 W/m2 is radiated to space;
• if CO2 were doubled from 400 ppm to 800 ppm, only 3 W/m2 more warming would result. (See the red curve.) That means a temperature increase of a trivial amount, less than 1° C (2° F).

Since CO2 at today’s level is “saturated,” for this reason alone there is no risk that the continued use of fossil fuels and even a doubling of atmospheric CO2 will cause catastrophic global warming.
It bears noting that CO2 is not nearly as potent a greenhouse substance as water vapor and clouds (especially cirrus clouds). A radiation-blocking effect of only about 3 watts/m2 could easily also be produced by changes in the size or height of cloud cover on any given day. This is a complex system, and the idea that one variable, globally average temperature, is changed primarily by one thing, manmade CO2, is baseless. As one of us (Lindzen) has explained:
The climate system consists of two turbulent fluids interacting with each other, [ocean and atmosphere]. They are on a rotating planet that is differentially heated by the sun. A vital constituent of the atmospheric component is water in the liquid, solid, and vapor phases, and the changes in phase have vast energetic ramifications.
The energy budget of this system involves the absorption and remission of about 200 watts per square meter. Doubling CO2 involves a two percent perturbation to this budget. So do minor changes in clouds, ocean circulations, and other features, and such changes are common. In this complex multifactor system, what is the likelihood that the climate (which itself consists of many variables and not just globally averaged temperature anomalies) is controlled by a two percent perturbation in the energy budget due to just one of the numerous variables, namely CO2? Believing this is pretty close to believing in magic. 66
In summary, the EPA’s Proposed Rule fails to consider these four critically important aspects of climate change the extraordinary social benefits of CO2, the extraordinary social benefits of fossil fuels, the disastrous consequences of Net Zeroing them, and the reliable science that proves there is no risk fossil fuels and CO2 will cause catastrophic global warming singly or together, renders the EPA’s Proposed Rule arbitrary and capricious under State Farm (as well as an egregious violation of the scientific method by omitting relevant contradictory data).
VI. EPA’s Proposed Rule Relies on Studies That Violate Scientific Method, and Thus Have No Scientific Value.
The Proposed Rule relies on a number of studies that involve egregious violations of scientific method, and thus have no scientific value. As a result, they contaminate the Proposed Rule and there is no need to analyze the other studies the Proposed Rule relies on.
We focus on the following:
• Framework for Evaluating Damages and Impacts (“FrEDI”), already covered in Part IV.D.1.
• U.S. Global Change Research Program’s (“USGCRP”) Fourth National Climate Assessment 2017–2018 (“NCA4”).
• EPA 2009 Endangerment and Cause or Contribute Findings for GHGs Under section 202(a) of the CAA (December 15, 2009). 67
• All IPCC studies (Sixth Assessment Report (AR6) (2022), Warming of 1.5 °C (2018), Climate Change and Land (2019), Ocean and Cryosphere in a Changing Climate (2021)).
• The primary basis of the Regulatory Impact Analysis (“RIA”) section 4 Benefits Analysis, the Interagency Working Group, “Technical Support Document: Social Cost of Carbon, Methane, and Nitrous Oxide Interim Estimates under Executive Order 13990” (“February IWG SCC Estimate”).
• National Academy of Sciences (“NAS”) Valuing Climate Damages: Updating Estimation of the Social Cost of Carbon Dioxide (2017).
66 Richard Lindzen, “Straight Talk About Climate Change,” Acad. Quest. (2017), p. 432.
67 74 Fed. Reg. 66,496.
A. All Never Considered the Four Critically Important Aspects and Relevant Data.
All of the above studies failed to scientifically consider the extensive science and data on the critically important social benefits of carbon dioxide, the critically important social benefits of fossil fuels, the disastrous social consequences of reducing them to Net Zero, and the scientific proof there is no risk carbon dioxide and fossil fuels will cause catastrophic global warming. In science, omitting data that contradicts a scientific theory is an egregious violation of the scientific method.
Accordingly, for this reason alone, the studies have no scientific value and contribute no scientific knowledge. Their use in the Proposed Rule contaminates it scientifically.
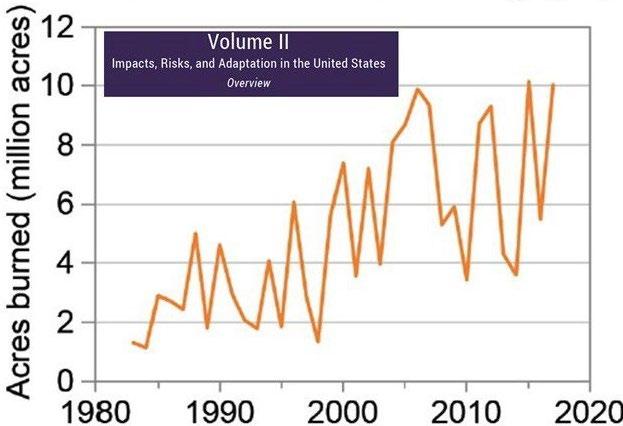
B. The USGCRP Fourth National Climate Assessments (NCA4).
Thirteen federal agencies comprise the U.S. Global Change Research Program (“USGCRP”) and are required to prepare a National Climate Assessment (“NCA”) about every five years. Their 4th NCA was published in two volumes: Vol. I “Climate Science Special Report” (CSSR) (2017) and Vol. II: “Impacts, Risks, and Adaptation in the United States” (2018). They are preparing their 5th National Climate Assessment now for release later this year.
The Proposed Rule cites NCA4 warnings about extreme weather multiple times: “The NCA4 … evaluated a number of impacts specific to the U.S. Severe drought and outbreaks of insects,” “Wildfires have burned more than 3.7 million acres in 14 of the 17 years between 2000 and 2016,” “The rate of sea level rise during the 20th Century was higher than in any other century in at least the last 2,800 years,” “Droughts, floods, storm surges, wildfires, and other extreme events stress nations and people through loss of life, displacement of populations, and impacts on livelihoods.” 68
The Proposed Rule asserts repeatedly that the nation faces extreme weather events caused by fossil fuel CO2 and other greenhouse gas (“GHG”) emissions, and therefore that GHG emissions from power plants must be dramatically reduced. For example, “The increased concentrations of GHGs in the atmosphere and the resulting warming have led to more frequent and more intense heat waves and extreme weather events,” “Climate change is also expected to cause more intense hurricanes,” and “more intense and larger wildfires.” 69
Shockingly, the NCA4 CSSR fabricated, falsified and omitted contradictory data on, for example, heat waves, hurricanes, wildfires and sea levels.
1. Heat Waves.
The CSSR reported “Record Warm Daily Temperatures Are Occurring More Often” with the chart below in its Executive Summary creating the misleading appearance that temperatures are going through the roof: 70
68 88 Fed. Reg. 33,250–51.
69 88 Fed. Reg. 33,243, 33,249.
70 NCA4 CSSR at 19, fig ES.5.
This chart does not actually show “daily temperatures.” Instead, it shows a “ratio” of daily record highs to lows a number that appears designed to create the impression that temperatures are steadily rising.
Daily temperatures were buried on page 190 of the CSSR report, in a chart that contradicts the Executive Summary chart. The spiked lines show yearly values, and the dark line shows the daily average temperatures over the last 120 years. 71

It shows that:
• the average warm temperature today is about the same as it was in 1900;
• the warmest temperatures are not occurring more often; and
• not surprisingly, the hottest temperatures occurred during the Dust Bowl in the 1930s. The EPA graph below confirms there is nothing out of the ordinary about recent heatwaves, showing an index of heat waves from 1890 to 2020, again showing the hottest temperatures were during the Dust Bowl: 72
72 EPA, U.S. Annual Heat Wave Index 1895–2015 (2016), fig. 3, https://www.epa.gov/climate-indicators/climate-change-indicators-heat -waves

Below is a chart that Dr. John Christy prepared showing the number of days of daily maximum temperatures above 100° F and 105° from 1895 to 2015. Days with temperatures of at least 105° F peaked in the 1920s and 1930s. 73
73 US Extreme High Temperatures Chart, DR ROY SPENCER, US-extreme-hightemperatures-1895-2017.jpg (3000×2250) (drroyspencer.com)

Thus, the NCA4 CSSR’s Executive Summary stating, “Record Warm Daily Temperatures Are Occurring More Often” and its ratio chart are termed fabrications by science. 74 Frankly, it is appalling that the thirteen federal agencies that make up the USGCRP would rely upon and publish such a falsehood in a National Climate Assessment.

2. Hurricanes.
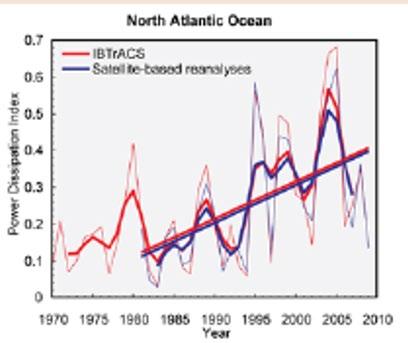
The USGCRP’s Third National Climate Assessment in 2014 asserts hurricanes are getting worse:
Key Message 8. The intensity, frequency and duration of North Atlantic hurricanes, as well as the frequency of the strongest (Category 4 and 5) hurricanes, have all increased since the early 1980s. 75
The report supports that statement with the graph below purporting to show an alarming increase in the strength of North Atlantic hurricanes, measured by what is called the Power Dissipation Index (“PDI”). The graph shows two sets of data from 1970 to 2010, with a sharp upward trend in the black line when the two are combined: 76
74 DAVID GOODSTEIN, ON FACT AND FRAUD 135 (2010) (“Fabrication is making up data or results.”).
75 Id. at 115 (emphasis added).
76 Id. at 40, fig. 2.23.