The Rational Climate e-Book

Cooler is Riskier
The Extended 2nd Edition
Patrice POYET


Patrice POYET3
https://patricepoyet.org/ patrice.poyet.science (at) gmail (dot) com
October 5th, 20224
Version 2.28
1 CO2 is painted in its devil suit, with black Carbon and two red Oxygen atoms, but freethinkers hold that knowledge should be grounded in facts, scientific inquiry, and logic, see also (Jacoby, 2005). If you liked this work, in exchange for getting it for free, then please recommend it to ten people. You can also become a member or make a donation to support those organizations: cato.org cei.org ceres-science.com climatecite.com climatedepot.com clintel.org co2coalition.org co2science.org friendsofscience.org geoethic.com heartland.org jennifermarohasy.com notrickszone.com plantsneedco2.org saltbushclub.com scienceandpublicpolicy.org tambonthongchai.com thegwpf.org and for the French speaking readers the association of the climato-realistes.fr does an excellent job.
2 When scientific views come under political attack, so too does independent thinking and good policy-making because all require rational thought to be effective, (Legates, 2014).
3 https://www.researchgate.net/profile/Patrice_Poyet - http://independent.academia.edu/PatricePoyet
4 This e-book is under permanent on-going peer-reviewing. It also keeps being extended and improved. So, please refer to this date when communicating with the author so as to identify the version and help improve the document. Check regularly the website to ensure that you have the latest release
Copyright © 2020, 2021, 2022 by Patrice POYET. All rights reserved.
e-ISBN 978-99957-1-929-6 delivered by Malta's NBC/CPL National Book Council Central Public Library – Floriana - Malta
Copyright of this work covers, as per Maltese Law, (NBC, 2017):
• The right to reproduce the work;
• The right to distribute the work;
• The right to prepare derivative works;
• The right to perform the work;
• The right to display the work;
• The right to license any of the above to third parties
There are two types of rights under copyright: economic rights and moral rights. Both are retained.
The objective of this e-book is to be made as widely available to the interested public as possible, and every reader is encouraged to send it to as many persons as he/she wishes. Nevertheless, this e-book or any portion thereof may not be used by professionals for a non private usage in any manner whatsoever without the express written permission of the rights holder except for the use of brief quotations in an article, a paper, a report, a review. If used in that context by subsequent authors, proper citation must be made.
To the young generations, with thecertainty thattheEarthwill be worth inheriting and that they will strive to make mankind's adventure even greaterandmorefulfilling.
How to cite this version of this e-book: Poyet, P., 2022. The Rational Climate e-Book: Cooler is Riskier. The Extended 2nd Edition, October 5th, 174 Figures, 261 Equations, 2432 references, 655 pp., e-ISBN 978-99957-1-929-6
“The fight against climate change is incompatible with international tourism and many economic sectors. The measures that should be taken will be difficult to accept. It can be said that the fight against climate change is contrary to individual liberties and therefore undoubtedly to democracy” — François-Marie Bréon in an interview with a national French newspaper “Libération” (Coulaud, 2018)
A dystopia is usually defined as an imagined state or society in which there is great suffering or injustice, typically one that is totalitarian or post-apocalyptic. Dystopias are characterized by rampant fear or distress, in our case coming from a looming impeding environmental disaster which has been progressively inculcated in the thinking of several generations from whom the capacity for scientific analysis and criticism has been progressively removed by eliminating mathematics of the cursus and anihilating their critical sense. Such a situation characterised by largely fantasized environmental collapse will justify tyrannical governments that in turn will lead as always to a cataclysmic decline in society and human well being. As for 1984 (Orwell, 1984) a date has been given for the disaster in the making, i.e. 2050 the net-zero carbon emission target. Let's see from where we start and how we sadly have a possibility of seeing the dystopia turn into a devastating reality.
But first, let's try to restore some basic calculating skills based on elementary physical laws that have been presented in this book. From the Stefan-Boltzmann Law (SBL) given by Equation 106, p. 110, has been easily derived by differentiation the Equation 173, p. 122, that can be used to evaluate the impact on the Earth's temperature of any flux imbalance (e.g. due to an increase of GHGs it is supposed that the OLR be reduced while the incoming solar flux remains constant at 240 W/m2), for a given ECS. If one wants to change the ECS value he / she wishes to use and derive the corresponding equations, it is very easy to do so. This will enable to select the ECS one considers the most reasonable, derive the constants to be used in the corresponding equations and make the calculations to get first hand values of the warming to be expected from such an ECS or TCR.
So, we need an ECS, let's chose one. From the computations we made that led to Equations 101 and 102 p. 96, we derived for a doubling of [CO2] a ΔF=3.23 W/m2, then using the best Radiative-Convective simulation software MODTRAN as seen Figure 135, p. 328 and given the results summarized in the corresponding Table, we got an ECS of 3.33 W/m2 for a doubling of [CO2] from 400 ppm to 800 ppm, we can also use values from the peer-reviewed literature, e.g. like Harde (2013) who gives ΔF=2.6 W/m2, or Schildknecht (2020) with a ΔF=2.6 W/m2, or other models of radiative transfer as per (Gervais, 2014) or Ollila (2017b) with a ΔF=2.2 W/m 2. Some values, like those given by Sherwood et al. (2020) could be considered as slightly higher but would not change the overall picture.
A simple average of these values will give 2.80W/m2, that will be conservative. The reader may use any other value he / she choses and will see that it does not change from where we start the dramatic journey to the future dystopian world. Given an ECS characterized by a ΔF=2.80 W/m2 and using equation 173, p. 122, that overestimates the ΔT because it only relies on radiative transfers and not on thermodynamical ones based on evapo-transpiration as explained p. 96 in order to derive Equation 102 and the corresponding ECS of only 0.48°C, one can immediately derive for a reference temperature of 288K a value of ΔT=(228/4) x 2.8 / 240 =0.84°C. Due to the downward trend of the ECS values observed over the last two decades as reminded by Gervais (2022) Fig 1.2, one should not be surprised to use a value < 1, actually no ECS value > 1 should be considered realistic. From thereoff, one can derive an equation that will give for any increase of the [CO2] the corresponding ΔT (ln is of course the the Neperian logarithm):
For such an ECS value of 2.80 W/m2 one can derive the value of the ΔF expected for any increase of the [CO2]:
Thus, given an ECS value that one can chose as what he considers the most reasonable one (here 2.80 W/m 2, but any other reasonable value can be used), it is not extremely easy but elementary to derive the corresponding equations that enable to compute the values of ΔT and ΔF for any increase of [CO 2], as given by the above Equations 260 and 261. This will enable us to compute various key starting points from which the climate hysteria leads to the dismal dystopia ahead.
Even though there is no reason to believe that the [CO 2] increase since 1850 would be entirely of an anthropogenic origin as was explained e.g. in section “A New Carbon Budget at a Glance”, p. 128, such an extreme assumption will be made to evaluate the worst case. Given that long before the industrial age in 1850, the [CO 2] = 284.7 ppm (supposedly as no IR measurements were available before 1958) and in 2021 there is a [CO 2] = 414.72 ppm, one can immediately derive that the contribution of CO2 to the observed warming since the end of the Little Ice Age is of a maximum of 1,21*ln(414.72/284.7)=0.45°C.
Let's state that clearly: the warming since 1850 due to the increase of [CO2] is of a maximum of 0.45°C.
Then let's figure out what is the warming that can be expected until 2050. First one should note that there exists a large inter-annual variability, that by the way in itself demonstrates that mankind cannot be the sole responsible for what is observed. Figure 22, p. 61, showed clearly that man-made emission in red have been increasing at an accelerated pace while annual ppm increase in dark blue have progressed at a very irregular rate that is not correlated to the emissions but to the temperature as explained in Figure 20, p. 59. But, again, let's go for the worst case and consider an high rate of 2 ppm increase per year (that could happen to be much lower or even reverse if the temperature was to cool and the Temperature Anomaly (TA) drop to -0.8°C, see Equation 34, p. 59), but let's see how much warming we will have in 2050. Using Equation 260, we get: 1.21 * ln [ ((28 years * 2 ppm) + 414.72) / 414.72] = 0.1532°C.
Let's state that clearly: without any reduction of the emissions the maximum warming in 2050 will be of 0.15°C.
This result is worth taking a pause, a great world reset of our entire economies, of our energetic systems, of our entire mode of living is envisaged because there could be, in the worst case, a warming of 0.15°C in 2050
Pinch yourself, check that you are well awake, we are talking about 0.15°C by 2050. Furthermore, the worst case is just the best case as a warming of 0.15°C is always better than a cooling of 0.15°C, because it will be explained later “Why a Warmer World is a Better Place to Live”, p 517.
CountryMtCO2/yr% emissions°C/yrUntil 2050
China1017528,36%0,00106840,0299145
USA528514,73%0,00055490,0155379
India26167,29%0,00027470,007691
Russia16784,68%0,00017620,0049333
Japan11073,09%0,00011620,0032546
Iran7802,17%0,00008190,0022932
Germany7021,96%0,00007370,0020639
Indonesia6181,72%0,00006490,0018169
South Korea6111,70%0,00006420,0017963
UK3701,03%0,00003890,0010878
France3240,90%0,00003400,0009526
Figure 169.Image of the calculated Table for the ECS of 0.84°C, that gives for each country its emissions in MtCO 2/yr, the % of the total emissions (35881 MtCO2/yr) that it represents, its annual contribution to the yearly warming and its contribution to the warming until 2050 if emissions keep going unabated until then.
To see how much each country contributes to such a dramatic warming we need to know the emissions per country and the impact of each ton of CO2 emitted. Then one can sum up everything in a table (see Figure 169) that will clarify your mind. Let's see: for 414.72 ppm in 2021, the stock of CO 2 in the atmosphere is 414.72*7.8=3,235 GtCO2. To
increase the temperature of 0.84°C (as per the ECS used), given the Airbone Fraction 646 (AF) of 40% used by IPCC (Jones and Cox, 2005), i.e. the percentage of the man-made emissions in % considered as remaining in the atmosphere, one can see that for a doubling of [CO2], one needs emission to be (3.235 1012 / 0.40) = 8.087 1012 tCO2. Then one can easily compute the temperature increase per ton of CO2 or per GtCO2. Simplifying, we have 8 1012 tCO2 that increase the temperature of 0.84°C, thus 1 GtCO2 will increase by (0.84 * 109) / 8 1012 = 0.000105°C/GtCO2, thus 1.05 10-13 °C/tCO2 We just need now the annual emissions per country, to see how much each country contributes on a yearly basis to the increase of the temperature and then how much each country will contribute until 2050, if emissions remain unabated.
What does Figure Figure 169 show? That China, India, Russia and Iran represent nearly half of the emissions (42.5%) and that they will, as many other developing nations, apply Napoleon's adage "Never interrupt an enemy making a mistake", they basically say that it is important to reduce emissions, but do nothing to reduce theirs while China has been building more coal-powered plants than ever, and not only in China but everywhere. In the meantime, France, for example, will destroy its economy, the way of living and the well being of its citizens to reduce, if its emissions were truly cut to zero by 2050, by less than one thousandth of a degree its contribution to the Anthropic Global Warming! The UK, if it were to continue its emissions unabated would contribute to 0.001°C and Germany up to 0.002°C. Of course, these values are well below measurement thresholds and they show how meaningless the net-zero 2050 objectives are.
Thus, once the very basic facts about the impact of mankind on global climate until 2050 have been reminded to the reader above and considering the deluge of cataclysmic words used to describe the climate crisis, the climate emergency, no, even a catastrophe of apocalyptic and biblical proportions such that McGrath (2021) forecasts for the BBC stating that “Climate change: IPCC report is code red for humanity” one knows that all nuts have gone loose and can logically deduce as O'Neill (2021) does that "It is the hysteria of climate change that poses the greatest threat to humanity” and further develops “These are just some of the hysterical claims that have been made in the discussion around COP26. As world leaders private-jetted their way to Glasgow for the latest UN gabfest on how to save the planet from mankind’s dirt, hubris and avarice, there was a severe outbreak of Climate Derangement Syndrome. Prime ministers, bishops, princes and noisy greens all tried to outdo each other with their apocalyptic warnings. It has been a grim competition of catastrophes, an orgy of hyperbolic prophecies that wouldn’t look out of place in the Book of Revelation.”
How could such a Climate Derangement Syndrome (CDS) develop to a point where it turns into a societal hysteria while more than half the countries will not reduce their emissions until 2050 anyway (if we add South Africa 479 Mt, Brazil 466 Mt, Mexico 439 Mt, Thaïland 288 Mt, Malaysia 250 Mt, Vietnam 248 Mt, Argentina 179 Mt, Philippine Islands 144 Mt, Chili 84 Mt with figures as of 2019), and when, if even cutting the emissions to zero by 2050, which is highly unrealistic, will prevent a warming of less than a thousandth of a degree for most G8 countries and of 0.015°C for the USA for the current cumulated future emissions for 28 years? Answering that question is difficult as it raises puzzling issues, that go beyond the madness of crowds (Mackay, 1841). It was exposed that many vested interest plan to take advantage of the delusion and this is of course a strong driving force. Beyond that, the birth of such noxious ideas can be traced back to two essentially wrong visions:
• The first is a Malthusian approach to the world, as Paul Ralph Ehrlich did in his time by publishing The Population Bomb (1968), The Population Explosion (1990), Optimum Human Population Size (1994), works which placed him among the few to have made forecasts invalidated by the facts for more than half a century. Curiously, this record has not prevented him from obtaining numerous prizes and awards, including the Crafoord Prize (1990). All of his ideas have been wrong to an extent that is beyond comprehension.
• The second is that the climate, which is an extremely complex system, could be "regulated" or controlled by a single parameter, i.e. CO2 concentrations. This is obviously very naive. Anyone, even in very bad faith, knows that applying the law of Myhre et al (1998) and adding a positive feedback from water vapor, results for acceptable values of ECS and TCR, only in a very modest warming by IR absorption of CO 2 on the 15µ band (the rest being already absorbed by water vapor). This was mentioned just above.
"The battle to feed all of humanity is over. In the 1970s hundreds of millions of people will starve to death in spite of any crash programs embarked upon now."— Paul Ehrlich, the media’s leading environmental expert for 50+ years (1968)
646 The airborne fraction is defined as the ratio of the annual increase in atmospheric CO 2 to the CO2 emissions from human sources. It represents the proportion of human emitted CO2 that remains in the atmosphere, 40% is used as per (Jones and Cox, 2005).
Thus, expecting ministers, climate czars or ambassadors, mayors, judges, intellectuals, scientists, etc., to plan relevant actions on climate according to a soviet logic is a nonsense. Non only did communism never succeed to forecast the shoes' production that was always increasing while everybody was nearly going barefoot, but now they are going to regulate the climate, why not tides and more? Nigel Lawson647 was Secretary of State for Energy (1981-83) and Chancellor of the Exchequer (1983-89). He is the Honorary President of the Global Warming Policy Foundation and author of “An Appeal to Reason: A Cool Look at Global Warming” (2008). He summarized the situation saying that “ Net zero is a disastrous solution to a nonexistent problem”. Though not a scientist by training, Lord Lawson make a perfectly correct analysis of the madness of the situation and he suggested from the outset that the current climate scare is a quasi-religious hysteria and insisted that humanity seems to have a psychological need for a belief system. Christianity, which has played this role in the West for centuries, is losing ground in the modern world and climate catastrophism has effectively replaced it. Policies aimed at saving the planet will have no effect on the climate but will ruin the countries that were in a position to have a useful environmental action, to fight against pollution, overexploitation such as overfishing, immoderate use of mineral resources, etc. For anyone who just takes a few hours to figure things out, things appear quickly clear and obvious. It is therefore required to switch to social sciences to get some hints to what is happening.
Science is the search for the Truth as its etymology says in Greek, but as all dystopia are built on fake assumptions they must erase the truth or build alternative realities, based on pseudo-science while distorting facts. This process was studied by Magomedov (2021) who states “Whenever we think of impostors, we tend to think of liars. Yet impostures cannot be phenomenologically reduced to lies. Every lie presupposes a distinction between true and false, and it operates through a negation of reality, presenting falsity as truth and vice versa. An imposture, on the other hand, seeks to erase the distinction between true and false altogether. An impostor constructs a fiction that aims at substituting reality. In this process, an entire network of lies is put to work in order to attain the ontological status of the real. This results in a dynamic that deprives truths of their authority, while making untruths highly potent in terms of their capacity to produce effects”. This is exactly where we find ourselves, at the foot of the net-zero wall into which our economies will crash, for the simple reason that, even if it were really a requirement, there is neither a technological nor an economically viable way to achieve it.
Psychologists have some understanding of such situations. Uche (2011) asserts that “Human beings, regardless of race, religion or culture, are likely to embrace any belief that is absolute. This is because absolute beliefs are simple, easy to comprehend, and false positives that offer us a false sense of security”. CAGW belongs to that sort of absolute thinking, it is (rather appears) simple as carbon dioxide increases the greenhouse effect (not knowing exactly what it means fro most) and thus lead to an increase of the temperature, that everybody can observe (especially when series have been adjusted). Thus, the believer is rewarded by being obviously right against the “flat-earthers” and by belonging to the right group of people, those who will save the planet from the bad people those who want to continue emitting carbon dioxide, because they are reckless and do not care for their children.
The desire to belong to the right group of people is so pregant that even scholars like Tim Palmer, during the COP26, have lost their sense. Palmer has abandoned the reserve and wisdom that he had long shown to tip over into climate hysteria and predict Hell, forgetting that he had previously said in Palmer (2012) that our ability to predict the climate remained rudimentary. So what has changed since 2012, except that the group, the pack, the COP26 takes all the reasons in its path. Koonin (2021) is far more realistic is his assessment of the situation “ The uncertainties in modeling of both climate change and the consequences of future greenhouse gas emissions make it impossible today to provide reliable, quantitative statements about relative risks and consequences and benefits of rising greenhouse gases to the Earth system as a whole, let alone to specific regions of the planet.”.
This is where Uche (2011) reminds us that “The problem with absolute thinking is that it causes pain and suffering in the life of the person who adheres to an all-or-nothing attitude in any facet of his thought process. This is because the person is routinely exposed to contradictions to his beliefs, which creates a sense of threat to his world view. Eliminating the threat (canceling) brings about relief and even the canceling of any contradiction provides reassurance. This is why absolute thinking is the genesis of, among other things, genocides.”
When hearing statements that are universally absolute like: “the science is settled”, one knows that we are dealing with a cult, not science. Contradiction that should foster the scientific exchange to enable progress is crushed, people with
647https://en.wikipedia.org/wiki/Nigel_Lawson
non conforming views are censored because they frustrate the mob of the believers (my LinkedIn account was closed for disseminating disinformation!), and the green fascism is no different from the brown or any other fascism, it crushed all that stand in its path because preserving the belief becomes the goal of the group despite all evidences proving that it does not stand scrutiny and cannot account for the reality.
It is why the governments’ statements about carbon zero and the road to zero emissions are dangerous. Because they’re absolute, allow for the demonization, and hence eradication of anyone that opposes this narrative. This means that most anything can be done in the name of these topics and escape scrutiny which would otherwise not be the case. Failed predictions that are just beliefs have plagued the entire history of the CAGW narrative, but the solution as for all fascism is to rewrite History for the production of shoes must have increased despite the fact that nobody can find any to buy not to go barefoot.
Censoring contradiction is a perfect recipe for a planned disaster, wasn't the official journal called “The Pravda”, i.e. the Truth (there can only be one in these authoritarian systems). One must acknowledge what has given strength and depth to our free and open societies: free speech. As long as what is expressed is not offensive to the other, it should be possible to express one's view.
So many scholars have nice quotes addressing that:
“I would rather have questions that can't be answered than answers that can't be questioned.” ― Richard P. Feynman
"Unthinking respect for authority is the greatest enemy of truth" - Albert Einstein
"If speculative ideas (climate catastrophists claims) can not be tested, they are not science; they don't even rise to the level of being wrong." Wolfgang Pauli.
“When scientific views come under political attack, so too does independent thinking and good policy-making because all require rational thought to be effective” (Legates, 2014).
Leon Festinger was already mentioned in a previous section dealing with “Cognitive Dissonances” and note 556, p. 449. He analyzed that when observable facts contradict a belief, the ideologue or prophet of doom does not question himself but instead develops an increasingly extreme and proselytizing speech. The slogans become empty shells, accompanied by insults and threats against the miscreants, the deniers. By displaying his faith, each follower reinforces the faith of others. So much the worse if the speech and the analysis lose all contact with reality, only the survival of the belief matters. This is what I experienced on LinkedIn, thanks to them for closing my account, this gave me my time back to write this second edition. The proponents of the CAGW conjecture was for them an absolute truth that one could not challenge nor discuss and they had very well-honed activist strategies, asking for your credentials when they had none, having some sort of ready-made answer for any point of contention kind of like if they had done telephone support, like problem X type Y, etc., with ready-made references. They were not interested in exchanging ideas or improving their understanding, they were essentially engaged in defending their belief, whatever it meant.
The amount of resources the climate tribe has is disproportionate to those that other non aligned scientists can resort to. Beyond the fact that you cannot get a grant if you do not conform with the dogma and must work on shoe string budget or no budget at all, grants and donations flood the well conforming universities and laboratories. We do not talk about individual 10$ gifts, but of 1.1 billion as for recent Doerr's donation, see e.g. Gelles (2022) “ The gift establishes the Doerrs as leading funders of climate change research and scholarship, and will place Stanford at the center of public and private efforts to wean the world off fossil fuels”. What's amazing is that neither the donors nor the report do not embarrass themselves with making it look as if it were still science, the objective is not to better understand the complex Earth-system, magnetosphere and dependencies to the planetary environment and solar connections, no the objective is “to wean the world off fossil fuels”.
If this is undoubtedly a massive donation, the second ever, one must keep in mind that research is the tip of the climate cult cartel as the world bank estimates that a minimum of 89,000 billions USD will be required by 2030, not counting to what is planned for the net-zero 2050 fantasy. Astronomical figures that are tossed have been nudged up to 150,000 billions USD, and one really wonders how badly they are going to be wasted as the total of the last column Figure 169, is less than 0.14°C for the entire world knowing that half of the countries will not embark on the road to economic death. The citizens would certainly fare much better off having kept these monies for their well being instead of being
stolen one way or another through complex taxation schemes of their hard earned savings to let our great leaders appear as the benefactors of this brave new world.
The climate cult cartel does not support the contradiction any more. Dissenters are fired or let go, the sooner the better when they approach retirement, publishing anything that upsets the narrative is made harder than ever and if published never sure not to be retracted as happened to Richet (2021) with his paper published on 26 May 2021 then retracted on 10 September 2021 without other reason than to have upset the French IPCC's representatives or to Zharkova et al. (2019) published in Nature scientific reports on 24 June 2019 to be finally retracted on 04 March 2020 based on spurious arguments that were contested by three of the authors 648. Social medias have been put under Artificial Intelligence (AI) surveillance and resort to immediate sacking of your posts if you do not align. Pseudoscientific organizations with blatant vested interests, as all their participating members make a living one way or another pushing the AGW narrative and fable649, dare fact-check what one posts and one always risks to be removed from the social network if he does not comply with the doctrine, better called the terms of services. I talk first hand experience. Furthermore, e.g. LinkedIn promote the Center for Countering Digital Hate, who beyond their normal woke business, attack directly the most fundamental freedom of speech that must be granted to scholars and researchers.
There are countless obvious examples of such baseless censorship practices, let's provide one here: https://www.johnstossel.com/ https://www.johnstossel.com/climate-feedback-response/
As if never enough, dissenters, deniers and contrarians of all sorts must be listed in files, monitored and they must be denigrated, ridiculed, threatened and if not enough some nuts like the Australian-born Professor Richard Parncutt can even go as far as claiming that deniers or heretics like Freeman Dyson and dangerous similar ones, should get the death penalty. If things keep going that way, the climate cult cartel and the climate church will have similar organisations to the former inquisition650 and and will have nothing to envy them. On the road to these delirious ideas, some people get very decent funding whereas they most of the time lack the slightest scientific training in particular in Earth or atmospheric sciences, and they are commited to making the narrative compliant by all means by “Documenting and Responding to Climate Disinformation at COP26 and Beyond” as per King et al. (2022) that really gives a chill in the back, going as far as identifying their targets, i.e. the ‘Repeat Offender’ accounts with names such as Peter Imanulesen, John Stossel, Michael Shellenberger, Bjorn Lomborg, Tony Heller, Patrick Moore, etc. The 116 pages long report is just a long list of coercive methods to enforce the CAGW narrative, ensuring that the recalcitrant will be brought to heel.
The worst thing is that the IPCC has the gall to complain about the politicization of science, it is the pot calling the kettle black. Climate science is and has been politicized since the IPCC was launched after all, that's the very mission of an organization that tells what science should be according to a UN mandate and that makes science be validated by the nations and government representatives participating to the scheme. Not one scientist, not a single one can accept that science be promulgated by governments, Royals, autocrats, kleptocrates, crony capitalists, bureaucrats, NGOs, affiliated research organizations that follow the governments' line of thought to keep their funding alive and the nomenclatura that fly jets from one COP to the next. They are laughing at you, can't you see that?
And now the IPCC want you to believe that they are the victims of the very system they have enforced by all means. In February 2022, the Intergovernmental Panel on Climate Change (IPCC) took an unprecedented step, citing mis- and disinformation and the “politicization of science” as key barriers to action. King et al (2022) report “ For the first time, a document accepted by all Member Governments stated that rhetoric from “vested economic and political interests… undermines climate science” and in turn has driven “public misperception of climate risks and polarised public support for climate actions”. The diagnosis was explicit, and built on a growing body of evidence produced across the environmental and research sectors in recent years: to solve the climate crisis, we must also tackle the information crisis. aftermath of COP26, we have clear evidence of the challenge at hand: the failure to stem mis and disinformation online has allowed junk science, climate delayism and attacks on climate figures to become mainstreamed. Our analysis has shown how a small but dedicated community of actors boast disproportionate reach and engagement across social media, reaching millions of people worldwide and bolstered by legacy print, broadcast and radio outlets. Far from helping to mitigate this issue, tech platform systems appear to be amplifying or exacerbating the spread of such content. Moreover, the taxonomy of harm relating to climate mis- and disinformation has been poorly defined to date,
648https://www.nature.com/articles/s41598-019-45584-3 and retractation: https://www.nature.com/articles/s41598-020-61020-3 649https://climatefeedback.org/community/ 650https://en.wikipedia.org/wiki/Inquisition and https://en.wikipedia.org/wiki/Roman_Inquisition
providing an inadequate basis for response”. As one may wonder what are the trainings of the authors of the King et al (2022) report's authors to spot people like me, whose LinkedIn accounts must be closed for propagating misinformation, let's remind the credential of these persons.
Jennie King is Head of Civic Action and Education, leading efforts to translate ISD’s digital research into frontline programming and response. She co-authored the current ‘Be Internet Citizens’ curriculum, formally accredited for UK schools, and provides regular briefings for UK government departments and regulators, UNESCO and parallel European/US bodies on systemic approaches to media literacy. Jennie also oversees ISD’s growing portfolio on Climate Mis- and Disinformation, supporting a coalition of 30+ organisations worldwide to identify, analyse and counter related harms. Her writing and commentary has been featured by the BBC, The Guardian, Channel 4 News, Tortoise Media and NPR, amongst others. Jennie previously served as MENA Regional Director Arts, Assistant Country Director Egypt and Country Director Hungary for the British Council, the UK’s international body for cultural relations . She read Arabic and Spanish at Pembroke College, Cambridge, receiving a Foundation Scholarship and the Marie Shamma’a Frost Prize for Oriental Studies.
Does not look like Jennie knows much about Earth sciences, atmospheric physics, climate science ore anything related. Perhaps she had somme support from her second co-author. Let's see.
Łukasz Janulewicz is an Analyst at ISD, focusing on climate disinformation in Poland and Germany. He previously worked at the Polish Institute for International Affairs (PISM) in Warsaw, the Central European University in Budapest and the Bavarian State Parliament in Munich. Łukasz graduated in Political Science from the Ludwig Maximilian University Munich and holds a PhD in International Relations from the University of Kent.
If there is some junk science around, without a doubt, it is IPCC's. Let's see. One wonders on which basis Łukasz will identify climate mis-information, perhaps the third authors has at least elementary knowledge about Earth-sciences? Let's see.
Francesca Arcostanzo holds a PhD in public opinion, political communication and electoral behaviour from the University of Milan, a MA in Government and Public communication, and a MSc in Intelligence & ICT. In her PhD dissertation, she developed and tested a method to investigate the modes and extent of EU politicisation in national election campaigns relying on social media data. Prior to joining ISD, she was a Digital Communications Specialist in the Web and Digital Division of the European Central Bank, monitoring and analysing conversations, disinformation and threats around the ECB and its policies.
Those are the people who tell us that science has been politicized and who are going to enforce the newspeak (Orwell, 1949). How could science be otherwise than politicized when one looks at their credential s and cursus, the only thing they have ever been involved in is politics!
Let's remind in a few sentences here how IPCC is the main culprit of the politicization of climate science. The leak of the Climatic Research Unit's (CRU) emails, i.e. “Climategate651” from the University of East Anglia (UEA) showed how disingenuous were the relationships of these supposedly prominent scholars to science and how far the collusion went to prevent anyone from airing contradictory views and evidences. For anyone who wishes to see how far these deleterious practices went, Costella (2010) is a must read that shows that no attempt by the universities concerned to self-whitewash their own staff of their misconducts will ever succeed in erasing their awful malpractices whatever wikipedia and others can write.
The stain on Science will remain, it's just indelible as Harold Lewis pointed it out in his resignation letter from the American Physical Society652 (APS) “It is of course, the global warming scam, with the (literally) trillions of dollars driving it, that has corrupted so many scientists, and has carried APS before it like a rogue wave. It is the greatest and most successful pseudoscientific fraud I have seen in my long life as a physicist Anyone who has the faintest doubt that 651https://www.conservapedia.com/index.php?title=Climategate
652Lewis (2010) “I think it is the money, exactly what Eisenhower warned about a half-century ago. There are indeed trillions of dollars involved, to say nothing of the fame and glory (and frequent trips to exotic islands) that go with being a member of the club. Your own Physics Department (of which you are chairman) would lose millions a year if the global warming bubble burst. When Penn State absolved Mike Mann of wrongdoing, and the University of East Anglia did the same for Phil Jones, they cannot have been unaware of the financial penalty for doing otherwise. As the old saying goes, you don’t have to be a weatherman to know which way the wind is blowing. Since I am no philosopher, I’m not going to explore at just which point enlightened self-interest crosses the line into corruption, but a careful reading of the ClimateGate releases makes it clear that this is not an academic question.”
this is so should force himself to read the ClimateGate documents, which lay it bare. (...) I don’t believe that any real physicist, nay scientist, can read that stuff without revulsion. I would almost make that revulsion a definition of the word scientist. (...) In the interim the ClimateGate scandal broke into the news, and the machinations of the principal alarmists were revealed to the world. It was a fraud on a scale I have never seen, and I lack the words to describe its enormity” (Lewis, 2010).
Then in the wake of such a baleful effort of the accomplices to clean the spill, appeared some blatant errors in the IPCC AR4 report (IPCC, 2007a), most notably a claim that Himalayan glaciers would disappear by 2035, an affirmation that turned out to completely lack any scientific basis, e.g. (Bagla, 2009), (Cogley, 2011) and led to a contorted apology of the Chair and Vice-Chairs of the IPCC, and the Co-Chairs of the IPCC Working Groups (IPCC, 2010). Even if the railroad engineer Pachaury, who only recruited scientists complacent with the CAGW thesis, endorsed willfully these delirious forecast, one could argue that one mistake can always happen. Wait, it is not just one mistake but a full stack of failed predictions that the IPCC must be accountable for. This is this pile of crap, of unbstantiated claims of dubious affirmations that has politicized science, not a small group of people of integrity who are horrified by these nauseating practices and who speak out against them.
Let's have a look at the latest SPM (IPCC, 2022a) and see how rigorous it is. To make a perfect start, it is claimed:
p. 29 “D.1.1 This Report reaffirms with high confidence the AR5 finding that there is a near-linear relationship between cumulative anthropogenic CO2 emissions and the global warming they cause. Each 1000 GtCO2 of cumulative CO2 emissions is assessed to likely cause a 0.27°C to 0.63°C increase in global surface temperature with a best estimate of 0.45°C”. That's a very impressive statement as one can hardly see how a physical phenomenon that has been known as having a logarithmic response to the increase of CO 2 concentrations since Arrhenius (1896, 1903) and accepted as such by IPCC themselves, see Myhre et al. (1998), would have suddenly become nearly-linear according to the very wording of the SPM (IPCC, 2022a). Unless the projected rise of anthropogenic emissions would follow an exponential growth over all Shared Socio-economic Pathways (SSP) scenarii, i.e. SSP1-1.9, SSP1-2.6, SSP2-4.5, SSP3-7.0, and SSP5-8.5, which is not the case, see Abram et al. (2019) Fig. SM1.1, there is no way to observe a “near-linear” curve. Furthermore, whatever the scenario considered, the response is always supposed to be the same, “near-linear” as stated by IPCC. Thus, that's simply an enormous blunder, a gaffe of epic proportion, that shows that no scientist, not one has really reviewed that material, otherwise the enormity of the statement would have immediately jumped to the reviewers' eyes. Equations 103 and 104, p. 110 correspond to Myhre et al. (1998) and a complete demonstration is provided that leads to Equations 129 p. 112 and 150 p. 115. If you have a logarithmic process and want to linearize it by wizardry, ask IPCC's SPM team, they will do that for you with a strike of a pen. This is utter non sense. They are just like their fellow climate software modelers, they live in a world of their own far from reality. Let's summarize: unless the future scenarii project an exponential increase of the anthropogenic emissions, which they do not, there is no way to get a “nearly-linear” graph. How many hundreds of scientists to produce that SPM?
But that's just the start of the unlikely physics of IPCC, version 2022, because the graph that accompanies this amazing D.1.1. statement, i.e. Fig. SPM.10 p. 28 (IPCC, 2022a) is also very well worth spending a couple of more seconds looking at. Beyond the sudden and magic linearization of a process that is known as logarithmic to all physicists and scientists, it strikes immediately that over an unspecified period along the X axis “Cumulative CO₂ emissions since 1850“ and just under the label “Historical global warming“ one can obviously see that more than 600 GtCO2 would have been added at some point (if anyone can tell me to what it corresponds I'll be grateful) with a negative effect on the temperature as it declined of nearly 0.4°C.
No scientist, not one, could have let such an odd observation go unnoticed and unexplained, but IPCC's SPM team prefer to paste their dubious projections at the end of their temperature series that have already been adjusted. Just going back to the figures that everybody has, one remembers that over the period 1940-1980, man-made emissions have increased by more than 300%, jumping from 4.85 GtCO2 (1940) to 19.80 GtCO2 (1980), and that the overall atmospheric content rose from 2,421 GtCO2 (1940) to 2,644 GtCO2, thus an increase of 223 GtCO2 (not 600 GtCO2 !) while the temperature decreased as shown Figures 28 and 29, p. 69. How can a causality be asserted when a massive increase of 223 GtCO2 over four decades induces a direct temperature decrease? (IR absorption properties of CO2 in the lab are well known, but this is not the subject, here is discussed the Earth's system at large and its complex response mechanisms).
Let's see how these [CO2] increase should affect the temperature according to IPCC's (2022a) own logic. Given A.1.1. and its very bold statement that no evidence supports, i.e. that Man is responsible of all observed [CO 2] increase since
1750 (e.g. ruling out the contribution of the warming oceans as per Henry's law), and accepting it for the sake of the exercise, we also learn that by IPCC's (2022a) admission, the Airborne Fraction is 44%. Thus, taking that figure, of the 37GtCO2 emitted in 2019, there would remain in the atmosphere only 16.28 GtCO2
“A.1.1 Observed increases in well-mixed greenhouse gas (GHG) concentrations since around 1750 are unequivocally caused by human activities (…) Land and ocean have taken up a near-constant proportion (globally about 56% per year) of CO2 emissions from human activities over the past six decades, with regional differences (high confidence)”.
So, using D.1.1. and A.1.1. one can immediately compute of how much the total 2019 man-made emissions have contributed to increase the Earth's temperature: (0.45 ± 0.18°C) x 16.28/1000 = 0.0073°C ± 0.003°C. Given that the threshold of measurability of a change of the Earth's temperature, with the best techniques available to us in 2022 is at best 0.07°C, one can see that the catastrophic change forecast is just ten times too small to be measured and detected by whatever available means! Thus, following IPCC's own line of reasoning and data, the maximum warming to be expected until 2050 is 0.205 ± 0.08°C, slightly above the sum given for all the countries in Figure 169 (far right column), of 0.15°C. It happens that, curiously, Figure SPM.10 shows twice as much, i.e. 1.25-0,84=0.4°C, then a set of fantasy scenarios are pasted at the end, i.e. (SSP1-1.9, SSP1-2.6, SSP2-4.5, SSP3-7.0, and SSP5-8.5).
• Let's now consider Fig. SPM.1 b p. 6 (IPCC, 2022a), one can see from a minimum around 1965 to a maximum in 2020 a reported temperature increase of 1.25°C (to which the massive natural 2018 El Niño made a great contribution). Over the same time period (1965-2020) the atmospheric [CO 2] increase has been of 730 GtCO2, i.e. (3,226.86 – 2,497.25)= 729.61≈730 GtCO2. Again, let's use IPCC's (2022) own figures and calculate how much warming one can expect from that: (730/1000) x (0.45 ± 0.18°C) = 0.33 °C ± 0.13°C. As the reported increase of temperature for the same period is of 1.25°C, this leaves 1.25-0.33=0.95°C unexplained (even using the high TCRE used by IPCC), or rather accounted for by the natural variability, thus 75% of the 1.25°C reported since 1965 are due to the natural variability and 25% are due, at maximum, to an anthropogenic contribution. In reality less, because all [CO2] increase has been attributed to an anthropogenic origin and a maximum TCRE used, as per IPCC. Based on an advanced energy-radiation-balance model Harde (2022) assess a maximum CO2 contribution at 1/3 of the observed warming. This conclusion is exactly the same that is reached using other means of evidence by Andy May (2015) after studying two 35 year periods of warming of a total record of 136 years, i.e. 1910 to 1945 and 1975 to 2009. Based on the differences observed between the reference period where man-made influence is considered inexistant (1910-1945) and the second period (1975-2009), May (2015) concludes “The increase in the rate of warming from the HadCRUT record is 35 years x 0.0048°C or 0.168°C [between the two periods] (…) The actual temperature increase from 1975 to 2009, from the best fit line to the HadCRUT record, is 0.672°C. So using our estimate of man’s contribution of 0.168°C, we can estimate that man’s contribution is 25%”. The A.1.1 statement is falsified.
• Thus, this falsifies the statement A.1.3. in the SPM: “A.1.3 The likely range of total human-caused global surface temperature increase from 1850–1900 to 2010–2019 is 0.8°C to 1.3°C, with a best estimate of 1.07°C. It is likely that well-mixed GHGs contributed a warming of 1.0°C to 2.0°C, other human drivers (principally aerosols) contributed a cooling of 0.0°C to 0.8°C, natural drivers changed global surface temperature by –0.1°C to +0.1°C, and internal variability changed it by –0.2°C to +0.2°C”. GHGs contributed up to 0.33 °C ± 0.13°C as per IPCC's own calculations, thus a mere 25% - at most – of the warming reported and internal variability accounted for 75% of the changes as seen just above. Furthermore, even with very high and unrealistic ECS such as those used by Delworth and Knutson (2020) of 3.4 K, the authors are embarassed as they have to acknowledge that “ If the climate sensitivity were smaller, then one would need either larger internal variability or additional radiative forcings to capture the early 20th century warming”. It seems like the high ECS was just chosen in order to minimize the natural variability and even with such a dubious choice, Delworth and Knutson (2020) must say “our results demonstrate that the combination of GHG forcing, sulfate aerosols, and internal variability could have produced the early 20th century warming, although to do so would take an unusually large realization of internal variability”. Thus internal variability cannot be as per A.1.3 in the IPCC (2022a) range [–0.2°C to +0.2°C] and thus the A.1.3 statement is falsified.
• Then, the statement A.1.5 is also at least partially falsified: “A.1.5 Human influence is very likely the main driver of the global retreat of glaciers since the 1990s and the decrease in Arctic sea ice area between 1979–1988 and 2010–2019 (decreases of about 40% in September and about 10% in March). There has been no significant trend in Antarctic sea ice area from 1979 to 2020 due to
regionally opposing trends and large internal variability”. Glacier have been melting long before the industrial age and e.g. Trutat stated in 1876 «Since I have been exploring the Pyrenees, I see the glaciers melt before my eyes and in the Lys valley and in the area of Oo, they are receding at a frightening speed » (Trutat, 1876) as reported by (René, 2011). Then one wonders why, if man-made emission are responsible of the decrease of the Arctic sea ice, the melting would have stopped over the 1989-2009 period during which emissions jumped from 22.43GtCO2 yr-1 to 31.77GtCO2 yr-1. Obviously as explained in the section “The Arctic”, p.261, other phenomenons are at work. Then claiming that there “There has been no significant trend in Antarctic sea ice area from 1979 to 2020” is simply falsified by all measures and observations, as visible Figure 109, p. 255, where Antarctica's monthly sea ice extent anomaly as per https://nsidc.org/data/seaice_index shows a +0.8 ± 1.1% increase per decade over the period (1979-2020). Parkinson (2019) states “Still, when considering the 40y record as a whole, the Antarctic sea ice continues to have a positive overall trend in yearly average ice extents, although at 11,300 ± 5,300 km2·y−1, this trend is only 50% of the trend for 1979–2014”. If the observed increases in well-mixed greenhouse gas (GHG) concentrations are responsible for melting the poles, both should react similarly, which is not the case, Antarctica's sea ice has vastly extended until 2014. The A.1.5 statement is at least partially falsified.
• Then, the statement A.1.6 is also falsified: “A.1.6 It is virtually certain that the global upper ocean (0–700 m) has warmed since the 1970s and extremely likely that human influence is the main driver. It is virtually certain that human-caused CO 2 emissions are the main driver of current global acidification of the surface open ocean”. With respect to the acidification of the oceans, there is an entire section that falsifies that claim, see “The Myth of the Acidification of the Oceans“, p. 275 and with respect to the warming of the upper ocean with IR radiation, whatever the source, it is a physical fantasy as the depth to which IR radiations penetrate the water and the oceans in particular is is micrometric, see discussion about the Ocean Heat Content (OHC), p. 239. The OHC has increased because the albedo has decreased (Goode et al., 2021). The A.1.6 statement is falsified.
• Then, the statement A.1.7 is also falsified: A.1.7 Global mean sea level increased by 0.20 [0.15 to 0.25] m between 1901 and 2018. The average rate of sea level rise was 1.3 [0.6 to 2.1] mm yr–1 between 1901 and 1971, increasing to 1.9 [0.8 to 2.9] mm yr–1 between 1971 and 2006, and further increasing to 3.7 [3.2 to 4.2] mm yr –1 between 2006 and 2018 (high confidence). Human influence was very likely the main driver of these increases since at least 1971. The first observation is that IPCC acknowledge a mere 20cm SLR over 117 years, thus a tiny 1.7 ± 0.4 mm per year. We are very far from the meters or sometimes even tens of meters of SLR that deceptive reports and media put forward. Then, using longest data serie available (207 years), from http://www.psmsl.org/data/obtaining/rlr.monthly.data/1.rlrdata, Figure 98, p. 231, shows an increase of +200mm in 207 years and +150mm over 1910-2015. The alleged acceleration is falsified, among others, by Jevrejeva et al. (2008), Figure 99, p. 232, displays the evolution of the rate of the trend (black line) since 1750, showing a very strong multi-decadal variability (basically the 60 years oceanic oscillation). The blue line is the sea level rise acceleration of the trend over 1730-2000 of 0.01 mm/yr2 and has remained constant since we have measurements. This shows the non-sense to spend 89,000 billions as per the World Bank to pretend to stop a 5 mm SLR since 2050, that can only be compared to a ripple on the sea. This statement A.17 is falsified.
• Then, the statement A.2.2 is also falsified:
“SPM A.2.2 Temperatures during the most recent decade (2011–2020) exceed those of the most recent multicentury warm period, around 6500 years ago [0.2°C to 1°C relative to 1850–1900] (medium confidence)”. This is falsified by all observations reported in section “Is the Modern Optimum Special?”, p. 522, but also by Figure 3, p. 14, where reconstructed temperature for the Holocene (11,700 years) are displayed left, with the HadCRUT4 dataset as an insert on the right and corresponding variations reported at scale onto the Holocene graph. The total T anomaly reported is 1.1°C in between 1840 and 2020 (whereas the regression just gives 0.91°C), after Brown (2018a-b) modified. The Holocene is reconstructed with incontrovertible data from (Alley, 2004; Vinther et al., 2009). This statement A.2.2 is falsified.
• Then, the statement A.2.3 is also falsified:
“SPM A 2.3 (…) Late summer Arctic sea ice area was smaller than at any time in at least the past 1000 years (medium confidence). The global nature of glacier retreat since the 1950s, with almost all of the world’s glaciers retreating synchronously, is unprecedented in at least the last 2000 years (medium confidence)”. Just
back for the period 1928-1938, Alekseev et al. (2015) reconstruct values of the Sea Ice Extent (SIE) than are comparable to current minima, as per their Fig. 3.b “reconstructed September SIE in the Arctic from 1900 to 2013 and (2) observed SIE for 1980–2013”. The warming in the Arctic during the early 20th century is described by Polyakov et al. (2003) and the Arctic warming began in 1915, with an increase of about 1.6 C between 1915 and 1940 and the Surface Mass Balance (SMB) of the Greenland ice sheet provides an additional line of evidence for the Arctic warming and in that respect, Fig. 5 of Fettweis et al. (2008) clearly shows that the SMB was lower in the 30's than now. Furthermore, Erik the Red (see note 143) who sailed to Greenland and started the Greenland Saga with 25 ships in 985CE, calling it the “Green” “Land”, were they could develop their agricultural practice for more than 4 centuries before that the climate reversed, would certainly not have sailed over there with more summer Arctic ice than now. As far as the glaciers are concerned and visible Figure 55, p. 144, the great Aletsch glacier (Switzerland) also strongly suggest cycles of around 1000 years; before our era, around the Iron/Roman Age Optimum (I/RAO) (aka the Roman Warm Period) between 250 BC and 400 AD the glacier was somehow shorter than today, and around 1350 BC – 1200 BC i.e. Late Bronze Age Optimum (BAO) the glacier was 1000m shorter than today as per Schafer (2018), graph after Holzhauser et al. (2005). The A.2.3 statement is falsified.
• Then, the statement A.3.1 is also falsified by recent observations: “A.3.1 It is virtually certain that hot extremes (including heatwaves) have become more frequent and more intense across most land regions since the 1950s, while cold extremes (including cold waves) have become less frequent and less severe, with high confidence that human-induced climate change is the main driver of these changes”. As recently as Jan 7, 2021 at 5:19 a.m the mercury dipped to minus 34.1 degrees Celsius at Clot del Tuc de la Llanca in Aragon in the Spanish Pyrenees, the lowest ever temperature recorded on the Iberian Peninsula. A recent heavy snowfall occurred in Beijing on Nov 7, 2021 with dreadful weather and there have been many record low temperature early January 2021 in China as well with other recent cold blasts, e.g. in 2008 and Hongyang (2021) reports about the January 2021 event “The cold blast will continue across China, as Beijing recorded -19.5 C on Thursday morning, the lowest temperature since 1966, meteorological authorities said”. But as the saying goes, lunatics try to take over the asylum, thus you always find an expert, here Bing Zhou, Chief Scientist of Science Communication653 at the China Meteorological Administration's National Climate Center, who explains us that “the cold snap and global warming, two seemingly opposing facts, are not contradictory because global warming does not appear evenly, and triggers more extreme heat and cold.” as per Chi (2021). One should also let Zhou know that he should tell IPCC that according to him there will be also more extreme cold and not as per IPCC's A. 3.1. less frequent and less severe cold extremes, because with his statement Zhou is also falsifying IPCC's A. 3.1. In fact, they say everything and their opposite. No doubt that global warming will even manage to produce global cooling when the climate will naturally reverse course, and a lot more than that as global warming is indeed a very powerful political tool. When it does not work too well, rename it climate change, climate disruption climate urgency, climate bla, bla and and the magic trick will be played. Back to the point A. 3.1, is there a need to remind the reader the dramatic cold spell that left dozens of people dead in Texas alone, mid-February, 2021 as displayed on Figure 142, p. 348? The A.3.1 statement is falsified.
• Then, the statement A.3.4 is also falsified by IPCC themselves!:
“A.3.4 It is likely that the global proportion of major (Category 3–5) tropical cyclone occurrence has increased over the last four decades, (...); these changes cannot be explained by internal variability alone (medium confidence). There is low confidence in long-term (multi-decadal to centennial) trends in the frequency of allcategory tropical cyclones”. One should note that IPCC falsifies this statement with “It is likely that the global frequency of tropical cyclones will either decrease or remain essentially unchanged. There is medium confidence that there will be a reduction in the number of extra-tropical cyclones averaged over each hemisphere” SREX, p.13, (IPCC, 2012). The A.3.4 statement is falsified.
• Then, more importanty the statement A.4.4 is also falsified:
“A.4.4 The equilibrium climate sensitivity is an important quantity used to estimate how the climate responds to radiative forcing. Based on multiple lines of evidence, the very likely range of equilibrium climate sensitivity
653http://bcc.ncc-cma.net/experts/item/46 and email:bingz@cma.gov.cn to get an explanation of how global warming will lead to cooling. If people freeze in Bejing it is because the Arctic is warming! “The Arctic is warming two to three times as fast as any other place on Earth, said Zhou, adding that the polar vortex – a rotating pool of cold, dense air – weakens as the temperature goes up, pushing the cold Arctic air southward”. So, according to that logic, the Chinese should pray for an ice-age that should trigger a welcome warming in Beijing. Doesn't that sound logic? Ask Zhou.
is between 2°C (high confidence) and 5°C (medium confidence). The AR6 assessed best estimate is 3°C with a likely range of 2.5°C to 4°C (high confidence), compared to 1.5°C to 4.5°C in AR5, which did not provide a best estimate”. After 43 years since the Charney et al. (1979) report, what an irony to see this essential concept remaining as uncertain as ever. The downward trend showed Figure 31, p. 88, is a real chill on the ECS, and has kept going on with recent publications, e.g. (Coe et al., 2021). It is well demonstrated by Fig 1.2 p. 52 of Gervais (2022) that no value higher than 1°C for the ECS is reasonable and higher than 1.5°C is irrealistic
As explained with Equation 102, p. 96, involving evapo-transpiration and convection leads to halve the result down to less than 0.5°C! But dismissing more than a hundred papers published in international journals showing low ECS, the IPCC has embarked on a solitary route based on CMIP6 models that show massive standard deviation across models as visible on Figure 136, p.337 and that deliver values that have been rejected by all. Such a SPM A.4.4 (IPCC, 2022a) is also contradicted by the classic, well tested and comprehensive “Radiative-Convective Models” presented p. 328 that for a doubling from 400 ppm to 800 ppm lead to a ΔT°C=1,03°C for a ΔF=+1,12%, and finally they are rejected by the opponents of the CAGW theory, e.g. (Scafetta, 2021c), those who are neutral observers (Pielke and Ritchie, 2021a-b) and more remarkably even by those who have supported the CAGW theory for decades (Hausfather et al., 2022). The A.4.4 statement is falsified.
Lindzen (2019) also precludes any sensitivity above 1.5°C “The situation on with respect to climate sensitivity is that we basically see no reason to expect high sensitivity. The original basis for considering that high sensitivity is possible (namely, the hypothetical water vapor feedback of Manabe and Wetherald, 1975) is clearly contradicted by the measurements of TOA radiative fluxes which show that the total long-wave feedback, including cirrus cloud variations, may even be negative. Analysis of the temperature data leads to the conclusion that if anthropogenic contribution are the cause of warming since the end of the Little Ice Age, and if aerosols are limited to a contribution of 1 Watt per square meter, then climate sensitivity in excess 1.5°C is precluded” .
Richard Feynman, began one of his Caltech lectures with the following statement: “The exception proves that the rule is wrong. If there is an exception to any rule, and if it can be proved by observation, that rule is wrong.”. How many falsifications does the IPCC need? Feynman taught us that one is more than enough.
In fact this SPM (IPCC, 2022a) does not come even close to a scientific document as I could go on and on like I have done above for nearly every statement it contains. It is a collection of imprecise and often unfounded assertions that sadly surfs on the confusion between weather and climate in a pernicious logic aiming at scaring the leaders and the public. How can that be? It is very simple and properly amazing that IPCC may come with a complaint relayed by their paid zealots that science has been politicized.
IPCC actually politicized science, they destroyed the most precious thing humanity had, i.e. a hard-won path to the truth with the scientific method and they have intentionally created this awful situation and now enforce it by all means as described by Happer and Lindzen (2022), based on the own description by IPCC of their processes, i.e. sections 4.4-4.6 of (IPCC, 2013b) and (IPCC, 2013c) “The IPCC is government controlled and only issues government dictated findings (…) Unknown to most, two IPCC rules require that IPCC governments control what it reports as “scientific” findings on CO2, fossil fuels and manmade global warming, not scientists. IPCC governments meet behind closed doors and control what is published in its Summaries for Policymakers (“SPMs”), which controls what is published in full reports”.
The politicization of science by IPCC relies on two rules:
• IPCC SPM rule n°.1: all summaries for policymakers (SPMs) are approved line by line by member governments as bluntly explained in (IPCC, 2013c) “Approval is the process used for IPCC Summaries for Policymakers (SPMs). Approval signifies that the material has been subject to detailed, line-by-line discussion, leading to agreement among the participating IPCC member countries, in consultation with the scientists responsible for drafting the report.” also see sections 4.4-4.6 of (IPCC, 2013b-c). Happer and Lindzen (2022) rightdully conclude “Since governments control the SPMs, the SPMs are merely government opinions. Therefore, they have no value as reliable scientific evidence.”
• IPCC Reports rule n°. 2: government SPMs override any inconsistent conclusions scientists write for IPCC Reports. This simply means that IPCC reports are re-written to match governents' opinions expressed in the
SPMs. As explained in (IPCC, 2013c) “’Acceptance is the process used for the full underlying report in a Working Group Assessment Report or a Special Report after its SPM has been approved.... Changes ...are limited to those necessary to ensure consistency with the Summary for Policymakers.”. Thus, this second IPCC rule requires that everything in an IPCC published report must be consistent with what the governments agree to in the SPMs. Any drafts that the complacent scientists who participate in this masquerade write are nevertheless rewritten as necessary to be consistent with the SPMs. The enforcement of rule n°. 2 to make pseudo-science comply with political objectives is poignantly demonstrated by the IPCC’s rewrite of the scientific conclusions reached by the scientists in their draft of Chapter 8 of the IPCC report Climate Change 1995, The Science of Climate Change (“1995 Science Report”). The entire dismal story of the Chapter 8 that shames science and infuriated Seitz (1996), is then addressed by Happer and Lindzen (2022).
So not only science is rotten to the core, politicized as Hell, but IPCC have the gall to complain about it. Scientists learn to doubt, know that nothing is never settled, but IPCC teaches them at least one certainty, that what these people do can't be right otherwise they would do it differently.
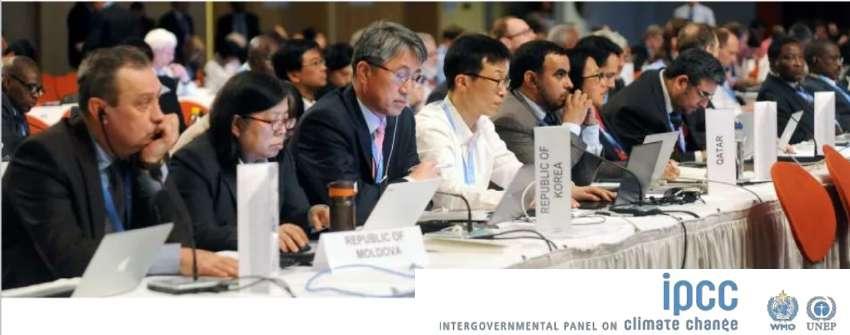
Figure 170.Science made by IPCC during a Summary for Policymakers (SPM) writing meeting (Lynn, 2016). In February 2022, the Intergovernmental Panel on Climate Change (IPCC) took an unprecedented step, citing mis- and disinformation and the “politicization of science” as key barriers to action. King et al (2022) report “For the first time, a document accepted by all Member Governments stated that rhetoric from “vested economic and political interests… undermines climate science”. Who politicized and trashed science? It is the pot calling the kettle black!
When extraordinary claims are made, such as the CAGW conjecture, a weak hypothesis that supposes that a 0.01% change in the global atmospheric composition due to an increase of a trace gas would derail the climate of the Earth, one must provide for extraordinary evidences. Not only they dramatically miss but nothing adds up and makes of the narrative a true political story or rather a matter of faith. A new religion has emerged, the climate cult, with its CAGW god, its devil the CO2 scapegoat, with its clergy enforcing the orthodoxy of the doctrine, the inquisition with their fact checkers that are only as good as their illusory faith but work round the clock to destroy the heretics, their cohorts of believers and a few crusaders.
Simply scary, isn't it? as it shows the madness of mankind, the madness of the crowds, the madness of the fanatics of the climate crusade.
As reminded to us by MacIntosh (2022) “Facts and realities are what typically bring societies back to some sense of rationality. Mao’s China never gave up on attempting centralized farming because debate and discussion resulted in their thinking to themselves, “My oh my, this doesn’t look good, perhaps we were wrong in our assumptions.” No, they starved tens of millions of people first and only when the evidence was absolutely overwhelming and the hysteria had burned itself out there was the ability to chart a different course”, the same happened with Lysenkoism (see note 627, p. 487) and the millions who starved to death in Ukraine and across all communist countries that had adopted that pseudo-science.
Politicians are regularly tempted to make the scientific truth a matter of a legal decision voted by whatever “representatives” and enforced by inner party members or vested interests, we've seen that with eugenics, with various agricultural reforms that abysmally failed and now the climate is supposed to obey the whimsical desires of our
political geniuses and aligned scientists who illustrate so well the saying of Upton Sinclair " It is difficult to get a man to understand something when his salary depends upon his not understanding it".
In an Op-Ed, Soon and Markó (2017) wrote in response to the president of MIT, Professor Rafael Reif's letter regarding the US withdrawal from Paris climate agreement “There is no science unambiguously establishing that CO2 is the chief cause of the warming observed since the end of the Little Ice Age. The opposite has been repeatedly demonstrated. (…) Professor Reif’s assertion that global temperatures can be regulated by an international agreement to atone for our sins of emission is, therefore, at odds with scientific knowledge regarding cause and effect. King Canute’s warning to his English courtiers in 1032 A.D. that even the divinely anointed monarch could not command sea level should be heeded by bombastic intergovernmental agencies a millennium later. The professor’s assertion is, moreover, logically invalid, since the Paris agreement permits China and India to industrialize without limit on their emissions”.
Soon and Markó (2017) also remind us that “Doubt is the seedcorn of science. Consensus is a political notion which, when pleaded, indicates that the pleader is totalitarian”. The green plague as the brown or any other plague and totalitarian attempt will end up unleashing massive opposite forces for the simple reason that they are contrary to logic, evidences, progress and well being of mankind. Facism, communism, totalitarianism whatever the color, be it red, brown or green always ends in the ditches of History for it is a disgrace to intelligence and common sense. It can take time, some survive longer than others, but fortunately all end the same way, in a catastrophic failure with massive human pain. The engineered ESG disasters start to pop up as in Sri Lanka (see p. 405) and give a hint to what is next.
As a matter of fact, the Anthropic theory in its catastrophic version (CAGW) is now entering a new phase and is aligned with all previous totalitarianism: dogma, indoctrination, and censorship with a good dose of propaganda.
The irony is that this anti-science posture, claiming things settled, refusing to debate, attacking people (arguing about their credentials) and organizations (scrutinizing their funding) and refusing to discuss their arguments or their absence of evidence, is proclaimed in the name of science!
What could go wrong?
“It is dangerous to be right in matters where established men are wrong.“ - Voltaire
Things seem to be speeding up: in May 2019 the UK Parliament has declared climate emergency, and in June 2019 NYC also declared a climate emergency. New York City Council passed a legislation, calling for an immediate response to the global climate crises; the bill referenced several reports on the state of global warming and its impact, imparting that extreme weather events brought about by rising temperatures demonstrate that the planet is "too hot to be a safe environment"! Data from Innovation for Cool Earth Forum (ICEF, 2020) show that more than 670 ruling bodies in 15 countries have declared climate emergencies654. Nobody can ignore the catastrophic narrative trend.
If there is any emergency, it is to debunk this crazy fantasy that climate would have reached a tipping point that would require to destroy our economies to avoid a catastrophe. Understanding how the climate has changed, from the distant glaciations a billion years ago to the most intriguing and mind-boggling «green Sahara» some 6.5k years ago, has always been one of the most challenging and intellectually rewarding endeavor of the geologists. Paleoclimate, coming along with paleogeography, distant plate-tectonics motions and associated orogeneses have always fascinated earthscientists and I remember as a student reading those reconstructions as fantastic stories that could only be matched by the space-time journey that astronomy offered.
I would never have imagined though, 40 years ago, that by means of a strange hysteria hyper-focusing on just one of the so many parameters driving the climate response (a harmless trace gas, i.e. CO2, the concentration of which has just increased since the beginning of the industrial revolution by hardly more than 100 ppm, i.e. 0.01% of the atmospheric total composition) and by resorting to mass conditioning of the population thanks to a host of activists relayed by onesided media, that we would have reached a tipping point; not the supposedly irreversible climate change but one that will inflict incommensurable damage to our economies, industries and standard of living. Our great leaders are going to ruin the prosperity of their own people for a second class theory, which is hardly more than one of the so many possibilities to be considered and that ranks low into the very long list of factors that can and have changed the climate. Furthermore, one should remember that the climate has always changed and quite a lot, on all timescales without any anthropic influence whatsoever. What a disaster looming! There is so much at stake with the planned punitive measures envisaged (i.e. taxes, regulations and more) to enforce a fantasy.
Up until 2007, some sort of opposition still could exist and make itself heard at the time the UN climate conference in Bali met strong opposition from a team of over 100 prominent international scientists, who warned the UN, that attempting to control the Earth's climate was ultimately futile. "Attempts to prevent global climate change from occurring are ultimately futile, and constitute a tragic misallocation of resources that would be better spent on humanity's real and pressing problems," the letter signed by the scientists read. U.N. Secretary General Ban Ki Moon did not answer nor met any of those scientists but argued «that global warming poses as great a threat to the world as modern warfare», and he vowed to make reduction of greenhouse gases655 (GHG) one of his tenure's top priorities. Ban's nickname was jusa ( 주사), meaning "the administrative clerk" and was probably well deserved as without any scientific training and no desire to listen to another perspective he took sides and he committed himself to making the IPCC’s agenda move on. These times when some opposition could be voiced are gone (Morano, 2010), unfortunately, and it has been harder and harder for people dissenting to exist as they have been discredited, threatened, fired or silenced. In any case, do not expect the UN to accept some future responsibility in disastrous climate change policies outcomes; e.g. when a lawsuit challenged UN legal immunity on behalf of Haitian cholera victims (UN peace keepers from Nepal are said to be the source of the 2010–13 Haiti cholera outbreak), Ban declared that the legal immunity of the United Nations before national courts should be upheld.
Does it make sense to write one more book on the subject in 2020? Probably not! Will it change anything? Most probably not! So what? In the end it will come down to individual responsibility, each scientist will have to chose side and I do not want to share the blame for the self-inflicted damage and impoverishment of the young and future generations by the insane policies that will be enforced. The doom-sayers, the alarmists have to know that beyond the short term glory and comfortable means that their crusade bring them, they might not be alive when they will have to face their horrendous legacy on a longer term, but that they will not be forgotten nor forgiven, except for those who
654This very classical logical fallacy is known as “Argument from adverse consequences” something must be done a certain way or before a certain date or else there will be adverse consequences (Sagan, 1995-1997).
655The term atmospheric greenhouse effect or “greenhouse gas” appears to have been first coined by Ekholm (1901)
have truly deceived and deluded themselves in trusting their computer models, believing that they had come close to some sort of reality even though they knew that they had had to «reduce» their input data so much in order to try to make their computerized fantasies somehow match in hindsight the observed reality as it keeps unfolding in ways that their dire predictions did not account for.
Albert Camus said in the Plague (1947, p. 151): «it is not a question of heroism in all this. It is about honesty. It's an idea that can make you laugh, but the only way to fight against the plague is honesty».
Each one of us who disagrees must voice his / her concerns and not be worried of the disparagements that will inevitably come along, not underestimating the violence of the priests of the new religion. Of course, what I’m going to write has no chance to be published going through a peer-reviewed process656 and will probably lead to ad-hominem attacks, but until the dreams of the crusaders come true, and they manage to censor the Internet of any dissenting opinion as «fake news», I will make use of the possibility to honestly develop and prop-up my thoughts and make them available to the widest audience possible. I do not claim to detain any certainty but when there remains so many doubts about what influences the climate, when knowledge is still so much in its infancy - and any scientist being honest should and could acknowledge that - it is a mere folly to enforce brutal choices by political means, that will hurt the most and mainly the poor who hardly make ends meet, by increasing the cost of energy.
Then early 2020, the world was struck by the COVID-19 virus whose origin remains uncertain and controversial (Relman, 2020; Rogin, 2021; Harrison and Sachs, 2022). But even before some clarification could be brought to that matter, if ever, world leaders and some influential billionaires had already announced what would be the next and even more expensive economic devastation, climate change policies and “decarbonation” of our economies. These perspectives are far worse than a transient virus misery, as lasting measures will be enforced and enacted based on the gloomy forecast of climate change software projections, that are impossible to check and that have compared very poorly so far with real instrumental satellite measurements performed with microwave sounding units 657. Catastrophic software scenarios predicting an uncontrollable climate greenhouse runaway that would lead to ecological disasters, ominous sea level rise and millions of refugees and deaths, all supposedly due to an increase over two centuries of 0.01% of the atmospheric share of a totally harmless trace gas, have served to predict all sorts of calamities and to scare to the bones the populations that are under the relentless indoctrination of the mass media. Worth noticing is that starting with the threat of a return to an ice age in the early 70s 658 that shifted to the global warming scare, such climate calamities have been foretold for 50 years now (Rasool and Schneider, 1971; Schneider, 1989) but have, by chance and for good reasons, never happened as reported by Ebell and Milloy (2019) and will most probably never happen.
In the midst of this COVID-19 man-made disaster I started, as a geophysicist, geochemist and computer scientist, to painfully resent the ludicrous harping of ecologists, alarmists, NGOs and supranational bodies of the UN all well funded with tax-payer monies, and even of talking heads from the showbiz publishing columns in mainstream media to be read by millions of gullible readers to make them feel guilty to just try to make a living for themselves and for their families and to the forthcoming requirement for them to resort to a more frugal way of living “to save the planet” when they themselves have probably not ever experienced what it means to make ends meets. As a geologist it was pretty clear that climate had always changed on all timescales and had not needed mankind to demonstrate its whimsical nature, as a computer scientist I had long known that sophisticated programs can more or less say whatever the software developers have designed them for (plus the garbage in garbage out syndrome with tuned or even forged data) and even in a sometimes poorly reproducible way according to the too often met CACE paradigm (Changing Anything Changes Everything) and finally as a geochemist I had been wary of the supposed evidence (chemical and physical) that were explaining everything based on overly simplistic assumptions (radiative absorption by one scapegoat gas) and
656In line with Michaels (2011), one must acknowledge that in “the intellectually inbred, filthy‐rich world of climate science, where billions of dollars of government research money support trillions of dollars of government policy”, peer review has become a joke. Alas, and beyond the climateindustrial complex, we have all heard of the “crisis of reproducibility,” but science is broken far beyond that. The peer-reviewing process has shown its limits and various papers address the issue and are enlightening in that respect (Ioannidis, 2005; Smith, 2006; Young et al., 2008; Michaels, 2011; Laframboise, 2016; Van Noorden, 2021).
657See https://www.drroyspencer.com/ updated monthly, e.g. May 2022 https://www.drroyspencer.com/2022/06/uah-global-temperatureupdate-for-may-2022-0-17-deg-c/
658Among many other references “The last major glacial period ended about 10.000 years ago. Some climatologists think that the present cooling trend may be the start of a slide into another period of major glaciation, popularly called an "ice age. " in Hugues (1974) p. 5, representing NOAA's position backed by Frederick B. Dent, Secretary of U.S. Department of Commerce of the time with Stanley B. Eames, NOAA Director, Public Affairs.
furthermore that were not to be discussed as the consensus would not give you a chance to make your job as a scientist, i.e. wonder and assess the soundness of the arguments.
President Obama’s advice to this year’s graduates «you can’t just accept what the experts and the people in charge tell you» was spot on and I could not accept to be a silent accomplice of the future destruction of western economies for a witch hunt without going in depth: 1) into the relevance of the brandished scientific « proofs » arising from so many disciplines as climate science is just an illusion but resorts to a bunch of well known disciplines as chemistry, physics, geology, astronomy, biology, to name a few, 2) the relevance of computer models mainly based on fluid mechanics equations which are unable to make a decent fifteen day forecast but will – based on the same physical principles and technology – tell you the average temperature a century away, and 3) the delirious policies that will be implemented to fight the enemy, nothing less than the gas of life, the gas which has enabled in the end all living species on this planet to exist. One should never forget that irreplaceable and widely available fossil energy sources together with nuclear energy have simply enabled mankind to move out of the cave and improve living conditions on earth as never imagined before!
It does not require a lot of fiction effort to imagine that epistemologists, around the end of the XXI century, will report that the «Climate Fiasco» was a large scale deception attempt initiated by a U.S. politician twice elected vice-president, who once took a class with an oceanographer and global warming theorist, and decided to embark on a crusade to save the world. Sticking to the wrong causation, namely that CO2 was responsible for the increase of temperatures, whereas it was the other way round and contrary to all evidence already available at the time, the growing flow of public funds into conforming universities and research laboratories, the threatening and dismissal of opponents, the hijacking of review committees of most prestigious journals, and the use of the powerful bureaucratic machine of the UN, all led to a massive disinformation of the public and a global scare of dissenting scientists. The stifling by all means of other opinions reminded of the worst years of Soviet science under the leadership of Lysenko and enabled the Climate tinkerers to declare victory through «consensus» and «science settled», not even realizing the inanity of their claims as they infringe the very basic historical foundations of science.
By the years 2010, their dire predictions of warming and related calamities not happening, they changed the creed from global warming to climate change. Of course, as every scientist knew that climate had always changed and on all timescales, that was a major discovery at little risk of being invalidated or challenged. This could enable them to hasten their agenda by promoting CO2 not only to the status of a pollutant (which will amaze scientists for the centuries to come) but to declare carbon (the basis of life) the enemy to defeat by all means, including enacting legislation around the 2020 that would promote a zero-carbon economy. These catastrophically ill-founded decisions led to a shift of wealth from Europe and the U.S. to Asian nations, that unwittingly benefited directly of the self-suicide of the West, though certainly not profiting of the global trade reductions that fighting the harmless CO 2 had led to. The Chinese, who had understood the sacred alliance formed by real science and capital as revealed to the world by Adam Smith (1776) observed incredulously the way the western public opinions had been manipulated and deceived and the way these societies were to return to relative poverty. Africa had become the main raw material provider of China and more globally Asia and had done well by changing its customers. On the other hand, and as prophesized by Markovsky (2016), “America and the West did not defeat communism, they adopted it”, while the former Asian “communist” countries, keeping their development strategies immune to the CO2 hysteria reached new standards of living that had only been known before by the West.
History will tell at the end of the XXI century, that even though at some point of the natural cycle that had started at the end of the Little Ice Age (LIA) temperatures had gone past the medieval optimum, it was already pretty clear that the climate was cooling and that a reversion to the means was to be considered, many being worried again of a return into an ice age. In the meantime, the AGW delirium had come to an end and became known as Al Goreism (like Lysenkoism) a joke with «Algorithms» reminding us that computer programs, based on dubious algorithms, had cost mainly western societies trillions of dollars, wasted in meaningless «research» which confusing cause and effect had misled mankind in extraordinary proportions and generated incredible punitive policies to achieve decarbonization, as if CO 2 were a demon. Unfortunately, real problems had returned and reminded us that one should never take a good life for granted and that it only results of hard work and proper investments, the sacred alliance of science and capitalism, be it for an individual or else at the level of societies. Among other new and real challenges had appeared a whole ensemble of bacteria resistant to any sort of anti-biotherapies, which had made even the simplest surgical operations nearly impossible and had reminded us of the harshness of the fate of Napoleonic era soldiers who could just see their legs and hands chopped away for minor wounds. Earth had taught us the hard way that it has a life of its own and that we had been foolish to believe that our «activities» could thwart in any way the course of such a grand design, the
Creation. Mankind was a derisory part of it, competing for a place to keep alive in the grand scheme of things, and the fable about a frog who wanted to become as big as an ox, had been sadly forgotten.
This document tells this bemusing story, of how as early as 2020, an attentive observer could have had all the cards to forecast, not the critical sea-rise levels, the death of the corals, the exponential rise of the temperature that will never happen, but the self-destruction of the western economies and major shift to a new world order dominated by Asian nations for the century to come.
Science has always been in a difficult position «Eritis sicut Deus, scientes bonum et malum» as the first biblical mention of science occurs in the story of Eve’s temptation by the Serpent and must help separate the Good from the Evil. Succeeding in this endeavor should not be taken for granted. Let’s make a try at it.
Moral of the story: given the large databases developed during the XX and XXI centuries nothing will be forgotten and only those who have been genuinely and honestly mistaken will be forgiven. The others should bear the brunt of infamy for the lasting millennia when mankind will have to fight with the return of the next ice-age.
The graph displayed in Figure 171, shows monthly mean carbon dioxide measured at Mauna Loa Observatory, Hawaii. As we've already seen, the carbon dioxide data on Mauna Loa constitute the longest record of direct measurements of CO2 in the atmosphere. They were started by C. David Keeling of the Scripps Institution of Oceanography in March of 1958 at a facility of the National Oceanic and Atmospheric Administration (Keeling et al., 1976). The last five complete years of the Mauna Loa CO2 record plus the current year are shown. The red lines and symbols represent the monthly mean values, centered on the middle of each month. The black lines and symbols represent the same, after correction for the average seasonal cycle. The vertical bars on the black lines of the first graph show the uncertainty of each monthly mean based on the observed variability of CO 2 in different weather systems as they go past the top of Mauna Loa. NOAA started its own CO2 measurements in May of 1974, and they have run in parallel with those made by Scripps since then (Thoning et al., 1989).
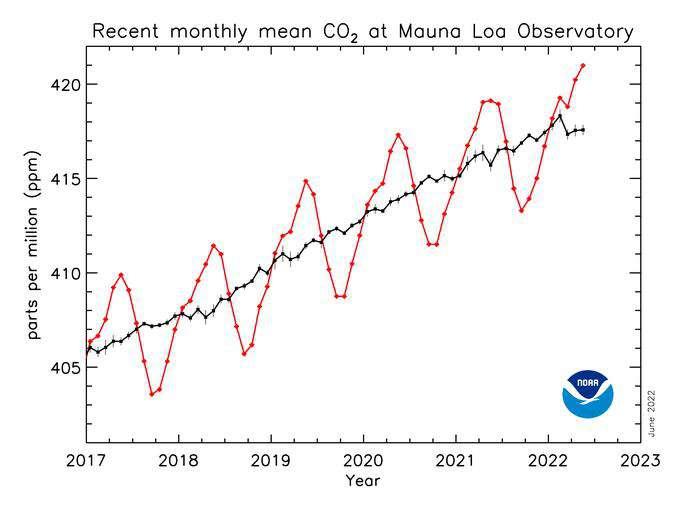
Figure 171.Detailed monthly mean carbon dioxide measured at Mauna Loa Observatory over 2017-2022, Hawaii, After https://gml.noaa.gov/ccgg/trends/
I have one question for my readers: the world economy was shut down for months at the onset of the stay at home orders during the first wave of Covid-19, around March 2020, can you see any difference on the curve?
Of course you cannot, for the simple reason that as explained by Smil (2022) mankind would need to do a lot more than completely stopping individual transportation to decrease measurably [CO 2] increase as measured at MLO, if only it could as a significant part of the emissions are of natural origin due to the outgassing of the warm oceans as explained in Figure 20 and 22, p. 59. There are fundamental realities that govern the prosperity that has dramatically increased
our well-being since 1900 and far more over a little more than a century than since Sapiens lived in his cave 300k years ago.
The four pillars of our modern civilization, that enabled the big leap forward are: cement, steel, plastics, and ammonia. They've only been made available to us because of industrial processes that depend on dense energies, mainly oil & gas and Uranium, the last being the densest form of energy that we can use so far (to produce electricity in a 24/24, 365/365 reliable and modulable way). All these are material, tangible assets that have changed our civilization and Smil (2022) casts snarky asides towards microprocessors, smartphones, AI, and anything else that isn't sort of fundamental material assets. We need these basic resources continuously, and in abundance, and the electronic goodies aren't going to save us from misery if the green policies of the lunatics are implemented. Just to coin how ammonia transformation and usage, that all the green foolish policies want to reduce by force potentially triggerring agricultural disasters as in the Netherlands and Sri Lanka, are vital one must understand that nearly 4 billion people would not be alive without them. Silicon wafers are important for the modern world but only as long as you can feed. CO 2 has also helped fertilizers increase agricultural productivity making the world a better place to live, we need more not less of it. Cement, steel and plastic are building blocks of our prosperity and the world now consumes more cement in one year than it did during the entire first half of the 20th century.
Dense energies, with high Energy Return on Investment (EROI) and especially with fossil fuels and uranium are the core of our prosperity and whimsical dreams for our conversion to renewable sources of energy are not grounded into reality and Smil (2022) states "Until all energies used to extract and process these materials come from renewable conversions, modern civilization will remain fundamentally dependent on the fossil fuels used in [their] production." It's the oil and natural gas that get us all this steel, cement, plastic, and ammonia. But renewable electricity is not going to be able to perform the herculean job that fossil fuels do today in terms of producing the material that makes our world go round. Electric cars are gadgets of the green fantasy world and they fit well into the deceptive and delusional orwellian newspeak of the net-zero bla, bla.
As stated in simple terms by MacIntosh (2022) “If future EROI will be lower than any preceding electricity EROI (and it will be due to more costly, less dense and less effective energy sources), then consequently we can expect lower productivity, higher costs, higher inflation, and lower living standards”.
After the Covid-19 lock-downs that inaugurated a new era of massive destruction of the most basic individual freedoms, will come the time of the climate lock-downs and carbon passes that will wreak your lives, the green fascism is kind enough, as often with these authoritarian delirious ideas to let you know before what you're in for (Le Quéré et al., 2021; Nerini et al., 2021). You'll have no excuse and will not be able to claim that you were not aware.
“It makes no sense to force people to live in darkness in the name of climate policy when the policy makers themselves have so little understanding of the planet’s mechanisms of warming and cooling. Acknowledge the infancy of climate science and liberate people from energy tyranny”. Vijay Jayaraj (2022).
"That is to me the central mystery of climate science. It is not a scientific mystery but a human mystery. How does it happen that a whole generation of scientific experts is blind to obvious facts?...Indur Goklany has assembled a massive collection of evidence to demonstrate two facts. First, the non-climatic effects of carbon dioxide are dominant over the climatic effects and are overwhelmingly beneficial. Second, the climatic effects observed in the real world are much less damaging than the effects predicted by the climate models, and have also been frequently beneficial. I am hoping that the scientists and politicians who have been blindly demonizing carbon dioxide for 37 years will one day open their eyes and look at the evidence" Freeman Dyson
There are only advantages to having more CO2 and a marginally warmer world will make it a better place to live for the vast majority:
1.Cooler and colder is always riskier as taught by the history of mankind. The great famines of 1315-22 (see note 198 p.144) (Baek et al., 2020) coincided with the end of the Medieval Warm Period and the Mount Tarawera eruption (Nairn et al., 2004; Hodgson and Nairn, 2005). Between 1310 and 1330, northern Europe saw some of the worst and most sustained periods of bad weather in the entire Middle Ages, characterized by severe winters and rainy and cold summers. This 1315-1322 period was marked by a dramatic death tool of up to 25% of the population in the cities and extreme levels of crime, disease, mass death, and even cannibalism and infanticide, followed by the famines of 1661-62 (known in France as the crisis of advent of the King Louis XIV) and also of 1692-93. All were due to the rain and the cold, with a little scalding (1693). At the time, after favorable harvests, the number of seeds one could eat per seed planted showed a ratio that could be as high as 7:1, but after unfavorable harvests it was as low as 2:1, that is, for every seed planted, two seeds were harvested, one for next year's seed, and one for food. By comparison, modern farming has ratios of 30:1 or more thanks to an extraordinary agricultural productivity due to fertilizers, mechanization, good weather and CO2 bonanza. More generally, civilizations have historically endured hardships when the weather got cooler or worse became cold enough to create upheavals
The fall of the Ming dynasty659 when the last Ming Chinese Emperor hanged himself in 1644 AD (23 January 1368 – 25 April 1644) is a telling example, when the regime collapsed at the beginning of the 1640s, masses of Chinese peasants who were starving, unable to pay their taxes, and no longer in fear of the frequently defeated Chinese army, began to form into huge bands of rebels. In this early half of the 17th century, famines became common in northern China because of unusual dry and cold weather that shortened the growing season; these were effects of the Little Ice Age. The famine and drought (but also occasional floods) in late 1620s and 1630s contributed to the rebellions that broke out in Shaanxi led by leaders such as Li Zicheng and Zhang Xianzhong. On 26 May 1644, Beijing fell to a rebel army led by Li Zicheng; during the turmoil, the Chongzhen Emperor hanged himself on a tree in the imperial garden right outside the Forbidden City.
In Europe, the 1783 A.D. through 1784 A.D., Grímsvötn (Laki or Lakagigar) effusive eruption (14.7 km 3 of basaltic lava) led to major disruptions, including famine and fluoride poisoning in several countries. In 1788 and 1789 there were poor harvests, this caused in France bread prices to rise in conjunction with falling wages, and hence led to further discontent and rural revolt. Even though the causes of the French revolution starting in 1789 and lasting 10 years are still debated among historians, the cold and unsettled weather for several years (Fuster, 1845) was the straw that broke the camel's back, as these events contributed significantly to an increase in poverty and famine. Noteworthy, in North America, the winter of 1784 was the longest and one of the coldest on record, a huge snowstorm hit the South; the Mississippi River froze at New Orleans and there were reports of ice floes in the Gulf of Mexico. There are other examples of a collapse of civilizations or of a meltdown of economies with massive societal disorders as colder is always risker for mankind. During the mid-seventies legitimate cooling scare, the CIA (1974) was perfectly aware of the risk and stated “ The potential implications of a changed climate for the food-population balance and for the world balance of
659https://en.wikipedia.org/wiki/History_of_the_Ming_dynasty
power thus could be enormous (...) In bad years, when the US could not meet the demand for food of most would-be importers, Washington would acquire virtual life and death power over the fate of multitudes of the needy. (...) More likely, perhaps, would be ill-conceived efforts to undertake drastic cures which might be worse than the disease; e.g., efforts to change the climate by trying to melt the arctic ice-cap ”. Demiurgic geoengineering ideas were already around the corner, though better justified;
2.Photosynthesis is stimulated by having more CO2 and plant productivity increases e.g. (Goklany, 2015; Schimel et al., 2015; Taub, 2010), both for the marine life as well as for all terrestrial ecosystems. Phytoplankton, sea algae and autotrophs are the substratum of all marine food web as zoo-planktons feeds with it and all the species further down the food chain depend on the primary productivity of the oceans and on the strength of the photosynthesis of the euphotic zone. Warmth and humidity of course favor the development of terrestrial ecosystems on land and there is no need of complex computer models to compare the exuberance and life of the tropical forest resting on warmth and rain and the dearth of the tundra or worse of polar regions where the cold annihilates most living species, where survive only a limited number of extremely well adapted forms of life. Naturally, “A warmer climate helps promote species diversity" says Munich zoologist Josef Reichholf;
A warmer environment favors crops productivity and extension to higher latitudes. Since the end of LIA, the conditions have considerably improved to cultivate far more agricultural surfaces than otherwise possible (Goklani, 2015), rather than returning to a new cool period. Even a slightly milder climate extends the growing season, enhancing the food security of the populations. A more friendly climate also strongly decreases the cost of heating the housing and greenhouses where crops have to be protected to reach maturity;
3.Many diseases that thrive during cold conditions, e.g. influenza and other respiratory afflictions, will be reduced by a warmer environment. This is worth noting as the positive aspects of a warmer climate on people's health are always underestimated (WHO, 2003). For example, Dr. Richard Tol, the director of the Centre for Marine and Atmospheric Science, and a prominent economist with Hamburg University in Germany, dismissed the UN IPCC touted Stern Report on the economics of climate change as "preposterous". Tol has also asserted that the benefits of a warmer world are frequently overlooked. Tol noted that "warming temperatures will mean that in 2050 there will be about 40,000 fewer deaths in Germany attributable to coldrelated illnesses like the flu” according to a May 7, 2007 article in Der Spiegel (Stampf, 2007). Beyond diseases, one must just understand that people die more of cold waves and cold climate than of warmer conditions or even hot-waves. Mortality data from several countries, regions and cities with cold, temperate, subtropical and even tropical climates show that average daily mortality is even or sensibly higher in cold months than in warm months (Guo et al., 2014) and Vardoulakis et al. (2014) state “In UK regions, cold-related mortality currently accounts for more than one order of magnitude more deaths than heat-related mortality. In Australian cities, approximately 33 and 2 deaths per 100,000 population are associated every year with cold and heat, respectively”. Goklani (2015) adds “The risk of death is higher in the winter not only in countries in cold climates, but also in Thailand and Brazil”. ;
4.By slightly warming the Arctic region (not the Antarctic as seen in section), the contrast between cold polar air masses and hot and humid tropical ones is reduced and the encounter of these conflicting air-masses generates less adverse conditions that lead to less extreme weather events (Leroux, 1993, 2005; Spencer, 2011) as shown by evidences and paleo-records, contrary to what has been wrongly postulated by CAGW theory advocates. Legates (2019) states “Warmer conditions, such as what we currently are experiencing, exhibit less climate variability than colder conditions. The Equator-to-Pole temperature gradient drives the poleward transport of energy in the climate system. Under a warmer world, the Tropics warm but the Poles warm even more. Consequently, the Equator-to-Pole temperature gradient lessens and the outbreak of much severe weather – driven by the interaction of cold polar air with warm tropical air – diminishes. Hurricane landfalls, for example, were much more frequent in South Carolina, New England, and China during colder periods”. Legates' statement is further supported by an extensive study by Liu et al. (2001) considering a 1,000-Year History of Typhoon Landfalls in Guangdong, Southern China, where they state “this article, we produce a 1,000-year time series of typhoon landfalls for the Guangdong Province in southern China, based on Chinese historical documentary records. Remarkably, the two periods of most frequent typhoon strikes in Guangdong (AD 1660–1680, 1850–1880) coincide with two of the coldest and driest periods in northern and central China during the Little Ice Age”. As rightfully pointed out by Leroux (1993, 2005), an increase of extreme events would result of a more severe and more regular confrontation of polar anticyclonic air masses arising from Mobile Polar Highs (MPHs) and colliding with warmer tropical or temperate air masses and would
be a sign of a global cooling, not the opposite, which would just resume the neo-glacial trend that started some 5,000 years ago as displayed on Figure 59, p. 151. Such excursions of deadly MPH have recently happened such as the one that froze Moscow in 2011 (KZ, 2011) with temperature as low as -30°C, homeless people dying and others more lucky having only hands and feet freezing. This episode followed the 2010 Russian heat wave which was rightfully attributed by Dole et al. (2011) to natural variability due to a long‐lived blocking event, an anticyclone characterized by high atmospheric pressures which refused to budge, forcing any cool air and rains to detour around it, acting as the equivalent of the winter MPHs but with an opposite effect. Leroux's disciples already see these events as the proof of the truthfulness of their Master's thesis and consider that they reflect a change in the global circulation, supposed to be speeding up, change that was according to them initiated in the 1970s. I agree with them that there is no connection with [CO2] changes, as these events have been observed many times in history. Interestingly, Nakamura et al. (2005) for the European heatwave of 2003 or Dole et al. (2011) for the Russian heatwave of 2010 concur that there was no means to forecast meaningfully these events just two week before they happened, even with super-computers permanently fed up with the latest data, on-site measurements, updated SSTs, aircraft real-time reports and more. How using similar software systems as those that are unable to predict 15 days ahead or even just a week ahead dramatic events like these heat-waves one could place any confidence into models supposed to tell us the what the temperature in 50 years will be? Let's be serious.
Schulze-Makuch et al. (2020) propose an interesting study where they recommend what has already been stressed here, i.e. that life generally speaking flourishes in warmer and wetter conditions (e.g. tropical forests) and struggles to survive in colder and dryer environments (e.g. Arctic, Antarctic, Siberia, etc.), which is really pushing open doors but given the hysteria about the minimal warming observed so far which would be more than welcome if it kept happening, is not a useless reminder. Schulze-Makuch et al. (2020) state “Life requires a certain range of temperatures, which is dependent on its biochemistry, and complex life on Earth has a narrower range than microbial life (Table 1). No empirical evidence is available, however, on what that optimum is, aside from the case of life as we know it on Earth. Based on our experience from Earth, the highest biomass and biodiversity is present in tropical rain-forests, and the least in cold polar regions (Brown, 2014; Kraft et al., 2011). Thus, higher temperatures than currently existing on Earth seem to be more favorable”.
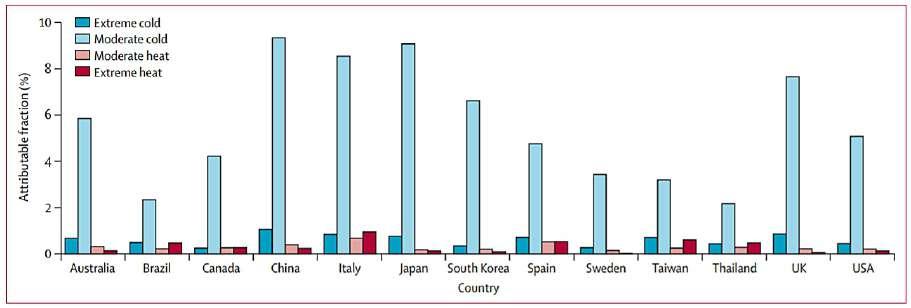
Figure 172. Fraction of all-cause mortality attributable to moderate and extreme hot and cold temperature by country. Extreme and moderate high and low temperatures were defined with the minimum mortality temperature and the 2.5th and 97.5th percentiles of temperature distribution as cutoffs. From Gasparrini et al. (2015).
As a picture is worth a thousand words, Figure 172 resulting from a study of more than 74 million cases by Gasparrini et al. (2015), show that cold, not heat, is by far the greater killer of humanity. As per that study, cool and cold weather kills about 20 times as many people as warm and hot weather. Excess Winter Deaths, defined as more deaths in the four winter months than equivalent non-winter months, total over two million souls per year, in both cold and warm climates. A more recent study of regional scope by Gasparrini et al. (2022), focusing on temperature-related mortality risks in England and Wales demonstrates that “there was on average 791 excess deaths (empirical 95% CI 611–957) attributable to heat and 60 573 (55 796–65 145) attributable to cold, corresponding to standardised excess mortality rates of 1·57 deaths (empirical 95% CI 1·21–1·90) per 100 000 person-years for heat and 122·34 deaths (112·90–131·52) per 100 000 person-years for cold.”, thus showing that cold kills 78 times more than heat (112.90/1.57) under this specific British climate.
But a well documented post by Richard (2022) on Gosselin's notrickzone.com, shows that several other new studies report heavily skewed ratios for cold- vs. heat-related excess deaths in the modern climate, including an excess mortality due to cold temperatures 32 times higher than for heat in Switzerland from 1969-2017 (Schrijver, 2022), an excess mortality due to cold temperatures 7.6 times higher than for heat in 326 Latin American cities from 2002 to 2015 (Kephart et al., 2022), an excess mortality due to cold temperatures 6.8 times higher than for heat in Pune city in India from 2004 to 2012 (Ingole et al., 2022), an excess mortality due to cold temperatures was 42 times higher than for heat in China in 2019 (Liu et al., 2022), an excess mortality due to cold temperatures was 46 times higher than for heat in Mexico from 1998-2017 (Cohen and Dechezleprêtre, 2022), and finally an excess mortality due to cold temperatures was 12.8 times higher than for heat across 612 cities within 39 countries over the period 1985–2019 as per Mistry et al. (2022) in a massive study that provides “the first comprehensive analysis over multiple regions to assess the suitability of the most recent generation of reanalysis datasets for health impact assessments and evaluate their comparative performance against traditional station-based data”. As Richard (2022) rightfully concludes “If there really is a concern for human health and extending life spans, there should be much more emphasis placed on reducing the costs of energy to heat homes, as well as minimizing exposure to cold temperatures. Instead, the invariable focus is on the dangers of “climate change” or heat waves that put humanity at a tiny fraction of the risk that cold temperatures do. Warmth saves lives. Cold kills. This has been true throughout human history, and it is no less true today”. If not enough one can add the studies from Burkart et al. (2021) “In 2019, the average cold-attributable mortality exceeded heat-attributable mortality in all countries for which data were available.” and Zhao et al. (2021) “Globally, 5083173 deaths (95% empirical CI [eCI] 4 087967–5 965520) were associated with non-optimal temperatures per year, accounting for 9·43% (95% eCI 7·58–11·07) of all deaths (8·52% [6·19–10·47] were cold related and 0·91% [0·56–1·36] were heat-related)”.
Ironically, Arrhenius who is somehow at the origin of the current climate hysteria, rejoiced by then of the possible perspective of a milder climate and stated “we may hope to enjoy ages with more equable and better climates" potentially making poor harvests and famine a thing of the past. Arrhenius was merely expressing a view that was firmly entrenched in the collective consciousness of the time: warm times are good times; cold times are bad. How could so many people forget this evidence? Especially among the most well educated part of the populations, e.g. researchers and climate scientists? Never forget that the consequences of the colder temperatures that plunged civilization into the so-called Little Ice Age for several centuries after 1300 were devastating. Summers were rainy, winters cold, and in many places temperatures were too low for grain crops to mature. Famines and epidemics raged, and average life expectancy dropped by 10 years. In Europe, tens of thousands of villages were abandoned and entire stretches of land depopulated. Is that what you would prefer?
When common sense is so much defeated, one must admit that their climate-science does not smell science at all but stinks politics all over the place. Science has been tragically corrupted and sacrificed on the altar of a new world agenda made of social control of populations and world government projects in the hands of international bureaucrats, resorting to fears, be it COVID-19 or CO2, in order to frighten people and make them willingly submit to the agenda of the dominants. The next Mencken's quotes looks tragically actual because even though it comes now already from some bygone past, it is yet still so relevant so many years later. His past insights to those whose lives are addicted to the seeking of power, or control, or fame, or money is still as valid today, as it was 70 years ago. The threat to the world is not man-made global warming or climate change. The threat to the world, as is always the case, is a current group(s) of humans who want to impose their values and visions on others.
"The whole aim of practical politics is to keep the populace alarmed — and hence clamorous to be led to safety — by menacing it with an endless series of hobgoblins, all of them imaginary." And, "The urge to save humanity is almost always only a false face for the urge to rule it." H. L. Mencken660
Furthermore, it has become increasingly clear that high solar activity protects us from deadly viral mutations that appear related to an increase of Galactic Cosmic Rays (GCRs) and lead to further widespread pandemics. A recent paper from Kamath and Kamath (2020) states “Almost all the previous pandemics occurred during solar minimum years when the Sun spots were lowest or absent and when the solar activity was at the lowest. This study suggests that the present Covid 19 pandemic is triggered by the mutated viromes in bats from latitudes above 30 degrees N. The increase in cosmic ray flux during the solar minimum of solar cycle 24 has contributed to this”. This conjecture is also supported by Wickramasinghe (2020) who sees a direct relationship between the cosmic ray spike measured in late November 2019 and the on-spread of the recent pandemics.
660https://en.wikipedia.org/wiki/H._L._Mencken – This quote is not an endorsement of Mencken ideas, more generally speaking.
Measurements of GCRs intensity and their modeled distribution (at various altitudes and latitudes) are performed by Matthiä et al. (2013) who show how geomagnetic shielding (strongly related to the solar wind) and primary particle intensity mainly influence the potential disruptions caused by GCRs on Earth. In that respect, one can conclude that GCRs have a double whammy effect, first acting on the global cloudiness and albedo changes and leading to cooling and unsettled weather during low solar activity cycles and second by triggering the onset of miserable sanitary conditions that plague mankind, which is just what can be observed over the last 2,000 years, when these circumstances were met. Over more recent timescales, Cliver et al. (1998) observe “During the past ~120 years, Earth’s surface temperature is correlated with both decadal averages and solar cycle minimum values of the geomagnetic aa index. Extrapolating the aa‐temperature correlations to Maunder Minimum geomagnetic conditions implies that solar forcing can account for 50% or more of the estimated 0.7–1.5°C increase in global surface temperature since the second half of the 17th
century”.
Beyond this short-term effect and immediate consequences of the solar activity on our well being on Earth, this brief reminder of the role of the GCRs leads us not to forget our place in the Galaxy (Shaviv, 2003; Redd, 2016; Xu et al., 2016) as we are indeed traveling on this Earth spatial vessel and following our Sun located in the Orion-Cygnus Arm, between the Sagittarius and Perseus arms, orbiting the central part of the barred Milky Way Galaxy (which resemble UGC 12158) at a distance (orbiting at a radius) of roughly 25-26k light years for a diameter of our own orbit of roughly 15-16 kpc. This is our true fate, mankind keeps thinking that it can act on and control everything, climate included, when we are just passengers of a spatial body that can hardly care less of our future and undergoes its own life
Finally, this warmer world might remain wishful thinking if Ollila's (2017a) analysis and model happen to be straight on, and it could well be. Ollila combines the natural variability of the climate reconstructed since the Little Ice Age with an anthropogenic contribution that he adjusts for a climatic sensitivity of 0.6° (thus still reasonably high). He takes the Sun into account in an estimate of natural variability according to 4 scenarios, and includes astronomical resonances (in particular the 60-year cycle) and accounts for past climate to within 0.09°C, which is much better than the complex IPCC CMIPx models. By taking into account the continuation of an increase of 3 ppm per year (i.e. more than 50% of the average 2 ppm observed), he concludes, in all scenarios, to a decrease in temperature from 2020 onwards. Projections between now and 2100 give the same temperature as in 2020 if the TSI does not change, but it would be 0.1 to 0.3°C lower if the TSI were to fall, which would logically be expected from solar activity cycle studies (Shepherd et al., 2014; Zharkova et al., 2015, 2019; Zharkova, 2020).
This is a question that comes often, as people are getting worried at large and tend to think that current climate changes observed are exceptional. This will be addressed over two separate comparision time-scales.
The Atlantic optimum that dates back to the 4th millennium B.C., happened just before the neo-glacial started (figure 59), and is known from forests reconstructions and palynological studies (Kalis et al., 2003; Marquer et al., 2014, 2017; Roberts et al., 2018; Zanon et al., 2018) and shows that a mixed forest of oak, hazelnut, alder and linden trees covered the whole of northwestern Europe at that time. The average temperature was then higher than today's, because the plant associations characteristic of this period never reappeared. Comparing, over the entire Holocene, forests extension and the observed associations of vegetation gives a reasonable clue to whether the Holocene Climatic Optimum (HCO) was higher than now and by how much. With respect to vegetation and forest extension, Marquer et al. (2017) state that "The overall results indicate that climate is the major driver of vegetation when the Holocene is considered as a whole and at the sub-continental scale, although land use is important regionally". Then Kalis et al. (2003) Fig. 12 p. 14-15, can be used to see how the forests extension has kept decreasing since the HCO.
Finally, while exchanging with Michael Calvin MacCracken661, he asked me the following question “While criticisms are always useful to consider, does your book offer an alternative hypothesis for why such strong warming is presently occurring?”. My answer to him was the following: your reasoning starts from a supposedly observed " strong warming". Is it indeed? Is the current Modern Optimum (MO) very different from the Medieval Warm Period (MWP), the Roman Warm Period (RWP), or the Minoan (MiWP)? Do we have reasonable tools to answer that question as we are going to compare short measured time-series (maximum since 1724) to much longer reconstructed temperatures. What I'd like to stress here, is that there is only one certitude, the MO is still very far from the Holocene Climatic Optimum (HCO) that happened naturally in between [-9000/-6000 BP].
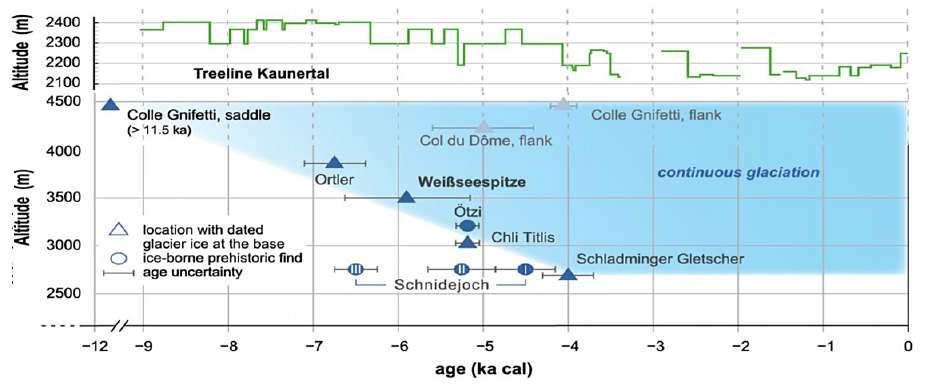
Figure 173.Sequence of dated past neoglaciation events at high-elevation locations in the Alps. Note the general correspondence between glacier maximum age and its altitude. The blue shaded area indicates the period of continuous ice cover. Also shown are the tree line reconstruction from Kaunertal (Nicolussi et al., 2005). After Bohleber et al. (2020).
There are several strong evidences and let's consider here only three of them:
1.the extension of the forests, well studied in Europe over the entire Holocene (Kalis et al., 2003; Marquer et al., 2017) and the associations of vegetation (mixed forest of oak, hazelnut, alder and linden trees covered the whole of northwestern Europe at that time) sensitive to the cold that could never re-establish themselves, because the MO remains way colder than the HCO, (Heiri et al., 2015; Roberts et al., 2018; Zanon et al., 2018);
661https://www.researchgate.net/profile/Michael_MacCracken https://en.wikipedia.org/wiki/Michael_MacCracken personal email exchange over “RG” on December 29th, 2020.
2. study by Bohleber et al. (2020) who investigate the neoglaciation history of high-elevation glaciers throughout the Alps showing a clear gradient in the onset of neoglaciation progressing from the higher summits of the Alps (> 4,500 m) that were ice-free before -9000 BP, down to 3,400 m around -6000 BP and finally since around -4000 m have gone down to a level of 2,700 m being characteristic of the neo-glacial regime. Within this neo-glacial that we're still in, two counter-trend warming are very visible and evidenced by changes in the altitude of the tree-lines (Nicolussi et al., 2005) see Figure 173, namely the RWP and the MiWP, the MWP is not very distinctive whereas the MO is starting to show off;
3.the global atmospheric and oceanic circulation that remains characteristic of the neo-glacial, i.e. the ITCZ is strongly shifted South and prevents the African monsoons to move North as they did when the Sahara was green 6000 years ago, see Figure 58.
It is remarkable that Bohleber et al. (2020) state “Our dating of the ice just above bedrock indicates that the ice body at WSS662 formed earlier than (5.9±0.7) ka cal and has been glaciated continuously ever since. This implies that even the WSS summit location at 3500 m altitude was ice-free during an interval prior to (5.9±0.7) ka. (...). Likewise, at around 5.3–5.1 ka cal, no ice existed at nearby Tisenjoch, at 3210 m. The end of the so-called “Holocene Climatic Optimum” is also observed in Austrian stalagmite records, indicating the onset of a cooling period around 5.9 ka. During those warm periods, the tree line was up to 165 m above the 1980 tree line in Kaunertal , (…) summits around 3000–4000 m were likely ice-free during the Mid-Holocene or covered by glaciers distinctly smaller than today”.
Another confirmation is given by the work of Rosenthal et al. (2013), who used, among others, Mg/Ca measurements in the benthic foraminifer Hyalinea balthica for reconstructing Intermediate Water Temperatures (IWTs) in various places. From thereof, these authors state “Our reconstructions show that IWTs at all depths were substantially warmer in the early and middle Holocene than during the late Holocene (Fig. 1). Specifically, IWT at 500 m was ~10°C between 10.5 and 9 thousand years ago (ka), increased to a maximum of ~10.7°C between 8 to 6 ka, and began decreasing after 6 ka, reaching ~7.8°C at the core top (~100 years B.P.)”. Not only do they confirm that the HCO was much higher than current MO using different proxies, strengthening all evidences available, but they also assert that the MWP was also warmer than now, latter observation that is also asserted by a completely different technique by Huang et al. (2008), using borehole temperature flux calculations.
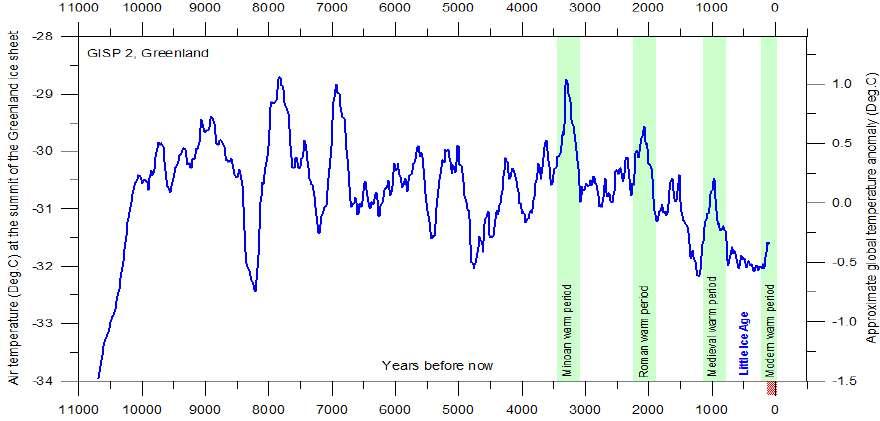
Figure 174.One reconstruction of the air temperature of the Northern Hemisphere, i.e. at the summit of the Greenland ice sheet, derived from Greenland ice cores, GISP-2. It provides a brief context to show the wider natural range of temperature over the last 11,000 years, some variations exceeding ±3°C over a century or so (e.g. 8.2 kyr event). Also notice that at the beginning of the Holocene, the Central Greenland ice core record shows 10°C (18°F) of warming in 144 years, from 11,755 BP to 11,611 BP (May, 2020a). The drop at 5480 BP corresponds to an extreme solar minima (Miyake et al., 2017, 2021) and a global climate change regime known as the 5.2 kyr event (Thompson et al., 2006). From climate4you.com 663 but also matches perfectly Fig. 5, p. 1219 given by Akasofu (2010) and Ball (2016b). Data from ftp://ftp.ncdc.noaa.gov/pub/data/paleo/icecore/greenland/summit/gisp2/isotopes/ 662WSS stand for the Weißseespitze summit glacier 663http://www.climate4you.com/images/GISP2 TemperatureSince10700 BP with CO2 from EPICA DomeC.gif
Thus my take on Michael Calvin MacCracken's premise "such strong warming" is that the MO is still way colder than the HCO was and that I would not rate it unusual when compared to the MWP, the RWP or the MiWP each probably a little warmer than the previous one as in a “bear market trend664” (see Figure 174). Figure 174, deserves some comments to be understood correctly and to make accurate inferences. The GISP2 “present” follows a common paleoclimate convention and is actually 1950. Thus, the first data point in the file665 is at 95 years BP.
This would make 95 years BP: year 1855 — a full 156 years ago. From thereof and using Alley (2000a) data, the current modern warming is not entirely visible on this chart (just the beginning of it). But, this will change nothing to the fact that temperature would need to rise more than 3°C from the depth of the LIA to reach the Minoan optimum. Considering what we know of measurements and proxies since the end of LIA, this is far from being the case (rather a maximum of 1,5°C). This is for example well visible on Fig. 10 (1.5°C as per the “Gaussian filtering of Greenland ice sheet annual 2-m temperature anomalies relative to the 1951–80 base period”) and Fig. 11 (+1°C as per the moving average) of Box et al. (2009). This confirms that Modern Warming (MW) so far, is just on par with the Medieval Warming, at best.
As far as the RWP is concerned, one remembers that Hannibal crossed the Alps in 218 BC by the "Col de la Traversette" (2,947 meters) the highest of the Alps with his elephants at the end of October (see p. 242) and that in no way, he would succeed doing that now, and certainly not in 2000 with meters of snow there since early October. Still with respect to the RWP, as we reported, p. 144, Theophrastus (371 B.C.-287 B.C.) wrote that date palms could grow in Greece if they were planted, but that they could not bear fruit. This is the case today, suggesting that average summer temperatures in the southern Aegean in the 4th and 5th centuries BC were at least at a comparable level to those of today (see page 144) but it was warmer in England during the RWP as figs were grown around Colchester in Essex and during the Medieval Warm, Grapes were grown openly in Yorkshire in the North of England and interestingly, neither of those are possible for open air cultivation today. The illusion or the deception that current Modern Warming (MW) would be extraordinary both in magnitude and / or in its rate of change is unsupported by any evidence.
So having compelling evidences that the MO is not exceptional, what is the cause of it? First, one must observe that it started long before man-made emissions became significant and the reader remembers that Trutat (1876) stated long ago (see p. 26) «Since I have been exploring the Pyrenees, I see the glaciers melt before my eyes and in the Lys valley and in the area of Oo, they are receding at a frightening speed» and this was noticed in many places and is not a regional observation (Nussbaumer et al., 2011; Fig. 4 and 5). Then one must dismiss the fact that the warming which started for natural reasons, say 1800-1850, accelerated recently simply because SLR measured have not accelerated or marginally (see Figures 99 and 100).
Establishing that carbon dioxide does not regulate the temperature nor the climate on Earth is not enough, the second part of the question raised by MacCracken is “does your book offer an alternative hypothesis” as most of the time, even though all evidences point to the fact that CAGW fails, CAGW folks will return to it by saying “we do not have a better alternative, thus what else?” this is what MacCracken does by adding “Going back tens of millions of years and more, there is really no way to explain the large changes in climate that have occurred without changes in atmospheric composition playing a significant role. And so now humans are changing atmospheric composition by a significant amount”.
This statement does not stand examination as one should remind that if we just go back 20-25 millions years ago (see p. 173), the distribution of plates and mountain belts is already so different that the global atmospheric and oceanic circulation must have been entirely incomparable to the one presently observed. From the western Alps to the distant Himalayan, there were subduction zones, epi-continental seas with a very large tethys and para-tethys, molassic basins, etc., instead of the current mountain belts. This appears as a much more potent climate-change driver (e.g. acting on monsoons and the entire circulation) than any CO2 or other atmospheric change. I am always amazed when I read papers where the authors address very distant geological configurations and try to make CO 2 changes the scapegoat for worlds apart that share next to nothing together, e.g. Klages et al. (2020). Furthermore and never addressed, instead of focusing on minuscule supposed changes of the atmospheric composition and of CO 2 variations in particular, nobody considers the possibility of changes over such long timescales of the atmospheric pressure (thus changes of the mass of the atmosphere itself), as there is no reason that it would have remained stable for ever at 1 bar!
664A “bear market trend” is a trend that goes globally lower with counter-trend motions, but where each peak is lower that the previous one and where each valley is lower than the previous one. This is what is displayed by Figure 174, since the Minoan optimum. 665ftp://ftp.ncdc.noaa.gov/pub/data/paleo/icecore/greenland/summit/gisp2/isotopes/gisp2_temp_accum_alley2000.txt as per Alley (2000a)
So unless one is able to come up with an heliocentric system, even though the geocentric does not fit the bill, it will not be enough to deter the CAGW proponents from supporting it, and they will always be reverting to it.
Then what is the "alternative hypothesis", the new heliocentric model? First, one needs to put things in a broader perspective, since the HCO, Earth's climate has been in a downtrend (for 6,000 years) mainly because of the combination of various orbital parameters, i.e. a decrease of the tilt (41kyr cycle between 22.1° and 24.3°) but also the joint action of precesion and eccentricity are reducing NH summer insolation and the 500-600 years fluctuations that have been reminded, i.e. RWP, MWP, and the MiWP, (the MO being just one of them) are super-imposed on the longer term global cooling trend. The MO may have been very marginally increased by man-made emissions, but the atmospheric sensitivity to CO2, albeit probably not null, is way smaller than asserted by IPCC. The anthropogenic contribution, if any, may in fact come much more from large scale irrigation and thus from a small observed increase of the RH of the lower troposphere (Pangburn, 2018) p. 370, water vapor being a much more potent GHG than CO2. In the end, there is no need to be looking for an extraordinary "alternative hypothesis" for this MO more than for the three preceding cycles that have already been mentioned (RWP, MWP, and the MiWP).
So many factors play a role and the Sun is the elephant in the room that IPCC refuses to see. We are probably gravely mistaken to consider it as such a stable star, the solar constant might only have its name constant, furthermore supposedly acting for the IPCC only through its TSI changes, when albedo changes are related to the solar wind, the global electro-magnetic activity of the Sun (not just TSI) and its influence on the Earth's geomagnetic field and GCRs action on the nucleation processes as convincingly evidenced by so many authors. These changes, coupled a) with variable volcanic activity throughout the ages both in terms of intensity, frequency and clustering of the manifestations, and b) with the reaction of the biosphere itself (see page 214) (Després et al., 2012; Bianchi et al., 2016), lead to more than enough triggers to modulate the low-pass filter oceanic calorimeter that stores long term heat and appears as one of the main drivers of the climate.
For the sake of clarity, let's separate between two periods: the neoglacial that started after the HCO some 8000 years ago and before, going back in time to at least the previous inter-glacial, the Eemian.
Current climate change since the HCO up to the Modern Optimum can easily be attributed to:
• The action on the solar tachocline (see note 277, p. 206) of a combination of planetary resonances, some being regular (Semi, 2009; Abreu et al., 2012; Scafetta, 2014; Malhotra, 2021), others appearing chaotic as per the combination of regular modes convoluted by a complex non-linear system (Braun et al., 2005; Raspopov et al., 2008, Stefani et al., 2020; Viaggi, 2021), lead to significant solar variability, as recorded per 14C and 10Be cosmogenic isotopes, that invalidates the myopic apparent stability of the TSI measured over very short periods, i.e. typically some decades. In that respect, “Bond events” over the Holocene appear of a comparable nature to “Dansgaard–Oeschger events” that kept happening all along the last glacial period as recorded in Greenland ice core (which only go back to the end of the last interglacial, the Eemian interglacial) and can be attributed to such planetary tidal resonances. In that respect, Stefani et al. (2020) not only attribute solar cycles to tidal planetary forces “Hale and Suess–de Vries cycles are clocked by planetary motion” that result from “combined synchronization with the 11.07-year periodic tidal forcing of the Venus–Earth–Jupiter system and the (mainly) 19.86-year periodic motion of the Sun around the barycenter of the solar system”, but even more importantly explain these Bond and D-O events with such mechanisms;
• Various geophysical mechanisms involving the troposphere, the stratosphere and the ionosphere resulting from the interaction of the geomagnetic field and the solar flux (considered at large, i.e. solar wind, solar storms, GCRs, etc.) that lead to albedo changes through cloud cover changes, most importantly in the tropics (Goode, et al., 2021). One should never forget that a change of albedo of a tiny 3% (say from 31% down to 30%) is equivalent to the warming anticipated by a doubling of [CO 2]. Multiple studies suggest potential links between GCRs and the climate through the intermediary of the Global Electric Circuit 666 (GEC), and beyond Svensmark and colleagues already cited many times, let's add (Tinsley and Heelis, 1993; Tinsley et al., 2007; Tinsley, 2012; Lam and Tinsley, 2016; Zhou et al., 2016; Zhang et al., 2020). Others have also provided independent analysis that is somewhat consistent with such mechanisms (Carslaw et al., 2002; Shaviv, 2005; Harrison and Stephenson, 2006; Voiculescu et al., 2013; Itoh et al., 2018);
666 The Global Electric Circuit refers to the Earth interaction (through magnetosphere and ionized layers of the atmosphere) with the Solar wind.
• A recent and anthropogenic increase of Water Vapor (WV) that is more than one can expect from the current warming, WV a 20X more potent GHG than CO2 (Pangburn, 2018).
The convolution of these phenomenons (plus others) creates a complex signal response within a non-linear coupled system (ocean-atmosphere-biosphere) that introduces all sorts of lags due to heat storage (in particular in the oceans) and circulation issues (oscillations). The interaction with the biosphere is highly underestimated and very complex and there are many feedbacks. This is what has driven the climate since the HCO and created the various optima that we have knowledge of going backwards, i.e. Medieval Warm Period (MWP), the Roman Warm Period (RWP), or the Minoan (MiWP). This is of course a little more complex than the CO 2 scapegoat control knob and provides no political leverage over the gullible masses, but is far more consistent with the reality of a remarkably complex planet interacting with its solar and planetary environment.
Observed climate changes over the last 8500 years BP have been impressive and their consequences on mankind very significant, either opening possibilities when the climate got warmer or creating its batch of catastrophes when it got cooler, let's rewind the story:
• The LIA (1650-1850) corresponding to the solar Spörer667 Minimum (1450-1550), Maunder Minimum (16451715) and Dalton Minimum (1790-1820) see e.g. (Eddy, 1976, 1977; Brehm et al., 2021), whereby the TSI of the late 17th century was 3-4 W/m-2 lower than at present (Haigh, 2003), during which humankind conditions were miserable and people would walk across the Seine and Thames river winter time as they were frozen over several months;
• The great famine (1315-1317), everybody starved, most died, it simply just rained too much and the weather was cool and also let's not forget the famine of 1693 due to the rain (1692-1693) and the cold, with a little scalding (1693). It is within the framework of the Maunder Minimum (MM) and more specifically the Late Maunder Minimum or LMM (1675-1715); a worldwide coverage of the MM's effects is given by Soon and Yaskell (2003). The number of additional deaths in 1693 and 1694 is an astounding 1,300,000 people, i.e. 5.8% of the French population. The Great Frost of 1708-1709 also took its toll with 600,000 death in France only;
• The MWP around year 1000 and the Vikings' settlements in Greenland (i.e. the Green Land!);
• Hannibal's crossing of the Alps with his elephants during the Second Punic War, 218 BC;
• The synchronous collapse of the Akkadian Empire in Mesopotamia, the Old Kingdom in Egypt and Early Bronze Age settlements in Anatolia, the Aegean and the Levant due the «4.2 ka BP mega drought»;
• The green Sahara 6500 BP with solar radiation up 8% as compared to present that resulted in the African monsoon becoming both stronger and reaching farther north;
• The complete disappearance of the glacier in the Alps and elsewhere around 7000 BP;
• The “8.2 ka Cold event” due to the fast drainage of the huge pro-glacial lake668 Agassiz resulting from the melting of the Laurentide and Scandinavian ice sheets;
One thing for sure, our GHG emissions were for nothing in the aforementioned catastrophic climate changes and if we extend the scope of the discussion a bit further than the local optima seen since the neoglacial started after the HCO some 8000 years ago (Figure 174), one must acknowledge that we've seen over the geological recent past, i.e. the early Holocene and the previous glacial cycle, massive and extremely fast climate changes that were, of course, totally unrelated to man-made presence or action, they are well worth being reminded to the reader and they will totally invalidate all false claims that the current changes observed would happen at a much faster rate than ever observed.
667The evidence suggests that the 10Be enhancements in 1459 may be the result of a gamma ray pulse from Vela Junior as the increase in 10Be production in the Southern hemisphere was three times that in the Northern which is consistent with the declination of -46,5° of the Vela Junior SN remnant (distance of 650-700 light-years away is a 1/10th of the distance to the closest of the other nine SN that have occurred in the past 2000 yrs). But the solar origin cannot be excluded either as 1459 falls in the middle of the Spörer solar minimum (Zharkova et al., 2019).
668https://en.wikipedia.org/wiki/Proglacial_lake and https://en.wikipedia.org/wiki/Lake_Agassiz
• Striking Sea Level Rise (SLR) since the end of the Last Glacial Maximum occurred in a sequence of various pulses669 (Gornitz, 2012), i.e. meltwater pulse 1A0 (19,600-18,800 years ago, ocean levels climbed at least 10 m within 800 years), Meltwater pulse 1A (MWP1a) was a period of rapid post-glacial sea level rise (Lin et al., 2021), between 13,500 and 14,700 years ago, during which global sea level rose between 16 meters and 25 meters in about 400–500 years, giving astounding mean rates of roughly 40-60 mm/yr as shown on Figure 104 (to be compared to current SLR of 1mm/yr as visible on Figure 98), followed by meltwater pulse 1B (11,000-9,000 years ago), meltwater pulse 1C (8,200-7,600 years ago);
• The warm Bølling–Allerød event (D-O 1) or interstadial (Hartz and Milthers, 1901) was an abrupt warm and moist period with an extreme and brutal temperature change of +10±4°C that ran from 14,690 to 12,890 years BP (Rasmussen et al., 2006) and ended abruptly with the onset of the cold Younger Dryas episode (Grachev and Severinghaus, 2005) as visible on Figure 62, p. 158;
• From the Last Glacial Maximum (LGM) backwards to the Eemian inter-glacial, there have been 25 DansgaardOeschger events, tens of Heinrich stadials and AIM events over more than 70 kyr;
• The bonus are two major super-volcanoes' explosions, one in each hemisphere (-39 kyr and -73 kyr), the Toba nearly managing to wipe out hominids from the planet;
• and the previous Eemian interglacial optimum with hippopotamuses in the British Isles due to variations of insolation resulting from the regular change of the Earth's orbital parameters;
Let's remind the reader that Dansgaard–Oeschger events (D–O events), are rapid climate fluctuations that occurred 25 times during the last glacial period. These events occur quasi-periodically with a recurrence time being a multiple of 1,470 years, see Braun et al. (2005) “We attribute the robust 1,470-year response time to the superposition of the two shorter cycles, together with strongly nonlinear dynamics and the long characteristic timescale of the thermohaline circulation” and are attributed to a complex response to solar cycles. These D-O events have occurred all over the planet, and they are not confined to certain areas as some alarmists and the IPCC would like you to believe as demonstrated by Corrick et al. (2020), a paper of course not cited by AR6. The D-O events are periods of extreme warming with temperature increases of more than 8°C in 40-50 years (at least less than 100 years), which rate of change is enormous compared to the speed of current warming, i.e. dramatic but fleeting global climatic swings characterized by a period of abrupt warming followed by a period of slow cooling that occurred during the last ice age. Today, in fact, the temperature evolution is +0.13°C/decade since January 19791, or 0.01°C/year. The current rise is therefore +0.65°C in 50 years which is more than 10 times lower than a D-O event!
Dansgaard-Oechsger events and Bond events are of very different nature. D-O events are characterized by sudden warming centered in the North Atlantic-Nordic Seas area and require glacial conditions (low sea level and extensive sea ice cover). Water stratification along salinity and temperature clines appears to be the critical factor behind D-O events. By contrast, Bond events are of opposite nature. They reflect abrupt cooling, not warming, could be heterogeneous in nature as not all events appear to have the same cause, but are well reflected from North Atlantic ice-rafted debris (IRD) to China’s Dongge cave speleothem records of the South Asian Monsoon (Cheng et al., 2016). Bond events have been recently related to solar cycles as well (Stefani et al., 2021).
Thus, so many factors are intertwined, that an heliocentric representation is not going to be simply substituted to a geocentric one as what happens when a brutal paradigm shift occurs when people realize they've been mistaken for long. In fact one may envision slow progresses where each factor acting on the climate will progressively be evidenced and their relationships established until a satisfactory global scheme will be fathomed. CO 2 may have a place in that very complex climate framework to be established, but not only will it not be in the driver seat, but that could only be a very remote back seat. It stands forefront as the gas of life, this is its ultimate role, the real wizardry of that planet.
669 A meltwater pulse is an acceleration in sea-level rise which results from outbursts of pro- or subglacial meltwater and/or surging of ice-streams into the ocean during ice-sheet disintegration, see Blanchon (2011) and Blanchon et al. (2009).
“Many people, especially ignorant people, want to punish you for speaking the truth, for being correct, for being you. Never apologize for being correct, or for being years ahead of your time. If you’re right and you know it, speak your mind. Speak your mind. Even if you are a minority of one, the truth is still the truth.” — Mahatma Gandhi
A climatologist is sort of a meteorologist (as they both use similar General Circulation Models 670) who has forgotten that no decent 15 days forecasts can be made but who has deluded him/her self into believing that he/she knows what the weather will be in a century671. This statement is not overly surprising as IPCC admitted in 2001 that «The climate system is a coupled non-linear chaotic system, and therefore the long-term prediction of future climate states is not possible», IPCC – 2001 – TAR-14 – «Advancing Our Understanding», p. 771. One should note that since this statement was made in 2001, the state of art in underlying physics (Navier–Stokes equations 672), discretization (by means of the finite difference method) and computing has not dramatically changed. Even if the computing power has increased significantly, let's remind why Gerlich and Tscheuschner (2009) dismissed climate models “It cannot be overemphasized that even if these equations are simplified considerably, one cannot determine numerical solutions, even for small space regions and even for small time intervals. This situation will not change in the next 1000 years regardless of the progress made in computer hardware”.
Notwithstanding this evidence, CAGW supporters will immediately claim that this is irrelevant, that climate is concerned with long term trends, etc., while at the same time druming all their doom and gloom as soon as some unfortunate meteorological event happens, e.g. drought, flood, cold snap, heat wave, forest fire, not one of these unfortunate situations, that have happened and been feared for as long as Sapien has been around, is ever missed to say that the climate has been disrupted by us, as if it had ever been a smooth ride to live on Earth. By doing so, they just acknowledge that the core of their dogma naively relies on equating an increase of temperature to an increase of CO 2 and that they have completely forgotten what defines the Climate as per Köppen-Geiger673 (Köppen, 1884a-b, 1936; Kottek et al., 2006). Let's recall climate predictions require knowledge of precipitations that consists of the five main groups, i.e. A (tropical), B (dry), (temperate), D (continental), and E (polar) which are further divided into seasonal precipitation patterns, and temperature changes follow.
But if no meteorological forecast is able to predict where the next major depression will be in 15 days, or hurricane or else, it also entails that beyond 15 days there is no solution to knowing where the precipitations will happen. There are of course very good reasons for that, which is that the most important component of the weather and climate, i.e. water and water vapor with clouds and complex cloud systems, are so complex and uncertain that computer climate models resort to crude representations based on “parametrization”. Convection, one of the major components of heat distribution in the atmosphere thanks to further change of state of water vapor and release of latent heat, is so badly taken into account by climate models that it must be handled via parameters, i.e. tweaking the code so that it delivers a semblance of relevance. Clouds are also typically handled using parameters, for similar reasons.
Limited understanding of clouds has impaired the success of the models and has made them unable, as we have seen before, to just reproduce the climate (integral over time of the weather) just back to the LIA. Furthermore and as explained in section “Do Climate Models Account for Observations?” p. 355, computer simulations have run way too hot and this is now acknowledged even by those who have made a living with them and have been their most supportive promoters like Hausfather et al. (2022), but things have reached such a point where the models run so ridiculously too hot that they have had to try to react and recognize that climate simulations are plagued by the ‘hot
670https://en.wikipedia.org/wiki/General_circulation_model A general circulation model (GCM) is a type of climate model. It employs a mathematical model of the general circulation of a planetary atmosphere or ocean. GCMs and global climate models are used for weather forecasting, understanding the climate, and forecasting climate change
671The classical delusion and deception is one such as expressed by Randall et al. (2007) “Note that the limitations in climate models’ ability to forecast weather beyond a few days do not limit their ability to predict long-term climate changes, as these are very different types of prediction”. In fact, multi-decadal climate predictions are claimed to be different types of prediction (i.e. called “boundary forced” as distinct from “initial value” problems), but, of course, they are also initial value predictions, as discussed in Pielke Sr. (1998) and Pielke Sr. et al. (1999). The predictability (as defined in geophysics) of these predictions is null. If an astronomer were to tell you that he does not know where an object will be in 10 days but that he knows where it will be in 20,000 years you would call him an astrologer, in our case you call him a “climatologist”.
672Navier-Stokes equations, a system of partial differential equations, were established in 1822 by French engineer Henri Navier with a seminal contribution by George Stokes.
673https://en.wikipedia.org/wiki/Köppen_climate_classification
model’ problem (Hausfather et al., 2022) to keep some sort of credence. How could such programs forecast anything meaningful? But one should remember that these software systems are the only pseudo “evidence” that the CAGW cartel provides to ascertain their extraordinary hypothesis
Let's summarize a bit where we stand:
As far as Physics is concerned:
• Arrhenius calculations were wrong and his original conjecture is flawed: CO 2 only plays a marginal role in the climate system ;
• Despite 1753 Gt of CO2 emitted since the year 1900, anthropogenic CO2 remains a tiny 6% of the overall atmospheric CO2 concentration (see p. 35). The circulation of CO2 is fast and involves vast reservoirs (see p. 58 and p. 128) and the three quarters of the total increase measured so far has also come from a natural process, i.e. the out-gassing of the tropical oceans due to an increase of their SSTs (see p. 58) and more generally a natural rise of the global temperature since the end of LIA; the residency time in the atmosphere of each CO 2 molecule is less than six years674, and the warming resulting of the CO2 increase as measured at MLO since 1958 (i.e. Keeling curve) is a typical example of a diminishing returns function, as the more the increase the less the effect, because of the logarithmic response as per Myhre et al. (1998);
• Because of a very obvious reason, i.e. Henry's law (see more specifically Equation 214, p. 290), CO2 follows T and not the other way round (see p. 51), effect cannot precede cause, therefore the CAGW theory is based on an erroneous causation;
• The ground temperature results essentially from the gravitation lapse rate, given a 1 bar atmosphere receiving an incoming solar flux of 1370 W/m2 (see p. 71), this nearly regardless of the atmospheric composition as comparative planetology teaches us (see Equation 78 p. 77), water and water vapor being unique to this planet;
• Water and water vapor (the principal GHG), are the two main players, see p. 124, but are dismissed or their role is consciously underestimated (to the profit of a trace gas CO 2) as taking due consideration of their effect shreds into pieces the CAGW theory and they resist decent software modeling (due to intrisic complexity of the various phenomenons and of small scale erratic behavior of clouds not taken into proper consideration even by the smallest grids of climate models) and thus entails that climate cannot be forecast beyond what the state of the art in meteorology is already struggling to achieve, i.e. 15 days, despite what vested interests say (see p. 350);
• 99.9618% of the CO2 ever present in the atmosphere has been removed by various natural processes (mainly weathering) over geological times and stored in one form or another (see p. 84); longer term the lack of CO2 is the problem with even C4 plants at risk of failing to achieve photosynthesis;
• Atmospheric sensitivity to CO2 is greatly exaggerated (see p. 88) and the role of water vapor vastly underestimated;
• The Greenhouse effect (see p. 107) is the only phenomenon in Physics (absorption of IR radiations by some gases) that is so badly defined and intentionally kept confusing.
As far as other sciences are concerned (e.g. Astronomy, Geology, etc.):
• Past climates, at all timescales, show that the climate has always changed for natural causes;
• Astronomical forcing, including solar and orbital variations are the main causes that drive the climate, having an action on the complex set of interacting components of the Earth-system i.e. the atmosphere, the hydrosphere (groundwater, lakes, rivers and oceans), the cryosphere (ice sheets and floes), the lithosphere (realm of geology, including plates, oceanic and continental crust and volcanoes), the pedosphere (soils) and of course the biosphere that adapts and reacts to the changes of all the former;
• Sea Level changes measured since 1907 show no acceleration (1mm y-1), half of it being originated by steric effects675 and are greatly exaggerated by selectively picking starting and ending dates at a hollow and a top of a
674IPCC is still searching for the “missing C and sink conundrum” in their budgets, e.g. (Kheshgi et al., 1996), (Houghton et al., 1998), but a lot more CO2 than thought could be transformed into organic matter as calculating surface ocean productivity has been quite challenging to say the least and carbon budgets are gravely affected. Ocean surface productivity could be exporting as much as 100 to 1,000 times more organic carbon to the deep ocean food webs than had been previously reported (Burd et al., 2010), or else a lot more CO2 could be integrated into the soils and vegetation sinks has explored in the carbon budget defended in this e-book, p. 128.
675i.e. temporal changes in the global mean density.
temporal local sinusoidal wave and used as a politically sensitive argument to strike minds and threaten people into submission to the CAGW theory ;
• Natural climatic oscillations ENSO (El Niño - La Niña), AMO, NAO, PDO are much more relevant to climate than CO2 concentration ;
• Glaciers have been receding since the end of the LIA and long before anthropic emission became significant and no acceleration is noticeable. Arctic and Antarctic, considered jointly, are stable. The North-West Passage, a good proxy for Arctic sea-ice extent, was open to shipping in 1945, and Amundsen passed through in a sailing vessel in 1903;
• Extreme events remain within known boundaries;
• The acidification of the oceans is a myth;
• Major volcanic eruptions (especially undersea as volcanism within the ocean basins currently comprises 70% of Earth’s magma output) can be very disruptive for the climate (Yim, 2022) but are dismissed and geothermal fluxes calculations are plagued with major uncertainties concerning key areas, i.e. the mid-oceanic ridges (Davies and Davies, 2010) ;
• The biosphere benefits of the little plus that a small increase of CO 2 brings and the risk is a lack of CO2 as it is the gas of life, nothing less!
Climate models are deluding as they give a false impression of established science based on irrefutable computer calculations, but:
• Climate Models have even failed to account for recent past observations;
• They are tinkered with to try to fit non-scientific objectives;
• They use data which are adjusted, or tampered with;
• They have little or no validity, beyond the 15 days meteorological forecast horizon, as they are just fit for political objectives.
Policies that will result from the dogma will be deceitful and will destroy western economies and our ways of living with no reasons:
• Many people aim benefit surreptitiously from these coercive policies for their personal gains whilst claiming the “general good of the population” as their motivation;
• Prophets of doom have been making false claims for decades. They bank on the emotional response of the people to propagate their misguided prophecies that have never come about in reality;
• Deceitful political messages have ignored factual information and deceived people intentionally;
• Thought police have been more active than ever in treating non-conforming scientists as political opponents, discouraging and/or even silencing them with threats.
You want more political ecology? Well go on, but do not come back later saying that you have not been warned! Ecofascism, as all previous forms of fascisms have demonstrated676 starts with the enactment of a “state of emergency”677 , and then will run its course crushing people for their own sake...
In the end one should observe that as explained in the section “Atmospheric Sensitivity to CO 2”, starting page 88, YES a doubling of atmospheric CO2, if possible to occur instantaneously to satisfy the computers, will provide some marginal warming with some reasonable confidence. But one should welcome this extremely minor bonus to the natural warming that already occurred since the end of the Little Ice Age (starting around 1800). Food security of Mankind has been greatly improved by the “greening” that results from the small increase of the gas of life which stimulates plants, vegetation and crops and benefits everybody. Milder climate conditions are welcome, they are essentially due to natural causes, and they only have positive consequences. There are no detrimental side-effects to this slight warming
676https://en.wikipedia.org/wiki/Reichstag_Fire_Decree The Decree of the Reich President for the Protection of People and State (German: Verordnung des Reichspräsidenten zum Schutz von Volk und Staat) was issued by German President Paul von Hindenburg on the advice of Chancellor Adolf Hitler on 28 February 1933 in immediate response to the Reichstag fire. The decree nullified many of the key civil liberties of German citizens. With Nazis in powerful positions in the German government, the decree was used as the legal basis for the imprisonment of anyone considered to be opponents of the Nazis, and to suppress publications not considered "friendly" to the Nazi cause. The decree is considered by historians as one of the key steps in the establishment of a one-party Nazi state in Germany. 677https://climateemergencydeclaration.org/
and the fables of extreme climatic events getting more frequent and harsher are just plain hogwash. History teaches us that civilizations have often collapsed whenever the climate became too cold and resources too scarce (e.g. Viking's settlement in Greenland, long Chinese history of the fall of Emperors, etc.), and we have plentiful of such examples, never when it became warmer.
As scientists, we first need state not more that we know, and surely we do not know much despite our long quest for knowledge. Climate is a tremendously complex and multi-disciplinary subject and has always been changing, at all timescales, and this is in its very nature. Studying why is a passionate endeavor, but claiming that one knows what will be the temperature or the rainfall, globally or regionally, in a century is a plain deception, a mere lie. Scaring populations with a minuscule increase of a trace gas, which has only positive consequences is a grave political treachery, designed to undertake underground social engineering. As was demonstrated throughout this document the climate responds to so many other triggers and influences in a somewhat chaotic manner that focusing exclusively on small variations of a trace gas is ridiculous (Lindzen, 2017). Claiming that the coral reefs will be gone by 2050, that Sea Level Rise will compromise the lives of millions and threaten the wealth of even more when the only example they can provide is the subsiding Carteret Islands, that extreme meteorological events will be more frequent and more severe, etc. do not resort to reason and only undermine the credibility of science and scientists in general as those who talk that kind of nonsense are considered as such by the public and the media. They either delude themselves or worse they follow some ideological agenda, stressing uselessly the public, feeding the extremism of some NGOs and putting unnecessary pressure on politicians who will end up enacting laws to no avail that will bring major disruptions to our modern, complex and fragile societies. Scientists need to be rational, do their homework for as long as required and not raise red flags unless absolutely necessary when conditions are met to be beyond any reasonable doubt. This is clearly not the case and they will bear a heavy responsibility in the future course of action of mankind.
The heritage of religions was so strong for centuries that man found it difficult to get out of the habit of thinking of an earth-centric universe, and placing himself at the center. Galileo faced inquisition and imprisonment for his view. It was astronomy that rescued us from zealots and geology confirmed that their beliefs were erroneous, both in space and in time. Such has it been throughout the history of scientific disciplines that have endured long struggles over time against anthropocentrism and other unwelcome, misguided beliefs or agendas. Paleoclimatology teaches us that climate change and even climate disasters have been the norm rather than the exception, and to think that they can be avoided by enacting regulations or appointing climate czars is not only puerile and naive but sadly delusional.
Science had succeeded in putting man in his place, an insignificant creature hosted by the third planet of a mundane solar system with a G0 star, in a mundane galaxy (our Milky Way) with 400 billion such stars and systems, such a galaxy among a local cluster of other galaxies, itself drowned among hundreds of billions of such galaxies stretching out to distances of more than 10 billion light years. Like all religions before it, environmentalism tries to put man back at the center of a mental delusion by which this time, through his evil CO2 emissions, he will ruin Eden and his own future, unless he recognizes his sins and complies with the delusional rules of his new masters, the Green Clergy, in order to redeem his faults. Mary was not more a virgin and the Christ was not more resurrected than CO 2 will destroy the climate of planet Earth. Science has now been hijacked by powerful special interests.
The hypothesis that CO2 is such a potent climate driver that after a century of large man-made emissions the IPCC is still desperately looking for a clear anthropogenic signal is based itself on belief and it has been falsified by science and by observation; that would be comical were it not for the loathsome and dire perspective that a future dystopian world has in store for mankind. CAGW appears like pathological science (Langmuir, 1989) that has managed to divert huge resources to its profit that will cruelly be missed for more meaningful endeavors. One needs to stop scaring people with baseless fears, like indomitable epidemiological spreads or climatological Armageddon and not impoverish populations with rogue policies that will harm everybody and will discredit science.
So do not call me a skeptic, that would be both incorrect and too easy to dismiss all the evidences I have brought to light in this document. I did my homework to the best of my ability and I have put my ideas in writing so that as many people as possible may calmly read, think and agree or disagree, but hopefully form a more informed opinion. I would ask all those who consider that my work was worth the effort they put in reading it to share the http:// address of where to get it for free, as knowledge and reason must prevail.
This is a climate e-book for rational people, hopefully scientists included. Let's not allow History to repeat itself and throw hundred of millions into chaos for baseless ideologies, creating damage that will far outreach eventual costs required to adapt to an ever evolving climate, and would we be responsible or not of part of the change. Scientists need
to be responsible, the unfounded problems they may create will far exceed the benefits of securing funds for the next year. I strongly support James Hansen's and co-signatories pledge for a comeback to the forefront of nuclear power and all forms of energies that may show reliability and efficiency while keeping working on more safety.
We need to remain optimists, but even then one should observe that mankind faces two real threats: the first is cooling and certainly not warming as the end of the beloved inter-glacial Holocene, this friendly interlude in mankind history, will come sooner than later and the second is a possible collision with a Near Earth Object (NEO). For each of these problems we can engineer some solutions as long as we stop wasting our time in fantasies like the CAGW and fighting a mistakenly designated foe which is our friend instead, CO2
CO2, my friend, hopefully and optimistically you will finally be acknowledged for what you are. You well deserve it, as you have been supporting life on this planet for billions of years and have never let us down. Please never fall under the fateful threshold, below which photosynthesis ceases and life ends. You will be missed for what you are, a benefactor.
There is no climate crisis and no climate urgency. Let's be rational, repel myths and the dreadful policies that might emerge. Carbon and warmth support life and this has always been so over geological times. Let's thwart suicidal plans, but let's be optimistic.
Above all, may the treasures of Science and scientific method prevail!
The Earth is an aging planet, after 4.54 billion years (Gyr) of a buoyant existence in a 13.8 billion year old Universe (life itself can be traced back to more than 3.5 Gyr) and geologists have a very good understanding of the last 570 million years as shown on Figure 51. All other telluric planets in the solar system have died long ago either as active geological bodies (except tide driven volcanism for satellites like Io) or as platforms able to host and support life (if they ever were), each for very specific reasons. Comparative planetology is very telling and teaches us that the Earth has become an old lady, an aging celestial body. Never the Earth has been so cold over its entire geological history of 4.54 Gyr, and the climate has kept getting more and more hostile since the last Paleocene-Eocene Thermal Maximum (PETM), 56 million years ago as visible on Figure 73, and the last 2.58 million years, i.e. the entire Quaternary Period, have been a nearly constant ice-house age, because at least one permanent large ice sheet, i.e. the Antarctic ice sheet has existed continuously and was only interrupted by short inter-glacial periods, see Figure 66.
During the early Quaternary, the fluctuation period between two successive glacial episodes was about 41,000 years due to the interplay of precession, obliquity and eccentricity (see explanations p. 195), but following the MidPleistocene Transition it has slowed to about 100,000 years, as the Earth continued cooling and will return soon to an ice-age in 1,500 years (see Figure 69). Over the past 740,000 years there have been eight glacial cycles, and mankind had difficulties surviving both the Toba explosion (a VEI-8 catastrophic volcanic event, 75,000 yrs ago) and the hostile ∼ climatic conditions that prevailed. The planet managed to exit the ice-ages only one out of three attempts offered by the tilt cycle of 41 kyr as it took 120,000 years since the Eemian (MIS-5e; 131–114 kyr ago) to return to milder conditions, i.e. the Holocene.
At the end of the Last Glacial Maximum (LGM), i.e. 23,000 years ago, CO2 concentration in the atmosphere went as low as [150-180] ppm, a very dangerous level and life was on the brink of exhaustion as under 150 ppm the photosynthesis stops and thus all life would cease to exist. Hopefully some 13,000 years ago, coming in the aftermath of the “Younger Dryas”, the temperature has increased rapidly as visible on Figure 62 due to a favorable set of orbital conditions, the ice-sheets that covered most of Septentrional Europe and Northern America have receded and a marine transgression of more than 130 meters over 8,000 years, stopping -4.500 years ago, invaded the continents (see Figure 103). The temperature reached an optimum, known as the Holocene Climatic Optimum (HCO), some [9,500-5,500] years ago as displayed on Figure 59, the Sahara was green, all favorable conditions that were never experienced again as the cooling trend re-established itself and still prevails. The Holocene, this blessed period of 13,000 years that humanity has just lived, that accounts for a tiny 0.00029% of the entire Earth's history will soon and alas come to an end as the orbital decision to terminate this interglacial is already baked in the astronomical cards (see Figure 61). Science knows, but this knowledge is of no avail to mankind's survival if ruined by special interests and scuttled by politics and ideologists.
Over the last 2,500 years we had three positive favorable small counter-trends of this already cooling inter-glacial, the Roman Warm Period (RWP), the Medieval Warm Period (MWP) and the Modern Optimum (MO) which owe nothing to the level of CO2 concentration in the atmosphere, the RWP being slightly the warmer of the three as proven by many records, see page 144. We should of course celebrate the MO, being slightly warmer than the Little Ice Age which ended around 1850, happened to be a trying period for humanity, with famines and widespread sufferings (see footnote 144). The increase of the CO2 concentration in the atmosphere since the end of the LGM is the result at 94% of the natural out-gassing of the oceans as per Henry's law (1803), man-made emissions which accelerated since 1950 providing the remaining 6% of a trace gas that overall represents a tiny 0.04% of the global atmospheric composition.
CO2 is a trace gas having next to zero influence on the climate. It is essential to the very existence of life on Earth and the increase from a dangerous low level 23,000 years ago to safer levels of 400 ppm has re energized an old planet, triggered increased photosynthesis and resulted in the incorporation of 570 Gt-C into CO 2 sinks since 1900 as per the CB presented in Figure 48. It has provided more food to all living species on Earth, regardless of its position in the food chain. If mankind marginally contributes to it, this should be welcomed as it helps to sustain life on Earth. 99.9618% of the CO2 ever present on Earth has already been removed (see p. 133) and is stored in limestones, chalks and sediments in the range of [66,000,000 Gt-C – 100,000,000 Gt-C] and as fossil organic materials in excess of 13,000,000 Gt-C. Thus the risk to life on this planet is a lack of CO2 not an excess of it.
Climate models and atmospheric science give a myopic view on an otherwise much broader and complex Earth system by focusing on the IR absorption properties of a trace gas which plays a marginal climate role, given the fact that the Earth is first and foremost a thermodynamic machine based on a complex hydrological and hydrodynamic cycle and where most of the heat is stored in the oceans with longer response time than most short-sighted General Circulation atmospheric Models (GCMs) can handle. The drastic limitations of these GCMs in succeeding to attribute even part of the warming observed during the MO to man-made emissions and their inability to make any unequivocal forecast at the climate timescale is now acknowledged by the very scholars who develop them. No compelling evidences of the role that man-made CO2 emissions could have on the climate are available and focus should be given to adaptation to an ever changing natural environment, and to remediation measures especially within the context of rapid changes of land use.
Finally a warmer world is a better one and we will be brutally reminded of this when the inter-glacial period ends.
The bigger picture is that contributions from around 15 scientific disciplines need to be deployed, mostly in the Earth and Space sciences, to give the right perspective on where we stand and on the risks humanity faces. These include: dropping below the fateful CO2 threshold of 150 ppm, or a collision with a Near-Earth Object (NEO) that had not been detected in time, or that could not be destroyed or diverted (TF-PHA-NEO, 2000).
The CAGW theory is the worse ever stupid idea that the failed XXI century science 678, harnessed by political motives and supported by ideologists, will leave in its records and is being used by the dominants to enslave the gullible public.
“Give me liberty or give me death!” Patrick Henry679 (1739-1799), one of America's most outspoken Founding Fathers.
Now come the morale of the story: this is the fable of the atmospheric physicist and the climate scientist.
Fable of the atmospheric physicist and the climate scientist or a development without merit!
Within the limits of their ability in science and with the fastest computers, atmospheric physicists are hardly able to make any reliable weather forecast fifteen days ahead. Nevertheless, by deciding that the problem was no longer depending on the initial conditions, but rather a boundary one enabling sensitivity studies, and by adding one single grossly irrelevant variable, carbon dioxide, they felt entitled to become climate scientists and to make forecasts of changes for decades or a century ahead: this notwithstanding the fact that a number of natural cyclic driving climate have time constants well in excess such short timescales. There are irregular variations too. It was of course a hoax. The attraction to the proponents and followers of the hoax was that it provided much leverage for politicians, always eager to increase their control of the general population, and it proved to be irresistible for them. Subsidies attract followers from those with vested interests. For the rest, it unfortunately inflicts severe damage by way of reduced prosperity and more generally, erosion of the progress of society as a whole. The morale of the fable is that integrity of science has been tarnished by this quackery and group-think.
678Unfortunately, this will not be the first failed superseded theory and in a funny way “global cooling” is listed as one of them, see https://en.wikipedia.org/wiki/Superseded_theories_in_science. When the Holocene will end soon and the stadial will resume it will be time to replace it with global warming and / or its substitutive designations, i.e. global change (how stupid), green revolution, etc.
679https://en.wikipedia.org/wiki/Patrick_Henry
This work would not have been possible without the support of Camille Veyres 680 and the remarkable fight for the scientific truth that he and his co-workers and in particular Jacques-Marie Moranne681, the author of the book “La Physique du Climat” pursue with the association of the “climato-realists”682 led by Benoît Rittaud. Camille sent me many documents that I have used as a basis for elaborating some parts of this work, always answered my questions when I was in doubt, and furthermore his exceptional knowledge in physics and his broad understanding of the subject have given me the strength to dare put forward my ideas, not fearing to be immediately crushed by herds of critics. One should certainly not underestimate this aspect, the disparagement goes pedal down to the metal and those who dare dissent must feel strong enough to defend their informed opinion when everything is made by the CAGW theory supporters to deter them from even trying; this is self-censorship encouraged, and this is what works best. I also thank Camille Veyres for having proof-read some parts of the document and having spotted some mistakes that I left behind whatever the care I put to write this book to the best of my scientific honesty and ability. Javier Vinós, has been a great source of inspiration and I would like to thank him very much, and I strongly recommend his book published in September of 2022 (Vinós, 2022) “Climate of the Past, Present and Future: A Scientific Debate” to anyone wishing to get a clear insight in many phenomenons driving the climate; it represents more than 7 years of efforts to bring all the material he has contributed, in particular to Judith Curry's reference site, Climate Etc., https://judithcurry.com/. Javier's work is fantastic and I hope that it will be given a wide visibility.
I am very grateful to Jacques Duran683 (1942-2018) who ran for years the website in French language http://www.pensee-unique.fr (“one-track thinking” our “groupthink”) that alas does not respond any longer as June 2022, and provided so many useful analyses and insights into this strange discipline, i.e. “climate science”. Jacques Duran was initially the young student (in quantum physics) of Pierre-Gilles de Gennes, the Nobel Prize laureate in physics in 1991684, who helped and encouraged him a lot during his early work on the diffusion of energy in disordered isotopic materials, and then in the following years, particularly with regard to the research they carried out on the physics of granular matter. In 1996, P.-G. de Gennes, then director of ESPCI, proposed to Jacques Duran to come and work with him as Director of Studies and their collaboration continued until de Gennes' disappearance in 2007.
Duran's death in 2018 put very unfortunately an end to the critical analysis of the many articles he reviewed on his website. It is by reading Jacques Duran that I was confirmed in my opinion that nothing was going well in this discipline. Duran reminds what Gennes and Badoz (1996) wrote about their confidence in simulations “Environmental problems are often managed by "simulation" specialists, i.e. people whose competence is more in computers than in scientific data. Using a large computer, they produce predictions that seem respectable, even if the data are insufficient. This is one of the great plagues of our time. The misfortune is that many people still believe that the computer tells the truth and predicts the inevitable (the same type of belief existed in the 19th century with regard to printed text). The computer simulator is credible because its machine has a power and speed of calculation that no human brain is capable of. The snoring power of numbers plus the power of images: enough to maintain a magical pre-rational mentality in the public mind”.
The COVID-19 time might be one extraordinary example of the damages caused by the "simulation specialists” of de Gennes, as Neil Ferguson's Imperial College model and his millions of deaths in the UK alone could be the most devastating software mistake of all time (Richards and Boudnik, 2020), the most costly self-inflicted pain ever. This has been an extraordinarily challenging period for many people, including investors who rely on their investments to make a living. What ended being just slightly worse than a seasonal flu in terms of its epidemiological consequences, and could have been diagnosed as such rapidly, has led to bloated consequences by dints of disproportionate government
680Camille Veyres graduated from Ecole Polytechnique (X67), Ecole Supérieure des Télécommunications and also holds a MBA from HEC (École des hautes études commerciales de Paris) school of management.
681Jacques-Marie Moranne, the author of the book "The Physics of Climate" is an engineer from the Ecole Centrale de Lille (1969). Jacques-Marie Moranne was initially, and until the Copenhagen COP, a climate alarmist, but contradictions, both factual and physical, have awakened his critical mind, and have gradually led him to dig into the underlying physics. https://laphysiqueduclimat.fr/
682https://www.climato-realistes.fr/
683https://fr.wikipedia.org/wiki/Jacques_Duran and http://www.pensee-unique.fr/auteur.html
684Pierre-Gilles de Gennes was also one of the signatories of the “Heidelberg Appeal” which was signed by 425 members of the scientific and intellectual community skeptical of the claims of the global warming alarmists that warming was a scientifically verifiable event (HAHSG, 1992; DeWeese, T., 2002).
response and generalized lock-downs. This led to flatten everything, businesses, portfolios, hopes in the future and the only things that were not flattened have been the unemployment curve and the nations' debt which exploded.
In the wake of this disaster, scare mongers like Gates (2020) have hinted to the pretext for next massive coercion, climate change. Unfortunately, it seems that from some recent statements made by Heads of States that the terms of the “Heidelberg Appeal” made by 425 leading researchers including de Gennes and dozens of Nobel laureates has been forgotten; let's remind the following excerpt “We want to make our full contribution to the preservation of our common heritage, the Earth. We are, however, worried at the dawn of the twenty-first century, at the emergence of an irrational ideology which is opposed to scientific and industrial progress and impedes economic and social development. We do, however, forewarn the authorities in charge of our planet’s destiny against decisions which are supported by pseudoscientific arguments of false and non relevant data”.
The climate change narrative had been itching me for a long time, but this was the last straw which broke the camel's back and the hankering to put things straight became simply too great to resist. A bunch of civil servants, paid whatever happens, had not yet finished to ruin our economies with policies that destroyed all our fundamental freedoms that they jump head-on to what will be the next curse: climate change! What climate change? As long as it was just paying more taxes, the fight was not worth it, but now, here they are, ideologists talk about brutal choices: that means implementing dystopian policies on large scale. This is how I decided to gather what remained of my bruised strengths and to try, as an honest scientist, to demonstrate how foolish these future Eco lunacies and policies of fascist scents are (WBGU, 2011), (Vahrenholt von, 2011).
I am grateful to Michel Detay685 who encouraged me in various ways going trough this challenging time and kick-started my effort by sending me the must-read book from Allègre (2010) and who urged me to re-edit all equations to improve their readability and provided me with many papers on volcanology, to Pierre Haren 686 for making many suggestions to help improve the book but I am afraid that a new version will have to be edited to match his expectations, to Brendan Godwin for pointing to inconsistencies in my first attempt to devise a new Carbon Budget (p. 128) and for the various excellent papers he pointed my attention to, thanks to Michael Brown who made much appreciated improvements, to Jean-Claude Maurin687 for his careful, kind and insightful reviewing, to the Pr. Harald G. Dill, Badar Latif, Dan Pangburn, Dr. Janusz Pudykiewicz, to Michael Sidiropoulos for his kind and supportive words, to Kosma Szutkowski and all colleagues who cheered me up, especially on Researchgate, whenever necessary.
Special thanks to Zark Bedalov688, from Vancouver (British Columbia, Canada), the author of Wiley book “Practical Power Plant Engineering689”, for the extremely careful reading he made of the entire document of my first edition, in a very supportive way, to Achim Lohse and also to other individuals who checked the book but wished to remain anonymous. I am grateful to “Researchgate” and “Academia” who facilitate the work of independent researchers, who otherwise meet difficulties getting some articles when they do not benefit of the access facilities offered to affiliated persons and institutions. They truly contribute to lifting the embargo otherwise put on knowledge by some dominant publishers. I am very grateful to the Apache Software Foundation and the OpenOffice Community, this document would not exist without them. Finally the “pdf” file generated is compressed to make it smaller and easier to download using a great tool: https://www.ilovepdf.com/compress_pdf
I must also mention all those who cheered me up, congratulated me for my work and encouraged me to go further in one way or another, including supporting my project on “Researchgate” entitled “Multi-disciplinary Perspectives on Climate and Paleo-climates”. Hopefully they have been many and I will thank especially Ijaz Ahmad, Maria Assunção Araújo, Safia Belhadj, Pr. Guus Berkhout, Maged Gumaan Bin-Saad, Artur Braun, Christopher Robin Bryant, Hugo FR Bucher, Martin Capages Jr., João Carvalho, Jamel Chahed, Kervin Chunga, Marcel Crok, Neil Dagnall, Robert David, Prof. Dr. rer. nat. habil. Harald G. Dill, Vera Maura Fernandes de Lima, Serge Ferry, Burghard W. Flemming, Dr. Patrick Frank, Dmitry Ganyushkin, John Joseph Geibel, Pr. François Gervais, Anna Geppert, Eric Gilli, Albrecht Glatzle, Pierre Gosselin,
685https://www.researchgate.net/profile/Michel_Detay (D.Sc. 1987) is a renowned expert in hydrogeology and hydrovolcanology.
686Pierre Haren graduated from Ecole Polytechnique (X73) (1976) and Ecole des Ponts et Chaussées (1978) and also defended a thesis at MIT: https://www.lajauneetlarouge.com/auteur/pierre-haren-73/. Pierre initially specialized in fluid dynamics, hydrodynamics, equations of motion (Haren, 1979; Haren and Mei, 1979, 1980, 1981, 1982). He joined INRIA to lead a project aiming at creating expert-system shells for engineering design. I joined his project late spring 1986 and I was the first employee of ILOG corporation (Pierre acting as CEO) even before it started thanks to Eurosept corporation led by Marc Fourrier (X73, Ponts et Chaussées) who hired me in the meantime. I'm grateful to both.
687https://www.science-climat-energie.be/author/jc-maurin/, J.-C. Maurin is “professeur agrégé de physique”.
688https://www.linkedin.com/in/zark-bedalov-035921153/
689https://www.amazon.fr/Practical-Power-Plant-Engineering-Engineers/dp/1119534941
Eugen Gradinaru, Kesten Green, Volodymyr Grytsenko, Lucy Hancock, Pr. William Happer, Rakib Hassan, Prof. Dr. rer. nat. J. Häuser, Victor Manuel Naumovich Velasco Herrera, Roger Higgs, Paul Homewood, Robert Ian Holmes, Alireza Khoshkonesh, Demetris Koutsoyiannis, Sandeep Kumar, David Legates, Paulo Legoinha, Markus Lindholm, Pr. Richard Lindzen, Alexey Lyubushin, Hector Maletta, Keith Martin, Dr. rer. nat. Andreas May, Andy May, Fateh Mebarek-Oudina, Boris Menin, Philip Mulholland, Colin V. Murray-Wallace, Juan José Neiff, Franto Novico, Antonio Pasculli, Raul PerezLopez, Sébastien Point, Joseph Postma, Alain Préat, Janusz Pudykiewicz, Sergey Viktorovich Pushkin, Jacques Roturier, Benoît Rittaud, Indrani Roy, Boris A. Sheiko, Jan-Erik Solheim, Willie Soon, Ch. Srinivasrao, Kosma Szutkowski, Sachin Kumar Tripathi, Brigitte Van Vliet-Lanoë, Costas Varotsos, Alla Constantinovna Vasil'chuk, Eric Verrecchia, Frank Veroustraete, Paolo Viaggi, Wenjie Wang, Filipe Wiltgen, Gregory Wrightstone, Steven Yaskell, Ismail Omer Yilmaz, Christopher Gerard Yukna, Bogdan A. Zaitsev, Franco Zavatti and all those who helped me disseminate my work on their excellent web-sites. I apologize for all those not mentioned but not forgotten, I am also grateful to them and in particular to the 130 scholars who have recommended so far this e-Book on “Researchgate”. I also thank the 68 “followers” and 133 “recommendations” of my researchgate project “Multi-disciplinary Perspectives on Climate and Paleo-climates” and the 498 researchers who have followed me back and thus provided support to this work. They come from all scientific disciplines and show the broad spectrum of interest that this work has generated and I am grateful to them for that. I have also very much appreciated the many personal messages of encouragement that I have received. Each one of them was important for me.
A special mention to those who kindly permitted me to use their material and some figures with a particular mention of gratitude for Patrick Frank, Ole Humlum, Camille Veyres and Javier Vinós.
I also thank all those who have kept challenging me on the various threads of discussion dealing with the subject, in particular over Researchergate and over the Clintel's email exchange lists. They have contributed by bringing a skillful opposition to the ideas I developed to making them clearer, better expressed and therefore stronger. It may not have been their intent, but in the end it was the result. That was the strongest form of all peer-reviewing efforts.
Finally a couple of individuals, deserve a special mention, because full of their self-confidence and bloated of conceit and contempt for the other scientists, by thinking that they are the only ones to understand exceptionally complex notions such as a log-response (!) when any 15 years old youngster who gets a basic training in science already knows it, and one of them calling “dissenters” like me “morons”, gave me even more strength to smirk at their slighting and work more to debunk the fake arguments of these pompous windbags full of condescension. They reminded me the saying of Georges Courteline690 “"Passer pour un idiot aux yeux d'un imbécile est une volupté de fin gourmet." or as automatically translated by Deepl691 "Looking like an idiot in the eyes of a fool is a gourmet's delight." Isn't it ? One of them has even become the dregs of the “troll” activity, posting several messages everyday on Researchgate discussion threads, pretending making a “review” of my book when it was just an accumulation of libel, disparagement, slanders, etc. Such deranged individual would normally not deserve a single line in a book like this, but they are so much representative and living caricatures of the arrogance of some in this climate science community that I could not refrain mentioning them elliptically. The goal is of course, by these despicable means, to try to silence people like me. The stakes must be high for those people to resort to such hatred and such obnoxious methods. One must know that by exposing the castle of cards of the pseudo-science used to scare the gullible people, one becomes a target. One will observe that this individual was affiliated with ECN, a dutch organization that drew some attention for the curious ethics of its former director (nos, 2016; rondjeschagen, 2016). Those in the role and their fellows will recognize themselves, they well deserve a medal, I let the reader decide which one.
I could only fly over this immense subject with great pleasure, but also with a certain lightness in order to tell the extraordinarily complex history of the climate over time and the parameters influencing it. I am sure I will be criticized in places for accommodating what should be an even more rigorous presentation, but the reader will keep in mind that each chapter or section deserves a book of its own. A narrative choice had to be made that would preserve the interest of the reading without distorting the subject too much, while showing its very large scope. At least, I hope to have demonstrated by the breadth of the topic that there is no way to regard carbon dioxide as the climate’s ultimate magical ‘control knob’, a stance sadly promoted by the “catastrophists” for which the science is largely irrelevant anyway as politics is their bread and butter. I also thank the Deepl translator team for their product which provides an efficient way to achieve reasonable quality at no cost. Upgrading to professional version will be a must even for small companies.
690https://en.wikipedia.org/wiki/Georges_Courteline
691https://www.deepl.com/ is a very good automated translator and I thank them for the support they provided for this work.
Whatever my efforts to make this e-book as accurate and reliable as possible, and the kind contributions of all the peerreviewers who helped me improve this work and there were many, physicists, earth-scientists, engineers, etc., I must state that all mistakes (there will be some, how could it be otherwise?), be they scientific, technical, linguistic (spelling or grammar) will remain mine and I apologize in advance for them and commit myself to correcting them as soon as they will be pointed out to me. I thank all the competent readers in advance who will keep helping me improve this document.
This work was carried out initially from the Republic of Malta (EU) at Iklin where I lived for five years (2017-2021) and I am grateful to the Maltese people for their warm welcome during all these years. I then kept on working from various places, including Gilboa (NY), Santa Rosa (CA), Nice (France), etc. This work is dedicated to late scientists, authors and intellectuals who fought for the truth and in particular against the climate scam until their very last days, and I apologize in advance for all those I forgot to mention. I admire the courage, the lucidity and the will to truth of all those I have the honor to mention now: Tim Ball692 (1938-2022), Reid Bryson693 (1920-2008), Robert M. Carter694 (1942-2016), Roger W. Cohen695 (1939-2016), Michael Crichton696 (1942-2008), John L. Daly697 (1943-2020), René Dars698 (1921-2021), Jacques Duran699 (1942-2018), Freeman Dyson700 (1923-2020) who passed away on 28 February 2020, Hugh W. Ellsaesser701 (1920-2015), Vincent Gray702 (1922-2018), William M. Gray703 (1929-2016), Zbigniew Jaworowski704 (19272011), Karin Labitzke705 (1935-2015), Harold ("Hal") Warren Lewis706 (1923–2011), Harry van Loon707 (1926-2021), István Markó708 (1956-2017) who supported me until he left us on 31 July 2017, Patrick Michaels 709 (1950-2022), Axel-Nils Mörner710 (1938-2020) who died on 16 October 2020 and was just starting a new journal “Science of Climate Change” to which I would have had the pleasure to contribute, Murry Salby (1951-2022)711, Frederick Seitz712 (1911-2008), Joanne Simpson713 (born Gerould) (1923-2010), Fred Singer714 (1924-2020).
We will thoroughly miss their intelligence and scientific honesty.
692https://en.wikipedia.org/wiki/Tim_Ball 693https://en.wikipedia.org/wiki/Reid_Bryson 694https://en.wikipedia.org/wiki/Robert_M._Carter. Shame on William Connolley for his post (Connolley, 2016) who grossly paraphrasing Max Planck supposedly saying "A new scientific truth does not triumph by convincing its opponents and making them see the light, but rather because its opponents eventually die, and a new generation grows up that is familiar with it". Stated “Today brings us news of another such advancement in science, with the reported death of Robert Carter”. Shame on you, William Connolley, scientific truth advances because it is proven correct, not because an entire generation of illiterate have been indoctrinated while waiting for the death of your opponents. You are despicable and disgusting. You just confuse science and politics.
695https://physicstoday.scitation.org/do/10.1063/pt.5.6265/full/ and https://co2coalition.org/members/roger-cohen-phd/ 696https://en.wikipedia.org/wiki/Michael_Crichton and https://en.wikipedia.org/wiki/State_of_Fear 697Eulogy by Ball (2016a), http://www.john-daly.com/, https://en.wikipedia.org/wiki/John_Lawrence_Daly, 698https://fr.wikipedia.org/wiki/René_Dars René Dars was Professor Emeritus, Dean of the Faculty of Sciences of Nice and co-founder of the SophiaAntipolis scientific cluster. He supported me to present and defend my D.SC. I am grateful to him as to Pierre Leymarie, my advisor. 699https://fr.wikipedia.org/wiki/Jacques_Duran
700https://en.wikipedia.org/wiki/Freeman_Dyson
701https://www.researchgate.net/scientific-contributions/80246443-Hugh-W-Ellsaesser
702https://en.wikipedia.org/wiki/Vincent_R._Gray
703https://en.wikipedia.org/wiki/William_M._Gray 704https://en.wikipedia.org/wiki/Zbigniew_Jaworowski 705https://de.wikipedia.org/wiki/Karin_Labitzke 706https://en.wikipedia.org/wiki/Harold_Lewis – Nodoubt that “Hal” was a free-thinker, He, along with the other theoretical physics professors at Berkeley, refused to sign the McCarthy era loyalty oath on principle, and in 1950 left for Princeton. 707https://www.researchgate.net/profile/Harry-Van-Loon alas Mikael van Loon informed me that his father Harry had passed away on Dec 13, 2021. I suppose Harry was born in 1925, because he said in his interview with von Storch “Well, I will be 80 next year (2005) for heaven's sake” or rather in 1926 because he also said that he stepped down from the NACR position as scientist IV in 1991 because he was 65 years old. 708https://fr.wikipedia.org/wiki/István_Markó https://www.researchgate.net/profile/Istvan_Marko 709https://en.wikipedia.org/wiki/Patrick_Michaels 710https://en.wikipedia.org/wiki/Nils-Axel_Mörner 711https://en.wikipedia.org/wiki/Murry_Salby and https://www.mck.org.au/search/55952 712https://en.wikipedia.org/wiki/Frederick_Seitz 713https://en.wikipedia.org/wiki/Joanne_Simpson see also Pielke, R. A., Sr. (2008) 714https://en.wikipedia.org/wiki/Fred_Singer
I graduated in Geochemistry, Geophysics, and Remote Sensing with a Diplôme d’Etudes Approfondies, DEA (Master of Advanced Studies) from Ecole des Mines de Paris / CTAMN (1982) - First in my class ("Mention Très Bien", i.e. grade point average > 18/20). I defended a Doctorat d'Etat ès Sciences (D.Sc.) in Geochemistry, Geo-Mathematics and Geo-Informatics (1986) at University of Nice Sophia-Antipolis and INRIA (National Research Institute in Computer Science and Automation) - "Mention très honorable et félicitations du jury".
As co-founder and very first employee of ILOG in 1986 (even before the formal creation of the corporation), I contributed to the development of this software company which later had offices in Europe, US and Asia and was listed on the NASDAQ stock exchange before a buy out by IBM in 2009. I joined CSTB in 1989 and led the Computer Integrated Division until 2001. I was involved in many European research projects in the area of integration in manufacturing. I also was an active reviewer in ESPRIT and was involved in assessing projects in different areas. In 2001 I created and led the SAIL department (Software Applications and Integration) with 5 divisions: software development, virtual reality, data and systems' integration, facilities management, advanced models for finite element analysis. In 2004, I was in charge of software matters and policy before I left CSTB in 2005. I am also an experienced trader since 1996 and developed together with my associate a state of the art expert-system to implement our trading methods (i.e. TEXSOL, Trading Expert-Systems On-Line) and to develop the art and technique of trading automation, with deployment on the US and French markets (stocks, ETFs, indexes).
I have an interest in various domains like Earth and Planetary Sciences, Astronomy, Finance and Trading, Integration in Manufacturing and Design, Simulation and Defense Systems, etc. I published 38 articles mostly in peer-reviewed scientific journals, 6 books jointly-reviewed with colleagues, 6 peer-reviewed chapters in books, 64 papers in peerreviewed conferences, one D.Sc. thesis (1986), and 32 scientific and technical reports for demanding public and private clients and acted as an expert reviewer for several EC R&D projects.
Given the importance taken by climate simulation systems (i.e. software) I will stress that most of my professional career was devoted to Applied Computer Science in various domains like:
• Geochemistry, Hydrogeology, expert-systems in Earth and Planetary Sciences, e.g. (Leymarie and Poyet, 1983; Poyet and Leymarie, 1983; Poyet, 1986; Poyet and Detay, 1988a-b-c; Poyet and Detay, 1989a-b-c, 1990; Detay et al., 1989; Detay and Poyet, 1989; Leymarie, 1989; Detay and Poyet, 1990a-b-c-d; Detay et al., 1991; Poyet, 1992; Poyet and Detay, 1992),
• Simulation and Defense Systems, e.g. (Poyet, 1987; Poyet et al., 1987; Poyet, 1988; Poyet and De La Cruz, 1988; Poyet and Haren, 1988; Poyet et al., 1989; Tomasini et al., 1991),
• Applied Artificial Intelligence, e.g. (Poyet and Delcambre, 1989, 1990; Poyet, 1990; Poyet et al., 1990, 1991, 1992; Debras et al., 1991),
• Computer and Software Integration in Construction, Manufacturing and Design, Concurrent Engineering and Virtual Enterprises e.g. (Poyet, 1993; Tolman and Poyet, 1994; Poyet, 1994; Poyet and Dubois, 1995; Poyet et al., 1995, 2002, 2004; Poyet and Monceyron, 1997a-b; Monceyron and Poyet, 1997; Poyet and Zarli, 1997, 1999; Sandakly et al., 2001; Zarli et al., 1997; Zarli and Poyet, 1999a-b, 2017),
• Finance and Trading, e.g. (Poyet and Besse, 2005a-b; Poyet, 2012),
• Astronomy and Planetology, e.g. (Poyet, 1982, 1985, 2014, 2017a-b, 2019; Poyet et al., 2014).
I have been interested in comparative planetology for a very long time (Poyet, 1982, 1985) and since 2015, I have spent some time on computing double stars' orbits (Poyet, 2017a-b, 2019) but mainly studying paleo-climates, climate drivers, and natural climate change (Poyet, 2021a-b).
My friends refer to me as a polymath, my foes as a “touches everything”, the truth must be in between. I always try to gather enough knowledge on any given subject I work on as to have a large perspective on it and avoid too narrow of a specialization that would blur the broad picture. That's also why, given my my initial training in earth-sciences and the
thousands of papers I have read on the climate subject and the past experiences I have in deploying computer systems in so many domains as listed above and simulation systems in particular, I have a special perspective on climate science, what has become a controversial domain, rather a real mine field if one does not stick to the one-sided dominant groupthink.
Thus, I have been legitimately and logically using my initial training and my passion for Earth and Space sciences plus my long professional experience of software design and development and in particular of simulation systems to completely revisit the subject of climate and paleo-climates. This led me to publish the first version of the “Rational Climate e-Book” at the end of 2020 that drew some attention over the next year and a half, with tens of thousands of downloads (more than 18,000 on “Researchgate715” alone and more than a hundred scientists who recommended my work in June 2022) and also several thousand users from all over the world on my private web site “patricepoyet.org”, both from the public and the scientific community.
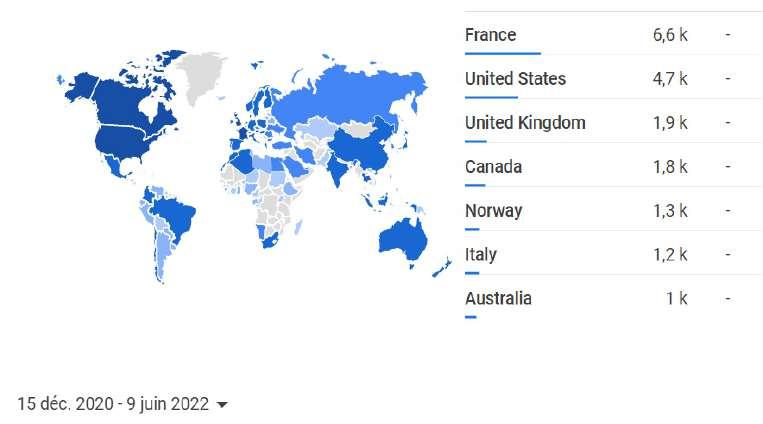
I have the pleasure to thank all those who contributed to make this work better known to the public as I had no specific marketing means. In that respect I wish to thank Andy May who wrote a “Book Review” 716 for the well known Antony Watts' website “https://wattsupwiththat.com/”, and to thank Antony Watts for welcoming this review and also for relaying Pierre Gosselin's review717 of my work that was also published on Pierre's website718 “https://notrickszone.com/”. I also have the pleasure to thank Paul Homewood for making a review on his site 719 and supporting me as well as Guus Berkhout and Marcel Crock of Clintel720 who publicized as well my work. Thanks to all of them for their invaluable support. This book has also enabled me to be acknowledged as an expert in various domains, including in how much geochemistry, my initial training, is a discipline that offers an outstanding scientific background for the interpretation of the paleoclimate records, but also in many other areas having a link to paleoclimate an climate change in general, given that the ebook resorts very much to polymath knowledge. This first effort has also enabled me to extend further contacts with a host of colleagues, like legendary physicists Richard Lindzen or William Happer, but also many great scientists and if I were to be naming only a few I would also have to apologize to all the others that I would have forgotten to mention, but who remain in my heart for the support they provided me.
I had been in stark disagreement with the official doxa for decades, but the first startling alert came when François Hollande (a former French President) stated (in French) at the 70th session of the UN General Assembly in New York, on September 28, 2015 that tsunamis and earthquakes will be the result of uncontrolled anthropic global warming (Hollande, 2015b). He was obviously deluded by his own entourage who certainly ensured him that no doubt
715https://www.researchgate.net/publication/347150306_The_Rational_Climate_e-Book?_sg%5B1%5D= 716https://wattsupwiththat.com/2021/01/18/the-rational-climate-e-book/ 717https://wattsupwiththat.com/2021/02/05/climate-researchers-new-e-book-ipcc-significantly-overstates-co2-the-sorry-state-of-climate-science/ 718https://notrickszone.com/2021/02/05/climate-researchers-new-e-book-ipcc-significantly-overstates-co2-the-sorry-state-of-climate-science/ 719https://notalotofpeopleknowthat.wordpress.com/2021/01/27/the-rational-climate-e-book-by-patrice-poyet/ 720https://clintel.org/the-rational-climate-e-book/
remained, that science was settled and that the alleged urgency would require to further force the line in his presentation to maximize political impact. How Heads of States would know? But for a Geo-scientist like me, if he had said that the Earth was flat and the Sun turning around us as believed for eighteen centuries, it would not have been more shocking.
Unless plate-tectonics and convective motions in the Earth's mantle driving the drift of the plates and thus earthquakes and tsunamis would become sensitive to extremely scarce CO2 molecules in the atmosphere by some magical thinking, how such statements could be made? it was a clear message that the official word of a great scientific and industrial nation was totally discredited. When the dominants and the “warmunists” unveiled their agenda further in a clearer way, saying that if Covid was bad, wait until climate-change to see what we can impose on you, the people, I thought that no one could remain idle awaiting the violation of the most fundamental rights of the citizens based on a pretext relying on some fallacious conjecture and phony science. The more I dug into the subject for which I had had a long standing interest anyway and for which I had gathered a massive pool of articles and references, the more I had to acknowledge how little science there was left in the official group-think and how much politics was in fact at play. That triggered me into action and the truth, not always good to say, remains a legitimate ideal.
The entire climate science rests on very thin ice, i.e. the credibility of computer models. Given that beyond my initial training in Earth and Planetary Sciences, software is what I have done my entire life, i.e. applied computer science, I am well equipped to evaluate how sound the claims of the alarmists can be. Be it for the modeling of geochemical or hydro-geochemical anomalies and the spreading of various species and compounds in the aquifers, for the physics of undersea sound propagation used to derive bathymetric models required for submarine simulation warfare, for Kalman filter-based carrier motion simulation to facilitate A.I. assisted aircraft landing, for missile handling and target motion analysis and pursuit, for underground water modeling to ensure village water supply in Africa (e.g. North Cameroon), for data and software integrated models in construction and engineering, for CAD representation and exchange, for computing double stars orbits, etc., computer models are always the same: just models that strive to stick to reality, mimicking somehow some properties of the real world. But the more complex the system modeled is, the less it can pretend to accurately represent the reality.
Since I published the “The Rational Climate e-Book: Cooler is Riskier. The Sorry State of Climate Science and Policies” (Poyet, 2021b) and the “Book Review: “Politics & Climate Science - A HISTORY” by Andy May” (Poyet, 2021a), the more flak I have gotten has always come from the most ignorant and indoctrinated activists, this must be an example of the Dunning-Kruger effect721. They never read my work, sometimes download it to claim that they read it all in 5 minutes, to declare immidiately that it is all crap and nonsense, when to be honest, most often, they do not have the slightest training or background to understand the simplest notions that are dealt with in this book. They generally lack the most basic scientific training and their unassailable arguments are generally limited to “more CO 2 cause warming, can't you understand that?” coupled with “How could you be alone in being right against such a (put the number you wish, e.g. 97%) consensus?”. Most of the scientists who disagree with me have mainly avoided arguing or simply challenging me, they probably though that they had bigger fishs to fry as Hansen said of Dyson, or that ignoring me was easier than to face a tough opponent who knows perfectly all the weaknesses of a flawed theory.
In the end It’s the battle of the two cultures as first articulated by Snow (1959). As John Parmentola 722 told me “one culture uses facts and logic to understand how the world we live in works. The other imagines other worlds deciding which of them they like at the moment through a made up story”.
The author declares no conflict of interests. For the research I was not given any grant. I received no funding whatsoever. Nor am I a member of any climate committees (political or other) or am I linked to companies or NGOs, financially or otherwise. I am not a member of any political party or movement. This is an independent work that represents only the personal opinion of the author based on the work exposed. The author has been a recent regular member of the association of the climato-realistes.fr/, since October 2020.
721https://en.wikipedia.org/wiki/Dunning%E2%80%93Kruger_effect
722https://johnparmentola.com/
“Indeed, Granpa, tell what life was like before Climate Policies”
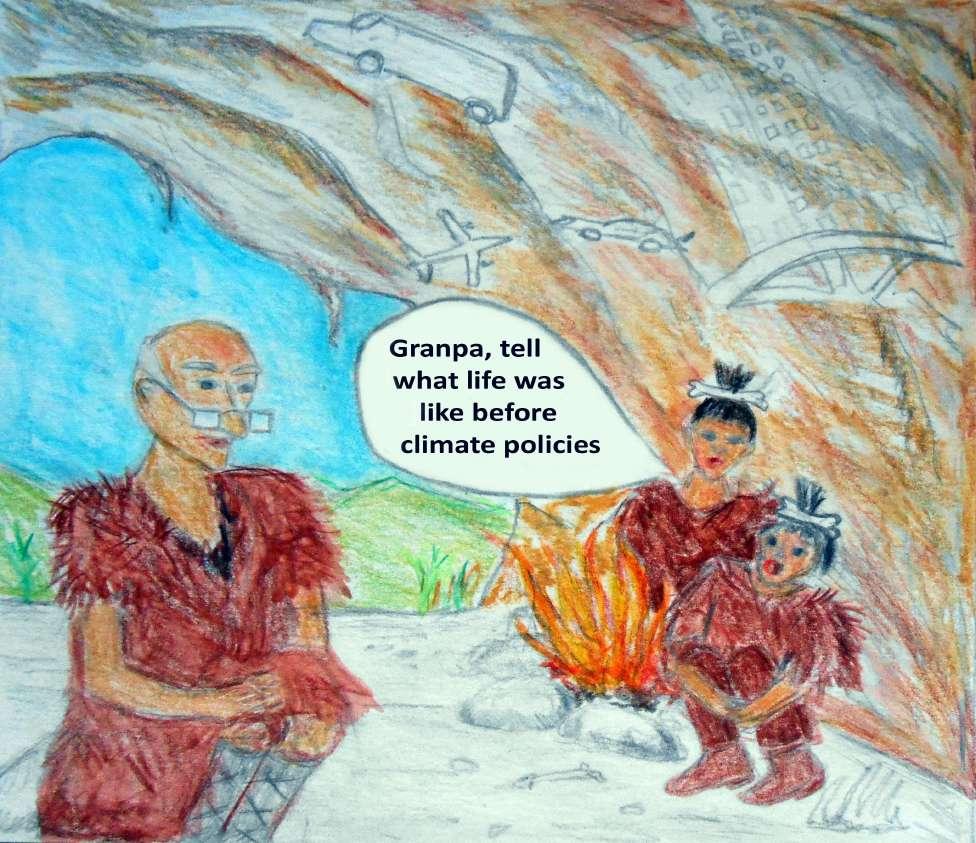
“You see my little ones, as Gervais (2018) reminded us in his excellent book, less than three centuries ago we used to travel on foot, on horseback or on a cariole, in a rowing boat or a sailboat. The land was cultivated with a plough pulled by a domestic animal and the goods were transported in galleons or oxcarts. Even the richest castles were loosely heated with wood, and at nightfall, people tried to work in a fleeting and fickle candlelight. Laundry kept the women busy at the wash-house and the economy was largely local and self-sufficient. Energy was provided by wood burning, draught animals, wind and river currents. Then came the industrial revolution, fossil fuels, nuclear power and globalization. In 2019, before the Covid virus appeared in the Wuhan Province (Relman, 2020; Rogin, 2021; Harrison and Sachs, 2022), the world had changed more in 100 years than in 2 million years of human adventure. Then the GRUNZIs723 imposed a global zero-carbon emissions project, had delusional ideas like a social cost of carbon by demonizing carbon dioxide as a pollutant when it had only advantages and a considerable private benefit of more than $400 per ton (Tol, 2017), and soon enough, due to climate policies and the ecological transition, electricity had started to be in short supply with outages in winter when we needed it the most (Worrall, 2019; Four, 2021), then a massive recession ensued and led to social disorders such that survivors like us of this Malthusian project ended up in the Stone Age. The problem is that as the climate has naturally changed and become colder, most of the few economic survivors have frozen to death, whereas IPCC's RCP 8.5 had forecast a warming of up to 5°C. But we should congratulate ourselves on having a smaller carbon footprint.” - Grandpa to his seldom grand-children, 2100.
723The obvious disdain for the fundamental civil rights and freedoms of the citizens, democracy and the parliamentary system expressed by many climate and green activists and alas even a number of climate scientists is also clear in the German “Changing World, Social Contract for a Great Transformation” (WBGU, 2011) and thus can be considered as a modern form of “Die Grünen sozialismus”, i.e. GRUNZI.
Aamaas, B., Peters, G. P., and Fuglestvedt, J. S., 2012. A synthesis of climate-based emission metrics with applications. Earth System Dynamics Discussions, Vol. 3, Issue 2, p. 871–934, doi:10.5194/esdd-3-871-2012
AAAS, 2021. Earth’s Magnetic Field Reversal 42,000 Years Ago Triggered a Global Environmental Crisis. February 19, 2021, American Association For The Advancement Of Science, https://scitechdaily.com/earths-magnetic-field-reversal-42000-years-agotriggered-a-global-environmental-crisis/, accessed and archived on February 21, 2021.
AAS, 2015. The science of climate change: Questions and answers. Australian Academy of Science, Canberra, www.science.org.au/climatechange, https://www.science.org.au/files/userfiles/learning/documents/climate-change-r.pdf, accessed and archived on November 17, 2020.
Abbe, C., 1901.The physical basis of long-range weather forecasts. Monthly Weather Review, Vol. 29, Issue 12, p. 551-561, https://doi.org/10.1175/1520-0493(1901)29[551c:TPBOLW]2.0.CO;2
Abbot, C. G., 1918. Terrestrial Temperature and Atmospheric Absorption. Proc. of the Natl. Acad. of Sci. of the U.S.A., Vol. 4, no. 4, p. 104–106, doi: 10.1073/pnas.4.4.104
Abbot, J., and Marohasy, J., 2017. The application of machine learning for evaluating anthropogenic versus natural climate change. GeoResJ, Vol. 14, p. 36-46, DOI: 10.1016/j.grj.2017.08.001
Abdussamatov, H., 2020. Energy Imbalance Between the Earth and Space Controls the Climate. Earth Sciences, Vol. 9, n°4, p. 117125, DOI: 10.11648/j.earth.20200904.11
Abram, N., J.-P. Gattuso, A. Prakash, L. Cheng, M.P. Chidichimo, et al., 2019. Framing and Context of the Report Supplementary Material. In: IPCC Special Report on the Ocean and Cryosphere in a Changing Climate [H.-O. Pörtner, et al. (eds.)], 11 pp., https://www.ipcc.ch/site/assets/uploads/sites/3/2019/11/SROCC_Ch01-SM_FINAL.pdf, accessed and archived on September 9, 2022.
Abreu, J. A., Beer, J., Ferriz-Mas, A., McCracken, K. G., and Steinhilber, F., 2012. Is there a planetary influence on solar activity? Astronomy & Astrophysics, Vol. 548, Article A88, 9 pp., https://doi.org/10.1051/0004-6361/201219997
Acker, T. L., Buja, L. E., Rosinski, J. M., & Truesdale, J. E., 1996. User's Guide to NCAR CCM3 (No. NCAR/TN-421+IA). University Corporation for Atmospheric Research. doi:10.5065/D6K64G11
Adams, W. S., and Dunham, T., 1932. Carbon Dioxide Discovered in Atmosphere of Venus. Astronautics, Vol. 2, N°21, p.6-7, https://doi.org/10.2514/8.11921
Adem, J., and Garduño, R., 1998. Feedback effects of atmospheric CO2-induced warming. Geofísica Internacional, Vol. 37, n°2, pp. 5570, https://www.redalyc.org/pdf/568/56837201.pdf
Aeschbach-Hertig, W., Hofer, M., Kipfer, R., Imboden, D. M., and Wieler, R., 1999. Accumulation of mantle gases in a permanently stratified volcanic lake (Lac Pavin, France). Geochimica and Cosmochimica Acta, Vol. 63, Issue 19-20, p. 3357-3372, https://doi.org/10.1016/S0016-7037(99)00257-4
AGARD, 1993. Non Linear Dynamics and Chaos, AGARD (Advisory Group for Aerospace Research and Development) Lecture Series 191, NATO, 93-19829, Printed by Specialised Printng Services Limited 40 Chigweil Lane, Loughton, Essex IGIO 3TZ, ISBN 92S35-0714-2
Akasofu, S.-I., 2010. On the recovery from the Little Ice Age. Natural Science, Vol. 2, No. 11, p. 1211-1224, DOI: 10.4236/ns.2010.211149
Akasofu, S.-I., 2011. A Suggestion to Climate Scientists and the Intergovernmental Panel on Climate Change. EOS, Vol. 89, Issue 11, p. 108-108, https://doi.org/10.1029/2008EO110005
Akasofu, S.-I., 2013. On the Present Halting of Global Warming. Climate, Vol. 1, Issue 1, p. 4-11, https://doi.org/10.3390/cli1010004
Alekseev, G., Glok, N., and Smirnov, A., 2015. On assessment of the relationship between changes of sea ice extent and climate in the Arctic. International Journal of Climatology, Vol. 36, Issue 9, p. 3407-3412, https://doi.org/10.1002/joc.4550
Allen, M. R., Tett S. F. B., 1999. Checking for model consistency in optimal fingerprinting. Climate Dynamics, Vol. 15, p.419–434, https://doi.org/10.1007/s003820050291
Allègre, C. J., and Michard, G., 1973. Introduction à la géochimie. Presses universitaires de France, 220 pp.
Allègre, C. J., and Michard, G., 1974. Introduction to Geochemistry. Geophysics and Astrophysics Monographs, Series Volume 10, D. Reidel Publishing Company, Dordrecht, Springer Netherlands, Softcover ISBN 978-90-277-0498-6, 143 pp., DOI:10.1007/97894-010-2261-3
Allègre, C., 2010. L’imposture climatique ou la fausse écologie - Conversations avec Dominique de Montvalon. Plon, www.plon.fr, ISBN : 978-2-259-20985-4, 295 pp.
Allemand, D., et al., 2004. Biomineralisation in reef-building corals: from molecular mechanisms to environmental control. C. R. Palevol, General Palaeontology (Palaeobiochemistry), n°3, p. 453-467.
Allen, J. R. M., Long, A. J., Ottley, C.J., Pearson, D.G., and Huntley, B., 2007. Holocene climate variability in northernmost Europe. Quaternary Science Reviews, Vol. 26, n°9, p.1432-1453, DOI: 10.1016/j.quascirev.2007.02.009
Allen, M., 2003. Liability for climate change, Will it ever be possible to sue anyone for damaging the climate? Nature, Vol. 421, Issue 6926, p. 891–892, DOI: 10.1038/421891a
Allen, M. B., and Armstrong, H. A., 2008. Arabia-Eurasia collision and the forcing of mid-Cenozoic global cooling. Palaeogeography, palaeoclimatology, palaeoecology, Vol. 265, Issues 1-2, pp. 52-58, DOI: 10.1016/j.palaeo.2008.04.02
Alexander, M. A., and Penland, C., 1996. Variability in a Mixed Layer Ocean Model Driven by Stochastic Atmospheric Forcing. Journal of Climate, Vol. 9, Issue 10, p. 2424-2442, DOI: 10.1175/1520-0442(1996)009<2424:VIAMLO>2.0.CO;2
Alley, R. B., Mayewski, P. A., Sower, T., Stuiver, M., Taylor, K.C., and Clark, P.U., 1997. Holocene climate instability: a prominent, widespread event 8,200 yrs ago. Geology, Vol. 25, n°6, p. 483-486, https://doi.org/10.1130/00917613(1997)025<0483:HCIAPW>2.3.CO;2
Alley, R. B., 2000a. Ice-core evidence of abrupt climate changes. Proc. of the Natl. Acad. of Sci. of the U.S.A., Vol. 97, no. 4, p. 13311334, DOI: 10.1073/pnas.97.4.1331
Alley, R. B., 2000b. The Younger Dryas cold interval as viewed from central Greenland. Journal of Quaternary Science Reviews, Vol.19, Issues 1-5, p. 213-226, https://doi.org/10.1016/S0277-3791(99)00062-1
Alley, R. B., et al., 2003. Abrupt climate change. Science, Vol. 299, Issue 5615, p. 2005-2010, DOI:10.1126/science.1081056
Alley, R. B., K. A. Emanuel and Zhang, F., 2019. Advances in weather prediction. Science, Vol. 363, Issue 6425, p. 342-344, DOI: 10.1126/science.aav7274
Alligood, K. T. , Sauer, T. D. , and Yorke, J. A., 1997. Chaos, an introduction to dynamical systems. Springer-Verlag, ISBN 0-387-946772, 603 pp.
Aloïsi, J.-C., Monaco, M., Planchais, N., Thommeret, J., and Thommeret, Y., 1978. The Holocene transgression in the Golfe du Lion, southwestern France: Paleogeographic and paleobotanical evolution. Géographie physique et Quaternaire, Vol. 32, n°2, DOI: https://doi.org/10.7202/1000346ar
Ambrose, S. H., 1998. Late Pleistocene Human Population Bottlenecks, Volcanic Winter, and Differentiation of Modern Humans. Journal of Human Evolution, Vol. 34, n°6, p. 623-651, DOI: 10.1006/jhev.1998.0219
Ambrose, S. H., 2003. Did the super-eruption of Toba cause a human population bottleneck? Journal of Human Evolution, Vol. 45, n°3, p. 231-237, DOI: 10.1016/j.jhevol.2003.08.001
Amos, A. M., 2016. Bat Killings by Wind Energy Turbines Continue. Scientific American, https://www.scientificamerican.com/article/bat-killings-by-wind-energy-turbines-continue/, accessed and archived on November 17, 2020
Anagnostopoulos, G. G., Koutsoyiannis, D., Christofides, A., Efstratiadis, A. & Mamassis, N., 2010. A comparison of local and aggregated climate model outputs with observed data Hydrological Sciences Journal, Vol. 55, n° 7, p. 1094–1110, https://doi.org/10.1080/02626667.2010.513518
Andersen, C., Koç, N., and Moros, M, 2004. A highly unstable Holocene climate in the subpolar North Atlantic: evidence from diatoms. Quaternary Science Reviews, Vol. 23, p. 2155–2166, DOI: 10.1016/j.quascirev.2004.08.004
Anderson, R. F., et al., 2009. Wind-Driven Upwelling in the Southern Ocean and the Deglacial Rise in Atmospheric CO 2 Science, Vol.323, p. 1443-1448, DOI: 10.1126/science.1167441
Anderson, R. F., et al., 2019. Deep-sea oxygen depletion and ocean carbon sequestration during the last ice age. Global Biogeochemical Cycles, Vol. 33, n°3, p. 301–317, https://doi.org/10.1029/2018GB006049, https://openresearchrepository.anu.edu.au/bitstream/1885/196693/2/01_Anderson_Deep-Sea_Oxygen_Depletion_and_2019.pdf
Anderson, T. R., Hawkins, Ed, and Jones, P. D., 2016. CO2, the greenhouse effect and global warming: from the pioneering work of Arrhenius and Callendar to today's Earth System Models. Endeavour, Vol. 40, No.3, p. 178-187, https://doi.org/10.1016/j.endeavour.2016.07.002
Andresen, C. S., Sha, L., Seidenkrantz, M.-S., Dyke, M. L., and Jiang, H., 2022. Early Holocene palaeoceanographic and glaciological changes in southeast Greenland. The Holocene, Vol. 32, Issue 6, p. 501-514, https://doi.org/10.1177/09596836221080758 Andrew, 2014. 1350+ Peer-Reviewed Papers Supporting Skeptic Arguments Against ACC/AGW Alarmism. Popular Technology.net, February 12th, 2014, http://www.populartechnology.net/2009/10/peer-reviewed-papers-supporting.html, accessed and archived on November 17, 2020
Andrew, S., and Ahmed, S., 2019. New York City declares a climate emergency, the first US city with more than a million residents to do so. CNN, 27th June 2019, https://edition.cnn.com/2019/06/27/us/new-york-city-declared-climate-emergencytrnd/index.html , accessed and archived on November 25, 2020.
Andrews, D. G., 2010. An introduction to ATMOSPHERIC PHYSICS, Second Edition, Cambridge University Press, ISBN-13 978-0-52187220-1, 237 pp, https://dl.icdst.org/pdfs/files1/4a12b8f80ceb22105a190e71d78bed02.pdf, accessed and archived on August 4, 2022.
Andrews, R., 2018. The end of the Little Ice Age. Energy Matters- Energy, Environment and Policy, December 20 th, 2018, https://euanmearns.com/the-end-of-the-little-ice-age/, accessed and archived on November 25, 2020. Ångström K., 1900. Ueber die Bedeutung des Wasserdampfes und der Kohlensäure bei der Absorption der Erdatmosphäre. Annalen der Physik IV, Vol. 308, Issue 12, p. 720-732, http://www.realclimate.org/images/Angstrom.pdf, https://doi.org/10.1002/andp.19003081208
Antoniades, D., et al., 2018. The timing and widespread effects of the largest Holocene volcanic eruption in Antarctica. Scientific Reports, Vol. 8, 17279, https://doi.org/10.1038/s41598-018-35460-x
Ao, H., et al., 2020. Two-stage mid-Brunhes climate transition and mid-Pleistocene human diversification. Earth-Science Reviews, Vol.210, 103354, 19 pp., https://doi.org/10.1016/j.earscirev.2020.103354
AP, 1989. Noel Brown Statement. the Associated Press (AP), June 29, 1989, https://apnews.com/article/bd45c372caf118ec99964ea547880cd0, accessed and archived on September 2, 2022.
APEGGA, 2002. A reproduction of the 2002 debate solicited by APEGGA Association of Professional Engineers and Geoscientists of Alberta. Friends of Science Society, PEGG (Professional Engineers, Geologists, and Geophysicists of Alberta) Journal and online, https://friendsofscience.org/assets/documents/KyotoAPEGA2002REV1.pdf, accessed and archived on February 2, 2021.
Archer, D., and Ganopolski, A., 2005. A movable trigger: Fossil fuel CO2 and the onset of the next glaciation Geochemistry, Geophysics, Geosystems, Vol. 6, Issue 5, 7 pp., https://doi.org/10.1029/2004GC000891
Archer, D., and Brovkin, V., 2008. The millennial atmospheric lifetime of anthropogenic CO2 Climatic Change, Vol. 90, p. 283–297, doi:10.1007/s10584-008-9413-1
Archer, D., et al., 2009. Atmospheric Lifetime of Fossil Fuel Carbon Dioxide. Annual Review of Earth and Planetary Sciences, Vol. 37, p.117-134, DOI: 10.1146/annurev.earth.031208.100206
Arneborg, J., et al., 1999. Change of diet of the Greenland vikings determined from stable carbon isotope analysis and 14C dating of their bones. Radiocarbon, Vol. 41, n°2, p. 157-168, https://doi.org/10.1017/S0033822200019512, https://journals.uair.arizona.edu/index.php/radiocarbon/article/download/3805/3230
Arnscheidt, C. W., and Rothman, D. H., 2020. Routes to global glaciation. Proceedings of the Royal Society A, Vol. 476, Issue 2239, 13pp., https://doi.org/10.1098/rspa.2020.0303
Arppe, L., 2019. Thriving or surviving? The isotopic record of the Wrangel Island woolly mammoth population. Quaternary Science Reviews, Volume 222, 105884, 15 pp., https://doi.org/10.1016/j.quascirev.2019.105884
Arrhenius, S., 1896. On the influence of carbonic acid in the air upon the temperature of the ground. The London Edinburgh and Dublin Philosophical Magazine and Journal of Science, fifth series, Vol. 41, No. 251, p. 237-276, https://doi.org/10.1080/14786449608620846, https://www.rsc.org/images/Arrhenius1896_tcm18-173546.pdf
Arrhenius, S., 1903. Lehrbuch der kosmischen Physik, 1. t Physik des himmels. Physik der erde. --2 t Physik der atmosphare 2, Leipzig: S. Hirzel, (OCoLC)595057597, 1026 pp.
Artemieva, I. M., 2022. Antarctica ice sheet basal melting enhanced by high mantle heat. Earth-Science Reviews, Vol. 226, Article 103954, 11 pp., https://doi.org/10.1016/j.earscirev.2022.103954
Asikainen, T., Maliniemi, V., and Mursula, K., 2017. Winds of winter: How solar wind driven particle precipitation can affect northern winters. In Proc. 19th EGU General Assembly, EGU2017, 23-28 April, 2017 in Vienna, Austria, Vol.19, p. 12916. Aubouin, J., Brousse, R., and J.-P. Lehman, 1975. Précis de Géologie, 3 tomes, Tome 1: Pétrologie (Brousse). Dunod Université, ISBN 2-04-003588-5, 717 pp.
Augustin, L., et al. 2004. Eight glacial cycles from an Antarctic ice core. Nature, Vol. 429, Issue 6992, p. 623–628, DOI: 10.1038/nature02599
Bacon, F., 1620. Novum Organum or The New Organon or The New Instrument: or True Directions Concerning the Interpretation of Nature, Copyright © Jonathan Bennett 2017, https://www.earlymoderntexts.com/assets/pdfs/bacon1620.pdf, 130pp.
Bader, D. C., Covey, C. C., Gutowski, W. J., Held, I. M. H., Kunkell, K. E., Miller, R. L., Tokmakian, R. T., and Zhang, M. H., 2008. Climate Models An Assessment of Strengths and Limitations. Synthesis and Assessment Product 3.1 Report by the U.S. Climate Change Science Program and the Subcommittee on Global Change Research, https://www.wcrpclimate.org/images/modelling/WGCM/publications/sap3-climate-models.pdf
Badruddin, and Aslam, O. P. M., 2013. Study of the solar wind-magnetosphere coupling on different time scales. Planetary and Space Science, Vol. 85, p. 123-141, https://doi.org/10.1016/j.pss.2013.06.006
Baede, A. P. M., Jarraud, M., and Cubasch, U., 1979. Adiabatic formulation and organization of ECMWF's spectral mode. Technical Report, Shinfield Park, Reading, 40 pp https://www.ecmwf.int/node/7871
Baek, S. H., et al., 2020. A quantitative hydroclimatic context for the European Great Famine of 1315–1317. Communications Earth & Environment, Vol. 1, Article 19, 7 pp., https://doi.org/10.1038/s43247-020-00016-3
Baerwald, E. F., Edworthy, J., Holder, M., and Barclay, R. M. R., 2009. A Large-Scale Mitigation Experiment to Reduce Bat Fatalities at Wind Energy Facilities. The Journal of Wildlife Management, Vol. 73, No. 7, p. 1077-1081, https://www.jstor.org/stable/20616764
Bagla, P., 2009. No sign yet of Himalayan meltdown, Indian report finds. Science, Vol. 326, Issue 5955, p. 924-925, DOI: 10.1126/science.326.5955.924
Bagley, K., 2015. Leaked Email Reveals Who's Who List of Climate Denialists. https://insideclimatenews.org/news/12032015/leakedemail-reveals-whos-who-list-climate-denialists-merchants-of-doubt-oreskes-fred-singer-marc-morano-steve-milloy, accessed and archived on November 17, 2020
Bahcall, J. N., Pinsonneault, M. H., and Basu, S., 2001. Solar models: Current epoch and time dependences, neutrinos, and helioseismological properties. The Astrophysical Journal, Vol. 555, No. 2, p. 990–1012, DOI: 10.1086/321493
Baize , P., 1943. Les Masses des Etoiles et la Relation Empirique Masse-Luminosité. L'Astronomie, Vol. 57, p.101-107.
Baize, P. and Romani, L., 1946. Formules nouvelles pour le calcul des parallaxes dynamiques des couples orbitaux. Annales d’Astrophysique, t. 9, n°s 1-2, p.13-41.
Baize, P., 1947. Les masses des étoiles doubles visuelles et la relation empirique masse-luminosité. Bulletin Astronomique, Vol. 13, p.123-152.
Baker, D.N., 2000. Effects of the Sun on the Earth's environment. Journal of Atmospheric and Solar-Terrestrial Physics, Vol. 62, n°17, p. 1669-1681, https://doi.org/10.1016/S1364-6826(00)00119-X
Bako, L., 2008. Contribution à l’identification de systèmes dynamiques hybrides. Thèse de Doctorat de l’Université des Sciences et Technologies de Lille, Spécialité Automatique et Informatique Industrielle, 21 Novembre, 229 pp, https://tel.archivesouvertes.fr/tel-00360310/document
Baldwin, M. P., et al. 2001. The quasi‐biennial oscillation. Reviews of Geophysics, Vol. 39, Issue 2, Paper number 1999RG000073, p.179-229, https://doi.org/10.1029/1999RG000073
Baliunas, S. L., and Vaughan, A. H., 1985. Stellar Activity Cycles. Annual Review of Astronomy and Astrophysics. Vol. 23, p. 379-412, DOI: 10.1146/annurev.aa.23.090185.002115, http://adsabs.harvard.edu/full/1985ARA%26A..23..379B
Ball, P., 2003. Sun set food prices in the Middle Ages. Nature, News, 22 December, https://www.nature.com/articles/news03121512, https://doi.org/10.1038/news031215-12, accessed and archived on November 17, 2020.
Ball, P., 2014. James Lovelock reflects on Gaia's legacy. Nature, News: Q&A, 9th April, DOI: 10.1038/nature.2014.15017, accessed and archived on November 17, 2020.
Ball, T., 2011. Early Signs of CRU/IPCC Corruption and Cover-up. Heartland Institute, December 6, 2011, https://www.heartland.org/publications-resources/publications/early-signs-of-cruipcc-corruption-and-cover-up, accessed and archived on October 12, 2020.
Ball, T., Siddons, A., Hertzberg, M., Schreuder, H., Olson, J., Hohnson, C., Anderson, C., and O'Sullivan, J., 2011. Slaying the Sky Dragon - Death of the Greenhouse Gas Theory - The Settled Climate Science Revisited. Stairway Press, ISBN 978 1901 546 378, 355pp., http://principia-scientific.org/members/Sky_Dragon_1.pdf
Ball, T., 2016a. John L. Daly: a Giant of Early Climate Skepticism. https://wattsupwiththat.com/2016/07/03/john-l-daly-a-giant-ofearly-climate-skepticism/, accessed and archived on November 17, 2020
Ball, T., 2016b. A Warm Period by Any Other Name – The Climatic Optimum. July 31, 2016, https://wattsupwiththat.com/2016/07/31/a-warm-period-by-any-other-name-the-climatic-optimum/, accessed and archived on December 29, 2020
Ball, T., 2016c. The Club of Rome and beyond: How the socialist religion of environmentalism was born. Fusion 4 Freedom, February 20, 2016, https://fusion4freedom.com/the-club-of-rome-and-beyond-how-the-socialist-religion-of-environmentalism-wasborn/, accessed and archived on July 7, 2022.
Bamber, J. L., Riva, R. E. M., VermeersenBert, B. L. A. Vermeersen, and LeBrocq, A. M., 2009. Reassessment of the Potential Sea-Level Rise from a Collapse of the West Antarctic Ice Sheet Science, Vol. 324, Issue 5929, p. 901903,https://www.science.org/doi/10.1126/science.1169335
Barr, C., et al., 2019. Holocene El Niño–Southern Oscillation variability reflected in subtropical Australian precipitation. Nature, Scientific Reports, Vol. 9, Article n°1627, 9 pp., https://doi.org/10.1038/s41598-019-38626-3
Barberi, F., Innocenti, F., Lirer, L., Munno, R., Pescatore, T. S., and Santacroce, R., 1978. The Campanian Ignimbrite: A major prehistoric eruption in the Neapolitan area (Italy) Bulletin of Volcanology, Vol. 41, n°1, p. 10–22, DOI: 10.1007/BF02597680
Bard, E. and Frank, M., 2006. Climate change and solar variability: What's new under the Sun? Earth and Planetary Science Letters, Vol. 248, p. 1-14, doi:10.1016/j.epsl.2006.06.016
Bard, E., Hamelin, B., and Delanghe-Sabatier, D., 2010. Deglacial Meltwater Pulse 1B and Younger Dryas Sea Levels. Science, Vol. 327, Issue 5970, p. 1235-1237, https://www.science.org/doi/10.1126/science.1180557
Bardinet, J-P., 2015. 22 Very Inconvenient Climate Truths. Online with answers by Camille Veyres, https://wattsupwiththat.com/2015/05/12/22-very-inconvenient-climate-truths/ accessed and archived on November 17, 2020
Barker, A. J., and Ogilvie, G. I., 2010. On internal wave breaking and tidal dissipation near the centre of a solar-type star. Monthly Notices of the Royal Astronomical Society, Vol. 404, p. 1849-1868, doi:10.1111/j.1365-2966.2010.16400.x
Barnes, P., Tabor, D., and Walker, J. C. F., 1971. The friction and creep of polycrystalline ice. Proceedings of the Royal Society A, London, Vol. 324, Issue 1557, p. 127, https://doi.org/10.1098/rspa.1971.0132
Barnett, T. P., Santer, B. D., Jones, P. D., Bradley, R. S., and Briffa, K. R., 1996. Estimates of low frequency natural variability in nearsurface air temperature. The Holocene, Vol. 6, Issue 3, p. 255-263, https://doi.org/10.1177/095968369600600301
Barney, B., and Grossman, E. L., 2022. Reassessment of ocean paleotemperatures during the Late Ordovician. Geology, Vol. 50, Issue 5, p. 572–576, https://doi.org/10.1130/G49422.1
Baroni, C., and Hall, B. L., 2004. A new Holocene relative sea-level curve for Terra Nova Bay, Victoria Land, Antarctica, Journal of Quaternary Science, Vol. 19, Issue 4, p. 377-396, https://doi.org/10.1002/jqs.825
Barott, K. L., 2015. Coral host cells acidify symbiotic algal microenvironment to promote photosynthesis. Proc. of the Natl. Acad. of Sci. of the U.S.A., Vol. 112, n°2, p. 607-612, www.pnas.org/cgi/doi/10.1073/pnas.1413483112
Barry, J. C., et al., 2002. Faunal and environmental change in the late Miocene Siwaliks of northern Pakistan. Paleobiology, Vol. 28, p. 1-71, DOI: 10.1666/0094-8373(2002)28[1:FAECIT]2.0.CO;2
Barry, J. P., et al., 2010. Atmospheric CO2 targets for ocean acidification perturbation experiments. in: Guide to best practices for ocean acidification research and data reporting, Edited by U. Riebesell, V. J. Fabry, L. Hansson and J.-P. Gattuso. 2010, Luxembourg: Publications Office of the European Union, p. 53-66.
Bastasch, M., 2014. UN climate chief : Communism is the best to fight global warming. The Daily Caller, January 16, https://climatism.blog/2014/01/16/un-climate-chief-says-communism-is-best-to-fight-global-warming/ https://www.thegwpf.com/climate-chief-communism-fight-global-warming/, accessed and archived on November 17, 2020 Bastin, G., 2013. Modélisation et analyse des systèmes dynamiques, 14 Juillet 2013, 216 pp., https://perso.uclouvain.be/georges.bastin/sysdyn.pdf
Bates, N. R., et al., 2014. A time-series view of changing ocean chemistry due to ocean uptake of anthropogenic CO 2 and ocean acidification. Oceanography, Vol. 27, Issue 1, p. 126–141, http://dx.doi.org/10.5670/oceanog.2014.16
Bates, J., 2017. Climate scientists versus climate data. Climate Etc., February 4 th, 2017, https://judithcurry.com/2017/02/04/climatescientists-versus-climate-data/, accessed and archived on November 17, 2020.
Bath, L., J. Rosinski, and J. Olson, 1992: User's Guide to NCAR CCM2. NCAR Tech. Note, NCAR/TN-379+IA, National Center for Atmospheric Research, Boulder, CO, NTIS PB93-135861, 156 pp, http://dx.doi.org/10.5065/D6BP00RS
Battle, M., et al., 2000. Global Carbon Sinks and Their Variability Inferred from Atmospheric O 2 and δ13C. Science, Vol.287, Issue 5462, p. 2467-2470, DOI: 10.1126/science.287.5462.2467
Bazilian, M., Denny, E., and O'Malley, M., 2004. Challenges of Increased Wind Energy Penetration in Ireland. Wind Engineering, Vol.28, p. 43-55, https://doi.org/10.1260/0309524041210883
BBC, 2018. Pompeii: Vesuvius eruption may have been later than thought. Bbc, October 16, 2018, https://www.bbc.com/news/world-europe-45874858, accessed and archived on November 17, 2020.
Beaulant, A.-L., et al., 2009. Statistico-dynamical downscaling for Mediterranean heavy precipitation. Quarterly Journal of the Royal Meteorological Society, Vol. 137, p.736-748, DOI:10.1002/qj.796
Beaulieu, E., Goddéris, Y., Donnadieu, Y., Labat, D., and Roelandt, C., 2012. High sensitivity of the continental-weathering carbon dioxide sink to future climate change. Nature Climate Change, Vol. 2, p. 346-349, DOI: 10.1038/NCLIMATE1419
Beauzamy, B., et al., 2015a. The battle against global warming: an absurd, costly and pointless crusade. Société de Calcul Mathématique [Mathematical Modelling Company, Corp.], http://www.scmsa.eu/archives/SCM_RC_2015_08_24_EN.pdf, accessed and archived on November 27, 2020.
Beauzamy, B., et al., 2015b. Second Volume: Global Warming and Employment. Société de Calcul Mathématique [Mathematical Modelling Company, Corp.], http://www.scmsa.eu/archives/SCM_LBRCV2_2015_12_EN.pdf, accessed and archived on November 27, 2020.
Beck, E.-G., 2006. 180 years accurate CO2 air gas analysis by chemical methods (short version). Merian-Schule Freiburg, August, 36 pp., https://kin152.gadz.org/climatologie/CO2.pdf, accessed and archived on January 25, 2021.
Beck, E.-G., 2007. 180 Years of Atmospheric CO2 Gas Analysis by Chemical Methods. Energy & Environment, Vol. 18, n°2, p. 259-282, http://www.geocraft.com/WVFossils/Reference_Docs/180_yrs_Atmos_CO2_Analysis_by_chemical_methods_Beck_2007.pdf
Beck, E.-G., 2008. The Historical Data the IPCC Ignored: 180 Years of Atmospheric CO 2 Gas Analysis by Chemical Methods. 21st Century Science & Technology, p. 41-52, https://21sci-tech.com/Subscriptions/Spring%202008%20ONLINE/CO2_chemical.pdf
Beck, E.-G., 2022724. Reconstruction of Atmospheric CO2 Background Levels since 1826 from Direct Measurements near Ground. Science of Climate Change, International Journal of Science and Philosophy, ISSN 2703-9080 (print), ISSN 2703-9072 (online), 35 pp., https://scc.klimarealistene.com/ Beenstock, M., Reingewertz, Y., and Paldor, N., 2012. Polynomial cointegration tests of anthropogenic impact on global warming. Earth System Dynamics, Vol. 3, p. 173–188, DOI: 10.5194/esd-3-173-2012
Beer, C., et al., 2010. Terrestrial gross carbon dioxide uptake: Global distribution and covariation with climate. Science, Vol. 329, Issue 5993, p. 834-838, DOI: 10.1126/science.1184984
Beer, J. et al., 1988. Information on past solar activity and geomagnetism from 10Be in the Camp Century ice core. Nature, Vol. 331, Issue 6158, p. 675–679, DOI: 10.1038/331675a0
Beer, J., Mende, W., Stellmacher, R., 2000. The role of the Sun in climate forcing. Quaternary Science Review, Vol. 19, Issues 1-5, p.403–415, https://doi.org/10.1016/S0277-3791(99)00072-4
Beer, J., Muscheler, R., Wagner, G., Laj, C., Kissel, C., Kubik, P.W., and Synal, H.-A., 2002. Cosmogenic nuclides during isotope stages 2 and 3. Quaternary Science Reviews, Vol. 21, p. 1129-1139.
Beer, J., Vonmos, M., and Muscheler, R., 2006. Solar Variability Over the Past Several Millennia. Space Science Reviews, Vol. 125, p.67-79, DOI: 10.1007/s11214-006-9047-4
Bell, L., 2011a. Political Science Lessons From The U.N.'s IPCC. Forbes, September 2nd, 2011, https://www.forbes.com/sites/larrybell/2011/02/09/political-science-lessons-from-the-u-n-s-ipcc/, accessed and archived on October 24, 2020.
Bell, L., 2011b. NASA's Inconvenient Ruse: The Goddard Institute For Space Studies. Forbes, July 19, 2011, https://www.forbes.com/sites/larrybell/2011/07/19/nasas-inconvenient-ruse-the-goddard-institute-for-spacestudies/#a01bfb769632, accessed and archived on August 14, 2020.
Bell, L., 2013. In Their Own Words: Climate Alarmists Debunk Their 'Science'. Forbes, February 5, 2013. https://www.forbes.com/sites/larrybell/2013/02/05/in-their-own-words-climate-alarmists-debunk-their-science/? sh=1433afe368a3, accessed and archived on December 17, 2020.
Bélouve, J.-M., 2010. Pétition contre Allègre et Courtillot : des climatologues français perdent tout sens de la mesure. April 2, 2010, https://www.agoravox.fr/actualites/environnement/article/petition-contre-allegre-et-72725, accessed and archived on February 10, 2021.
Belt, S. T., et al., 2010. Striking similarities in temporal changes to spring sea ice occurrence across the central Canadian Arctic Archipelago over the last 7000 years. Quaternary Science Reviews, Vol. 29, Issue 25, p. 3489-3504, DOI: 10.1016/j.quascirev.2010.06.041
Belt, S. T., and Müller, J., 2013. The Arctic sea ice biomarker IP25: a review of current understanding, recommendations for future research and applications in palaeo sea ice reconstructions, Quaternary Science Reviews, Vol. 79, p. 9-25, http://dx.doi.org/10.1016/j.quascirev.2012.12.001
Ben-Yaakov, S., and Kaplan, I. r., 1968. pH-Temperature Profiles in Ocean and Lakes using an in Situ Probe. Limnology and Oceanography, Vol. 13, n°4, p. 688-693.
Berberan-Santos, B., Bodunov, E. N. , Pogliani, L., 2010. On the barometric formula inside the Earth. Journal of Mathematical Chemistry, Vol. 47, Issue 3, p. 990-1004, DOI:10.1007/S10910-009-9620-7
Bereiter, B., et al., 2012. Mode change of millennial CO2 variability during the last glacial cycle associated with a bipolar marine carbon seesaw. Proc. of the Natl. Acad. of Sci. of the U.S.A., Vol. 109, Issue 25, p. 9755-9760, https://doi.org/10.1073/pnas.1204069109
724Post mortem memorial edition, original version submitted February 2010, accepted 30th May 2022, with the support of Prof. Dr. Harald Yndestad, Prof. Dr. Ole Humlum and Prof. Jan-Erik Solheim
Bereiter, B. , et al., 2015. Revision of the EPICA Dome C CO2 record from 800 to 600 kyr before present. Geophysical Research Letters, Vol. 42, n°2, p. 542-549, DOI: 10.1002/2014GL061957
Berger, A., and Loutre, M. F., 1991. Insolation values for the climate of the last 10 million years. Quaternary Science Reviews, Vol. 10, Issue 4, p. 297-317, https://doi.org/10.1016/0277-3791(91)90033-Q
Berger, A., and Loutre, M. F., 2002. An Exceptionally Long Interglacial Ahead? Science, Vol. 297, Issue 5585, p. 1287-1288, DOI: 10.1126/science.1076120
Berk, A., Conforti, P., Kennett, R., et al., 2014. MODTRAN6: a major upgrade of the MODTRAN radiative transfer code. Proc. SPIE 9088, Algorithms and Technologies for Multispectral, Hyperspectral, and Ultraspectral Imagery XX, 90880H, June 13, doi:10.1117/12.2050433.
Berk, A., Conforti, P., and Hawes, F., 2015. An accelerated line-by-line option for MODTRAN combining on-the-fly generation of line center absorption with 0.1 cm bins and pre-computed line tails. Proc. SPIE 9471, Algorithms and Technologies for Multispectral, Hyperspectral, and Ultraspectral Imagery XXI, 947217, May 21, doi:10.1117/12.2177444
Berkaloff, A., Bourguet, J., Favard, P., and Guinnebault, M, 1976. Biologie et Physiologie Cellulaire. Septième tirage, ISBN 2 7056 5561 1, Hermann, © Paris 1967, 322 pp.
Berner, W., Oeschger, H., and Stauffer, B., 1980. Information on the CO2 cycle from ice core studies. Radiocarbon, Vol.22, n°2, p. 227235.
Berner, R. A., 1997. The Rise of Plants and Their Effect on Weathering and Atmospheric CO 2 Science, Vol. 276, Issue 5312, p. 544–546, DOI: 10.1126/science.276.5312.544
Berner, R. A., and Kothavala, Z., 2001. GEOCARB III: A revised model of atmospheric CO 2 over Phanerozoic time. American Journal of Science, Vol. 301, p. 182–204, DOI: 10.2475/ajs.301.2.182
Berner, R. A., 2004. The Phanerozoic Carbon Cycle: CO2 and O2. Oxford University Press. ISBN-13: 978-0195173338, 158pp.
Berner, R. A., 2006. GEOCARBSULF: A combined model for Phanerozoic atmospheric O 2 and CO2. Geochimica et Cosmochimica Acta, Vol. 70, Issue 23, p. 5653–5664, https://doi.org/10.1016/j.gca.2005.11.032
Berner, E. K., and Berner, R. A., 2012. Global Environment: Water, Air, and Geochemical Cycles. Princeton University Press, ISBN: 9780691136783, 464 pp.
Berner, R. A., 2012. Jacques-Joseph Ébelmen, the founder of earth system science. Comptes Rendus Geosciences, Vol. 344 (s 11–12), p. 544–548, DOI: 10.1016/j.crte.2012.08.001
Bernichi, L., 2007. Des dizaines de morts dans la région de Khénifra à cause du froid. MarocHebdo, January 12, 2007, https://www.maghress.com/fr/marochebdo/72715 accessed and archived on October 16, 2020.
Berthier, E., Schiefer, E., Clarke, G. K. C., Menounos, B., and Rémy, F., 2010. Contribution of Alaskan glaciers to sea-level rise derived from satellite imagery. Nature Geoscience, Vol. 3, Issue 2, p. 92–95, DOI: 10.1038/ngeo737
Bertrand, C., and van Ypersele, J.-P., 1999. Potential role of solar variability as an agent for climate change. Climatic Change, Vol. 43, p. 387–411, http://www.climate.be/users/vanyp/ArticlesScientifiquesMagazines/UCL-ASTR_257_257.pdf
Berry, E. X., 1974. Comments on "The greenhouse Effect". Journal of Applied Meteorology, Vol. 13, n°5, p. 603-604, DOI: 10.1175/1520-0450(1974)013<0603:COGE>2.0.CO;2
Berry, E. X., 2019. Human CO2 Emissions Have Little Effect on Atmospheric CO2. International Journal of Atmospheric and Oceanic Sciences, Vol. 3, No. 1, p. 13-26. DOI: 10.11648/j.ijaos.20190301.13
Berry, E. X., 2021. The impact of human CO2 on atmospheric CO2. Science of Climate Change, International Journal of Science and Philosophy, Vol. 1, n°2, pp. N3 1-46, https://doi.org/10.53234/scc202112/212
Beslu, P., 2018. Temps de résidence du gaz carbonique dans l'atmosphère, 19 pp., https://s302ca8b5be4c8f20.jimcontent.com/download/version/1442863146/module/10113499295/name/DureedevieCO2d rop.pdf
Bialik, Or M., Frank, M., Betzler, C., Zammit, R., and Waldmann, N. D., 2019. Two-step closure of the Miocene Indian Ocean Gateway to the Mediterranean. Scientific Reports, 9 (8842), 10 pp., https://doi.org/10.1038/s41598-019-45308-7
Bianciardi, G., Miller, J. D., Straat, P.A., and Levin, G. V., 2012. Complexity Analysis of the Viking Labeled Release Experiments. International Journal of Aeronautical and Space Sciences, Vol. 13, Issue 1, p. 14-26, https://doi.org/10.5139/IJASS.2012.13.1.14
Bianchi, G. G., and Mccave, I. N., 1999. Holocene periodicity in North Atlantic climate and deep-ocean flow south of Iceland. Nature, Vol. 397, Issue 6719, p. 515-517, DOI: 10.1038/17362
Bianchi, F., et al., 2016. New particle formation in the free troposphere: A question of chemistry and timing. Science, Vol. 352, Issue 6289, pp. 1109-1112, DOI: 10.1126/science.aad5456
Biondi, F., Gershunov, A., Cayan, D. R., 2001. North Pacific Decadal Climate Variability since 1661. Journal of Climate, Vol. 14, p. 5–10, DOI: 10.1175/1520-0442(2001)014<0005:NPDCVS>2.0.CO;2
Birch, L., Cronin, T., and Tziperman, E., 2017a. Glacial Inception on Baffin Island: The Role of Insolation, Meteorology, and Topography. Journal of Climate, Vol. 30, n°11, p. 4047-4064, https://doi.org/10.1175/JCLI-D-16-0576.1
Birch, L., Cronin, T., and Tziperman, E., 2017b. The role of regional feedbacks in glacial inception on Baffin Island: The interaction of ice flow and meteorology. Climate of the Past, Vol. 14, n°10, p. 1441-1462, DOI: 10.5194/cp-14-1441-2018
Bjerknes, V., 1904. Das Problem der Wettervorhersage, betrachtet vom Standpunkte der Mechanik und der Physik. –Meteorologische Zeitschrift, Vol. 21, p. 1–7. , [The problem of weather prediction, considered from the viewpoints of mechanics and physics] translated and edited by Volken E. and S. Brönnimann, Meteorologische Zeitschrift, Vol. 18, No. 6, 663-667, https://math.nyu.edu/~gerber/courses/2018-fruhling/bjerknes-physical_basis_NWP-MeteoZ-1904-english.pdf
Black, T., 2020. The climate emergency is a threat to democracy. Spiked, January 24, 2020, https://www.spikedonline.com/2020/01/24/the-climate-emergency-is-a-threat-to-democracy/ , accessed and archived November 25, 2020.
Blackmon, M., et al., 2001. The Community Climate System Model. Bulletin of the American Meteorological Society, Vol. 82, No. 11, p. 2357-2376, DOI: 10.1175/1520-0477(2001)082<2357:TCCSM>2.3.CO;2
Blanchon, P., Eisenhauer, A., Fietzke, J., and Liebetrau, V., 2009. Rapid sea-level rise and reef back-stepping at the close of the last interglacial highstand. Nature, Vol. 458, doi:10.1038/nature07933
Blanchon, P., 2011. Meltwater Pulses. In: Hopley, D. (Ed), Encyclopedia of Modern Coral Reefs: Structure, form and process, SpringerVerlag Earth Science Series, p. 683-690, DOI 10.1007/978-90-481-2639-2
Block, K., and Mauritsen, T., 2013. Forcing and feedback in the MPI-ESM-LR coupled model under abruptly quadrupled CO2. Journal of Advances in Modeling Earth Systems, Vol. 5, p. 1-16, DOI: 10.1002/jame.20041
Block, K., Schneider, F. A., Mülmenstädt, J., Salzmann, M., Quaas, J., 2019. Climate models disagree on the sign of total radiative feedback in the Arctic. Tellus A: Dynamic Meteorology and Oceanography, Vol. 72, n°1, p. 1-14, DOI: 10.1080/16000870.2019.1696139
Blunier, T., and Brook, E. J., 2001. Timing of millennial-scale climate change in Antarctica and Greenland during the last glacial period, Science, Vol. 291, Issue 5501, p. 109-112, DOI: 10.1126/science.291.5501.109
Boas, I., et al., 2019. Climate migration myths. Nature Climate Change, Vol. 9, p. 901–903, https://doi.org/10.1038/s41558-019-06333
Bohleber, P., Schwikowski, M., Stocker-Waldhuber, M., Fang, L., and Fischer, A., 2020. New glacier evidence for ice-free summits during the life of the Tyrolean Iceman. Scientific Reports, Vol. 10, Article 20513, 10 pp., https://doi.org/10.1038/s41598-02077518-9
Boisséson de, E., 2017. Ocean component of CERA-20C: heat content, fluxes and sea-ice. ERA-CLIM2 General Assembly, Universität Wien 16-18 January, https://www.ecmwf.int/sites/default/files/elibrary/2017/16991-cera-20c-climate-indices-ocean-andflux.pdf, accessed and archived February 27, 2021.
Boltzmann, L., 1884. Ableitung des Stefan'schen Gesetzes, betreffend die Abhängigkeit der Wärmestrahlung von der Temperatur aus der electromagnetischen Lichttheorie, [Derivation of Stefan's law, concerning the dependency of heat radiation on temperature, from the electromagnetic theory of light]. Annalen der Physik, Vol. 258, Issue 6, p. 291–294, doi:10.1002/andp.18842580616.
Bond, G., et al., 1992. Evidence for massive discharges of icebergs into the North-Atlantic ocean during the Last Glacial Period. Nature, Vol. 360, Issue 6401, p. 245-249, DOI: 10.1038/360245a0
Bond, G., Kromer, B., Beer, J., Muscheler, R., Evans, M., Showers, W., hoffmann, S., Lotti-Bond, R., Hajdas, I., and Bonani, G., 2001. Persistent Solar Influence on North Atlantic Climate During the Holocene. Science, Vol. 294, Issue 5549, p. 2130-2136, DOI: 10.1126/science.1065680
Bonhommet, N., Zähringer, J., 1969. Paleomagnetism and potassium argon age determinations of the Laschamp geomagnetic polarity event. Earth and Planetary Science Letters, Vol. 6, Issue 1, p. 43-46, DOI: 10.1016/0012-821X(69)90159-9
Bopp, L., Le Quéré, C., Heimann, M., and Manning, A. C., 2002. Climate-induced oceanic oxygen fluxes: Implications for the contemporary carbon budget. Global Biogeochemical Cycles, Vol. 16, n°2, 1022, 14 pp., DOI: 10.1029/2001GB001445
Bopp, L., and Le Quéré, C., 2009. Ocean Carbon Cycle. In Surface Ocean Lower Atmosphere Processes, C. Quéré and E. Saltzman (Eds), AGU Geophysical Monographs, Washington, D.C., US., p. 319-329.
Borenstein, S., 2008. NASA scientist: 'We're toast'. The Argus-Press-June 24, 2008, https://www.thegwpf.com/nasa-scientist-weretoast/, accessed November, 2020.
Born, A., Kageyama, M., and Nisancioglu, K. H., 2010. Warm Nordic Seas delayed glacial inception in Scandinavia. Climate of the Past, Vol. 6, n°6, p. 817-826, https://doi.org/10.5194/cp-6-817-2010
Borzenkova, I.I. and V.A. Zubakov, 1984: Climatic Optimum of the Holocene as a model of global climate of the early 21st century. Meteorologiya e Hidrologia, Vol. 8, p. 68-77.
Borzenkova, I., et al., 2015. Climate Change During the Holocene (Past 12,000 Years). In: The BACC II Author Team (eds), Second Assessment of Climate Change for the Baltic Sea Basin, Springer, p. 25-49, https://doi.org/10.1007/978-3-319-16006-1_2
Boucot, A. J., Xu, C., Scotese, C. R., 2013. Phanerozoic Paleoclimate: An Atlas of Lithologic Indicators of Climate. Concepts in Sedimentology and Paleontology, no. 11, Publisher: SEPM (Society for Sedimentary Geology), Gary J. Nichols and Brian Ricketts (eds.), ISBN: 978-1-56576-282-4, 478 pp.
Boulila, S., 2019. Coupling between Grand cycles and Events in Earth’s climate during the past 115 million years. Scientific Reports, Vol. 9, p. 327, https://doi.org/10.1038/s41598-018-36509-7
Bourgeois, G., 2018. Regulations Amending the Canadian Aviation Regulations (Parts I and X — Greenhouse Gas Emissions from International Aviation — CORSIA): SOR/2018-240. Canada Gazette, Part II, Volume 152, Number 24, http://www.gazette.gc.ca/rp-pr/p2/2018/2018-11-28/html/sor-dors240-eng.html, accessed and archived November 30, 2020.
Bourke, W., 1974. A Multi-Level Spectral Model. I. Formulation and Hemispheric Integrations. Monthly Weather Review, Vol. 102, p.687-701.
Bourke, W., McAvaney, B., Puri, K., and Thurling, R., 1977. Global Modeling of Atmospheric Flow by Spectral Methods. Methods in Computational Physics: Advances in Research and Applications, Vol. 17, p. 267-324, https://doi.org/10.1016/B978-0-12460817-7.50010-0
Bows-Larkin, A., 2016. Witness Statement. Criminal Justice Act 1967, Section 9; Magistrates Courts Act, ss5A (3(a)) and 5B; Magistrates Courts Rules, Rule 70. https://www.airportwatch.org.uk/wp-content/uploads/Heathrow13-evidence-from-ProfAlice-Bows-Larkin-Jan-2016.pdf, accessed and archived October 20, 2020.
Bows-Larkin, A. 2017. Climate change: is the shipping industry ready? Manchester Energy, http://www.energy.manchester.ac.uk/research/climate-change/scc/, accessed and archived November 25, 2020.
Box, J. E., Yang, L., Bromwich, D. H., and Bai, L.-S., 2009. Greenland Ice Sheet Surface Air Temperature Variability: 1840–2007, Journal of Climate, Vol 22; Issue 14, p. 4029-4049, https://doi.org/10.1175/2009JCLI2816.1
Boykoff, M., 2014. Media discourse on the climate slowdown. Nature Climate Change, Vol. 4, Issue 3, p. 156-158, DOI: 10.1038/nclimate2156
Boztas, S., 2022. ‘Emotion and pain’ as Dutch farmers fight back against huge cuts to livestock. The Guardian, July 21, https://www.theguardian.com/environment/2022/jul/21/emotion-and-pain-as-dutch-farmers-fight-back-against-huge-cutsto-livestock, accessed and archived July 24, 2022.
Bradley, R. S., 2015. Paleoclimatology: Reconstructing Climates of the Quaternary. Third Edition, Academic Press, ISBN: 978-0-12386913-5, 675 pp.
Braitseva, O. A., et al., 1997. Holocene Key-Marker Tephra Layers in Kamchatka, Russia. Quaternary Research, Vol. 47, Article n°QR961876, p. 125-139, https://doi.org/10.1006/qres.1996.1876
Braitseva, O. A., Melekestsev, I. V., Ponomareva, V. V., and Kirianov V.Yu., 1996. The caldera-forming eruption of Ksudach volcano about Cal. A.D. 240: the greatest explosive event of our era in Kamchatka, Russia. Journal of Volcanology and Geothermal Research, Vol. 70, p. 49-65, https://doi.org/10.1016/0377-0273(95)00047-X
Bralower, T., Premoli Silva, I., and Malone, M. J., 2002. New evidence for abrupt climate change in the Cretaceous and Paleogene: An Ocean Drilling Program expedition to Shatsky Rise, northwest Pacific. GSA TODAY, Vol. 12, Issue 11, p. 4-10, DOI: 10.1130/1052-5173(2002)012<0004:NEFACC>2.0.CO;2 https://pdfs.semanticscholar.org/2cdb/fe682dc4adf71c5be093ceee1b424da079eb.pdf
Braun, H, et al., 2005. Possible solar origin of the 1,470-year glacial climate cycle demonstrated in a coupled model. Nature, Vol. 438, Issue 7065, p. 208–211, DOI: 10.1038/nature04121.
Bray, J. R., 1968. Glaciation and Solar Activity since the Fifth Century BC and the Solar Cycle. Nature, Vol. 220, p 672-674.
Brázdil, R., et al., 2019. The extreme drought of 1842 in Europe as described by both documentary data and instrumental measurements. Climate of the Past, Vol. 15, p. 1861–1884, https://doi.org/10.5194/cp-15-1861-2019
Breger, M. J., Stewart, R. B., E. D., Elliott, and Hawkins, D., 1991. Providing Economic Incentives in Environmental Regulation. Yale Journal on Regulation, Vol. 8, p. 463-495, https://core.ac.uk/download/pdf/143657034.pdf
Brehm, N., et al., 2021. Eleven-year solar cycles over the last millennium revealed by radiocarbon in tree rings. Nature Geoscience, Vol. 14, p. 10-15, DOI: 10.1038/s41561-020-00674-0
Bressler, S, and Shaviv, G., 2015. Modeling the radiation field in the Greenhouse effect – history and evolution. Astronomical Review, Vol. 11, Nos. 3–4, p. 41–63, http://dx.doi.org/10.1080/21672857.2015.1085161
Briffa, K. R., Jones, P. D., Schweingruber, F. H., and Osborn, T. J., 1998. Influence of volcanic eruptions on Northern Hemisphere summer temperature over the past 600 years. Nature, Vol. 393, p. 450-455, https://doi.org/10.1038/30943
Briffa, K. R., 2000. Annual climate variability in the Holocene: interpreting the message of ancient trees. Quaternary Science Reviews, Vol. 19, Issues 1–5, p. 87-105, https://doi.org/10.1016/S0277-3791(99)00056-6
Briffa, K. R., et al., 2001. Low-frequency temperature variations from a northern tree ring density network. Journal of Geophysical Research, Vol 106., Issue D3, p. 2929-2941, https://doi.org/10.1029/2000JD900617
Briffa, K. R., et al., 2008. Trends in recent temperature and radial tree growth spanning 2000 years across northwest Eurasia. Philosophical Transactions of the Royal Society B, Vol. 363, Issue 1501, p. 2271-2284, https://doi.org/10.1098/rstb.2007.2199
Briffa, K.R., et al., 2013. Reassessing the evidence for tree-growth and inferred temperature change during the Common Era in Yamalia, northwest Siberia. Quaternary Science Reviews, Vol. 72, p. 83–107, DOI: 10.1016/j.quascirev.2013.04.008.
Brigham-Grette, J., and Carter, L. D., 1992. Pliocene Marine Transgressions of Northern Alaska: Circumarctic Correlations and Paleoclimatic Interpretation. ARCTIC, Vol. 45, n°1, p. 74-89.
Brigham-Grette, J., et al., 2013. Pliocene Warmth, Polar Amplification, and Stepped Pleistocene Cooling Recorded in NE Arctic Russia. Science, Vol. 340, Issue 6139, p. 1421-1427, DOI: 10.1126/science.1233137
Brill, B., 2019. Study shows NZ has been cooling for 26 years. Climate conversation group, January, 17, 2019, https://www.climateconversation.org.nz/2019/01/study-shows-nz-has-been-cooling-for-26-years/, accessed and archived November 11, 2020.
Brindley, H., and J.E. Harries, 1998. The impact of far ir absorption on clear sky greenhouse forcing: Sensitivity studies at high spectral resolution. Journal of Quantitative Spectroscopy and Radiative Transfer, Vol. 60, Issue 2, p. 151-180. https://doi.org/10.1016/S0022-4073(97)00152-0
Broecker, W. S., 1998. The End of the Present Interglacial: How and When? Quaternary Science Reviews, Vol. 17, Issue 8, p. 689— 694, https://doi.org/10.1016/S0277-3791(98)00037-7
Broecker, W. S., 1991. The great ocean conveyor. Oceanography, Vol. 4, n°2, p. 79-89, https://doi.org/10.5670/oceanog.1991.07, https://tos.org/oceanography/assets/docs/4-2_broecker.pdf
Broecker, W. S., 2018. CO2: Earth’s climate driver. Geochemical Perspectives, Vol. 7, p. 117–196, https://www.geochemicalperspectives.org/online/v7n2/
Bromley, R. G., and D'Alessandro, A., 1987. Bioerosion of the Plio-Pleistocene Trangression of Southern Italy. Rivista italiana di Paleontologia e Stratigrafia, Vol. 93, n°3, pp. 379-442.
Brook, E. D., et al., 2008. Chapter 5. Potential for abrupt changes in atmospheric methane. In: Abrupt Climate Change, Final Report, Synthesis and Assessment Product 3.4, U.S. Climate Change Science Program And the Subcommittee on Global Change Research, USGS, NOAA, NSF, p. 260-452.
Brooker, C., 2015. Farewell to the man who invented 'climate change’. https://www.telegraph.co.uk/news/earth/paris-climatechange-conference/12035401/Farewell-to-the-man-who-invented-climate-change.html, subscription reading only, accessed November25, 2020.
Brouwer, D., and Clemence, G. M., 1961a. Methods of Celestial Mechanics. Academic Press, New York, February 1961, 598 pp. Brouwer, D., and Clemence, G. M., 1961b. Orbits and masses of planets and Satellites. In: G. Kuiper and B. Middlehurst (Editors), The Solar System, Vol. III: Planets and Satellites, Univ. Chicago, Chicago, Illinois, p. 31-94. Brown, N., 2003. Environmental Diplomat. https://www.pace.edu/sites/default/files/files/commencement/hdr-2003-dr-noel-jbrown.pdf
Brown, J., 2014. Why are there so many species in the tropics? Journal of Biogeography, Vol. 41, p. 8-22, DOI: 10.1111/jbi.12228
Brown, P. T., 2017. Do ‘propagation of error’ calculations invalidate climate model projections of global warming? https://patricktbrown.org/2017/01/25/do-propagation-of-error-calculations-invalidate-climate-model-projections-of-globalwarming/ accessed and archived on November 20, 2020.
Brown, C., 2018a. A new ice age was entered after the Arctic Holocene Climate Optimum. https://grandsolarminimum.com/2018/12/08/arctic-entered-new-ice-age-8000-years-ago/, accessed on August 8, 2022. Brown, C., 2018b. Revolution: Ice Age Re-Entry, 355 pp, https://www.amazon.com/dp/B07JZL4QWM
Browning, G. L., Kasahara, A., and Kreiss, H.-O, 1980. Initialization of the Primitive Equations by the Bounded Derivative Method. Journal of the Atmospheric Sciences, Vol. 37, Issue 7, p. 1424-1436, DOI: 10.1175/15200469(1980)037<1424:IOTPEB>2.0.CO;2
Browning, G. L., and Kreiss, H.-O, 1986. Scaling and computation of smooth atmospheric motions. Tellus, Vol. 38A, Issue 4, p. 295–313, https://doi.org/10.1111/j.1600-0870.1986.tb00417.x
Browning, G. L., Holland, W. R., Kreiss, H.-O, and Worley, S. J., 1989. An accurate hyperbolic system for approximately hydrostatic and incompressible oceanographic flows. Dynamics of Atmospheres and Oceans, Vol. 14, p. 303-332, https://doi.org/10.1016/0377-0265(89)90066-3
Browning, G. L., and Kreiss, H.-O, 1994. Splitting Methods for Problems with Different Timescales. Monthly Weather Review, Vol. 122, Issue 11, p. 2614-2622, DOI: 10.1175/1520-0493(1994)122<2614:SMFPWD>2.0.CO;2
Browning, G. L., and Kreiss, H.-O, 2002. Multiscale Bounded Derivative Initialization for an Arbitrary Domain. Journal of the Atmospheric Sciences, Vol. 59, Issue 10, p. 1680-1696, DOI: 10.1175/1520-0469(2002)059<1680:MBDIFA>2.0.CO;2
Browning, G. L., 2020. The Unique, Well Posed Reduced System for Atmospheric Flows: Robustness In The Presence Of Small Scale Surface Irregularities. Dynamics of Atmospheres and Oceans, Vol. 91, 101143, https://doi.org/10.1016/j.dynatmoce.2020.101143
Brückl, E., and Hammerl, C., 2014. Eduard Suess' Conception of the Alpine Orogeny Related to Geophysical Data and Models. Austrian Journal of Earth Sciences, Vol. 107, Issue 1, p. 94-114.
Brunt, D., 1932. Notes on radiation in the atmosphere. I. Quarterly Journal of the Royal Meteorological Society, Vol. 58, Issue 247, p. 389-420, https://doi.org/10.1002/qj.49705824704
Brunt, D., 1934. Physical and Dynamical Meteorology. Cambridge at the University Press, London, Fetter Lane & New York, The MacMillan Co., 411 pp., https://ia802905.us.archive.org/5/items/in.ernet.dli.2015.215092/2015.215092.Physical-And.pdf, accessed and archived on March 13, 2021.
Brunt, D., 1952. Physical and Dynamical Meteorology. Cambridge at the University Press, 411 pp.
Bryan, S. E., and Ferrari, L., 2013. Large igneous provinces and silicic large igneous provinces: Progress in our understanding over the last 25 years. Geological Society of America Bulletin, Vol. 125, Issues 7-8, p. 1053-1078, DOI: 10.1130/B30820.1
Bryson, R. A., Agenbroad, L. D., and McEnaney DeWall, K., 2010. Paleoclimate modeling and paleoenvironmental interpretations for three instances of island dwelling mammoths. Quaternary International, Vol. 217, Issue 1-2, p. 6-9, DOI: 10.1016/j.quaint.2009.09.028
Budd, A. F., 2000. Diversity and extinction in the Cenozoic history of Caribbean reefs. Coral Reefs, Vol. 19, n°1, p. 25-35, DOI: 10.1007/s003380050222
Budyko, M. I., and Izrael, Y. A., 1987. Anthropogenic Climate Change. Univ. of Arizona Press, First Edition edition (June 1, 1991), ISBN13: 978-0816511228, 485 pp.
Buehler, S. A., von Engeln, A., Brocard, E., V.O. John, V. O., Kuhn, T., and Eriksson, P., 2006. Recent developments in the line-by-line modeling of outgoing longwave radiation. Journal of Quantitative Spectroscopy & Radiative Transfer, Vol. 98, p. 446–457. DOI:10.1016/j.jqsrt.2005.11.001
Buesseler, K. O., Boyd, P. W., Black, E. E., and Siegel, D. A., 2020. Metrics that matter for assessing the ocean biological carbon pump. Proc. of the Natl. Acad. of Sci. of the U.S.A., Vol. 117, n°18, p. 9679-9687, https://doi.org/10.1073/pnas.1918114117
Buizert, C., et al. 2015. The WAIS Divide deep ice core WD2014 chronology – Part 1: Methane synchronization (68–31 ka BP) and the gas age–ice age difference, Climate of the Past, Vol. 11, p. 153–173, https://doi.org/10.5194/cp-11-153-2015
Buizza, R., 2002. Chaos and weather prediction January 2000. Meteorological Training Course Lecture Series, ECMWF, 28 pp., https://www.ecmwf.int/sites/default/files/elibrary/2002/16927-chaos-and-weather-prediction.pdf
Büntgen, U., et al., 2016. Cooling and societal change during the Late Antique Little Ice Age from 536 to around 660 AD. Nature Geoscience. Vol. 9, n°3, p. 231-236, DOI: 10.1038/NGEO2652
Burd, A. B., 2010. Assessing the apparent imbalance between geochemical and biochemical indicators of meso-and bathypelagic biological activity: What the @$]! is wrong with present calculations of carbon budgets? Deep Sea Research Part II Topical Studies in Oceanography, Vol. 57, Issue 16, p. 1557-1571, DOI: 10.1016/j.dsr2.2010.02.022
Burkart, K. G., et al., 2021. Estimating the cause-specific relative risks of non-optimal temperature on daily mortality: a two-part modelling approach applied to the Global Burden of Disease Study. The Lancet, Vol. 398, Issue 10301, p. 685-697, https://doi.org/10.1016/S0140-6736(21)01700-1
Burtt, E. A., 1924. The Metaphysical Foundations of Modern Physical Science: A Historical and Critical Essay, 2nd, rev. ed. Garden City, N.Y.: Doubleday, 1954, ISBN 0-486-42551-7, 370 pp., accessed and archived on June 29, 2020. https://www.hrstud.unizg.hr/_download/repository/Burtt,_The_Metaphysical_Foundations_of_Modern_Science.pdf
Bush, S. E., Pataki, D. E., and Ehleringer, J. R., 2007. Sources of variation in δ 13C of fossil fuel emissions in Salt Lake City, USA. Applied Geochemistry, Vol. 22, Issue 4, p. 715-723, DOI: 10.1016/j.apgeochem.2006.11.001
Butler, L. W., 1990. Reasons for being concerned about rising sea level. In: Titus, J. G., Wedge, R., Psuty, N., and Fancher, J., (Eds). Changing Climate and the Coast, Vol. 1, Adaptive Responses and their Economic, Environmental, and Institutional Implications., p. 87-94.
Caillon, N., Jeffrey, P., Severinghaus, P., Jouzel, J., Barnola, JM., Kang, J., and Lipenkov, V. Y., 2003. Timing of Atmospheric CO 2 and Antarctic Temperature Changes Across Termination III Science, vol. 299, n°5613, p. 1728-1731, DOI: 10.1126/science.1078758
Callebaut, D. K., de Jager, C., and Duhau, S., 2012. The influence of planetary attractions on the solar tachocline. Journal of Atmospheric and Solar-Terrestrial Physics, Vol. 80, p. 73-78, http://dx.doi.org/10.1016/j.jastp.2012.03.005
Callendar, G. S., 1938. The artificial production of carbon dioxide and its influence on temperature. Quaterly Journal of the Royal Meteorological Society, 64, p. 223-240, https://doi.org/10.1002/qj.49706427503
Callendar, G. S., 1940. Variations in the amount of carbon dioxide in different air currents. Quaterly Journal of the Royal Meteorological Society, Vol. 66, Issue 287, p. 395-400, https://doi.org/10.1002/qj.49706628705
Callendar, G. S., 1949. Can carbon dioxide influence climate? Weather, Vol. 4, Issue 10, p. 310-314, https://doi.org/10.1002/j.14778696.1949.tb00952.x
Came, R., et al., 2007. Coupling of surface temperature and atmospheric CO2 concentrations during the Palaeozoic era. Nature, Vol.449, Issue 7159, p. 198-201, DOI: 10.1038/nature06085
Camenisch, C., et al., 2020. Extreme heat and drought in 1473 and their impacts in Europe in the context of the early 1470s. Regional Environmental Change, Vol. 20, Issue 19, 15 pp., DOI: 10.1007/s10113-020-01601-0
Campbell, J. E., et al., 2017. Large historical growth in global terrestrial gross primary production. Nature, Vol. 544, Issue 7648, p. 8487, https://par.nsf.gov/servlets/purl/10047390
Campbell, D., 2018. Excess winter deaths in England and Wales highest since 1976. November 30, 2018, https://www.theguardian.com/society/2018/nov/30/excess-winter-deaths-in-england-and-wales-highest-since-1976, accessed and archived on October 27, 2020.
Campuzano, S. A., et al., 2018. New perspectives in the study of the Earth’s magnetic field and climate connection: The use of transfer entropy. PLoS ONE, Vol. 13, Issue 11, Article e0207270, 15 pp., DOI: 10.1371/journal.pone.0207270
Canfield, D. E., 2014. Oxygen: A Four Billion Year History. Princeton University Press, ISBN 978-0-691-14502-0 (hardback), 196 pp. Cano, D., et al., 1986. A method for the determination of the global solar radiation from meteorological satellite data. Solar Energy, Vol. 37, p.31-39. DOI: 10.1016/0038-092X(86)90104-0
Cantor, N. L., 2001. In the wake of the plague: the Black Death and the world it made. New York: Free Press,. ISBN 978-0-684-857350, 272 pp.
Cao, J., et al., 2016. China-U.S. cooperation to advance nuclear power. Science, Vol. 353, Issue 6299, p. 547-548, DOI: 10.1126/science.aaf7131
Cappellotto, L., et al., 2022. Multivariable statistical analysis between geomagnetic field, climate, and orbital periodicities over the last 500 KYR, and their relationships during the last interglacial. Global and Planetary Change, Vol. 213, Article: 103836, https://doi.org/10.1016/j.gloplacha.2022.103836
Carlson, B., 2017. Expert Judgment Or Lack Thereof. https://awealthofcommonsense.com/2017/11/expert-judgment-or-lackthereof/, accessed and archived on October 15, 2020.
Carmichael, M. J., et al., 2017. Hydrological and associated biogeochemical consequences of rapid global warming during the Paleocene-Eocene Thermal Maximum. Global and Planetary Change, Vol. 157, p. 114-138, http://dx.doi.org/10.1016/j.gloplacha.2017.07.014
Carnot, S., 1824. Réflexions sur la puissance motrice du feu et sur les machines propres à développer cette puissance. Paris, Chez Bachelier, Libraire, Quai des Augustins, N°. 55, 102 pp.https://www3.nd.edu/~powers/ame.20231/carnot1824.pdf, accessed and archived on August 4, 2022.
Carolin, S. A., et al., 2019. Precise timing of abrupt increase in dust activity in the Middle East coincident with 4.2 ka social change. Proc. of the Natl. Acad. of Sci. of the U.S.A., Vol. 116, n°1, p. 67-72, https://doi.org/10.1073/pnas.1808103115
Carré, M., et al., 2014. Holocene history of ENSO variance and asymmetry in the eastern tropical Pacific Science, Vol. 345, Issue 6200, p. 1045–1048, DOI: 10.1126/science.1252220
Carroll, B. W., and Ostlie, D. A., 2014. An Introduction to Modern Astrophysics. Second Edition, Pearson New International Edition, Pearson Education Limited, ISBN 13: 978-1-292-02293-2, 1470 pp.
Carslaw, K. S., Harrison, R.G., and Kirkby, J., 2002. Cosmic rays, clouds and climate. Science, Vol. 298, p. 1732-1737. DOI: 10.1126/science.1076964
Carson, S., 2013. Visualizing Atmospheric Radiation – Part Five – The Code. https://scienceofdoom.com/2013/01/10/visualizingatmospheric-radiation-part-five-the-code/, accessed and archived on March 15, 2020.
Carter, T. R., Porter J. H. , and Parry M. L., 1992. Some implications of climatic-change for agriculture in Europe. Journal of Experimental Botany, Vol. 43, n° 253, p. 1159-1167, https://www.jstor.org/stable/23694195
Castelvecchi, D., 2016. Cloud-seeding surprise could improve climate predictions. Nature News, https://www.nature.com/news/cloud-seeding-surprise-could-improve-climate-predictions-1.19971, accessed and archived on November 25, 2020.
Cerling, T. E., Ehleringer, J. R., and Harris, J. M., 1998. Carbon Dioxide Starvation, the Development of C4 Ecosystems, and Mammalian Evolution. Philosophical Transactions of The Royal Society B Biological Sciences, Vol. 353, Issue 1365, p. 159-170, DOI: 10.1098/rstb.1998.0198
Cervantes Saavedra (de), M., 1605-1615. Don Quixote. Publisher: Francisco de Robles, 863 p.
Chamberlin, T. C., 1899. An attempt to frame a working hypothesis of the cause of glacial periods on an atmospheric basis. The Journal of Geology, Vol. VII, n°6, p. 545-584, p. 667-685, pp. 751-787.
Chamberlain, J. W., 1978. Theory of Planetary Atmospheres, An Introduction to Their Physics and Chemistry. Academic Press, New York, ISBN-13: 978-0121672508, 344 pp.
Chamberlain, J. W., and Hunten, D. M., 1987. Theory of Planetary Atmospheres: An Introduction to Their Physics and Chemistry: Second Edition, Chapter 1 Vertical Structure of an Atmosphere. International Geophysics, Vol. 36, pp. 1-70
Chand, S. S., Walsh, K. J. E., Camargo, S. J. et al., 2022. Declining tropical cyclone frequency under global warming. Nature Climate Change, 11 pp., https://doi.org/10.1038/s41558-022-01388-4
Chandrasekhar, S., 1947. On the Radiative Equilibrium of a Stellar Atmosphere. XXI. Astrophysical Journal, Vol. 106, p.152-216.
Chandrasekhar, S., 1948a. On the Radiative Equilibrium of a Stellar Atmosphere. XXII. Astrophysical Journal, Vol. 107, p.48-72.
Chandrasekhar, S., 1948b. On the Radiative Equilibrium of a Stellar Atmosphere. XXIV. Astrophysical Journal , Vol. 108, p.92-111.
Chandrasekhar, S., and Breen, F., H., 1948. On the Radiative Equilibrium of a Stellar Atmosphere. XXIII. Astrophysical Journal, Vol.107, p. 216-219.
Chandrasekhar, S., 1950, Radiative Transfer. Oxford University Press, 393 pp.
Charney, J. G., Fjørtoft, R., von Neumann, J., 1950. Numerical integration of the barotropic vorticity equation. Tellus, Vol. 2, Issue 4., p. 237-254, https://doi.org/10.1111/j.2153-3490.1950.tb00336.x
Charney, J. G., et al., 1979. Carbon Dioxide and Climate- A Scientific Assessment - Report of an Ad Hoc Study Group on Carbon Dioxide and Climate. Woods Hole, Massachusetts, July 23-27, report to the Climate Research Board of the NRC, National Academy of Sciences, 20 pp.
Charvátová, I., and Hejda, P., 2014. Responses of the basic cycles of 178.7 and 2402 yr in solar–terrestrial phenomena during the Holocene. Pattern Recognition in Physics, Vol. 2, p. 21-26, DOI:10.5194/prp-2-21-2014
Chatterjee, A., et al., 2017. Influence of El Niño on atmospheric CO 2 over the tropical Pacific Ocean: Findings from NASA’s OCO-2 mission. Science, Vol. 358, Issue 6360, eaam5776, 8 pp., DOI: 10.1126/science.aam5776
Chavez, F. P., M. Messié, and J. T. Pennington, 2011. Marine primary production in relation to climate variability and change. The Annual Review of Marine Science, Vol. 3, p. 227–260, DOI: 10.1146/annurev.marine.010908.163917
Chen, X., Liang, S., and Cao, Y., 2016. Satellite observed changes in the Northern Hemisphere snow cover phenology and the associated radiative forcing and feedback between 1982 and 2013. Environmental Research Letters, Vol. 11, Article 084002, 10 pp., DOI: 10.1088/1748-9326/11/8/084002
Cheng, H., et al., 2016. The Asian monsoon over the past 640,000 years and ice age terminations. Nature, Vol. 534, Issue 7609, p. 640-646, DOI: 10.1038/nature18591, https://www.ncdc.noaa.gov/paleo-search/study/20450
Cheng, H., et al., 2020. Timing and structure of the Younger Dryas event and its underlying climate dynamics. Proc. of the Natl. Acad. of Sci. of the U.S.A., Vol. 117, n°38, p. 23408-23417, https://doi.org/10.1073/pnas.2007869117
Cheng, W., Chiang, J. C. H., and Zhang, D., 2013. Atlantic Meridional Overturning Circulation (AMOC) in CMIP5 Models: RCP and Historical Simulations. Journal of Climate, Vol. 26, Issue 18, p 7187-7197, https://doi.org/10.1175/JCLI-D-12-00496.1
Cherki, M., 2017. Les canicules mortelles vont s'accentuer en 2100. Publié le 20 juin 2017 à 18:25, https://www.lefigaro.fr/sciences/2017/06/20/01008-20170620ARTFIG00271-les-canicules-mortelles-vont-s-accentuer-en2100.php, subscription access, accessed and on November 25, 2020.
Chernykh, D. V., Galakhov, V. P., and Zolotov, D. V., 2013. Synchronous fluctuations of glaciers in the Alps and Altai in the second half of the Holocene. The Holocene, Vol. 23, n°7, p. 1074–1079, DOI: 10.1177/0959683612475143
Chesner, C. A., Rose, W. I., Deino, A., Drake, R., and Westgate, J. A., 1991. Eruptive history of the earth’s largest Quaternary caldera (Toba, Indonesia) clarified. Geology, Vol. 19, p. 200–203.
Chestney, N., 2012. Global warming close to becoming irreversible-scientists. March 26, 2012, https://www.reuters.com/article/usclimate-thresholds/global-warming-close-to-becoming-irreversible-scientists-idUSBRE82P0UJ20120326, accessed and archived on November 25, 2020.
Chi, M., 2021. Chilly winter due to global warming. Chinadayly, September 9, 2021, https://www.chinadaily.com.cn/a/202111/09/WS6189ebf6a310cdd39bc74421.html, accessed and archived on September 9, 2022.
Chilingar, G.V., Kilyuk L. F., and Sorokhtin, O.G., 2008a. Cooling of Atmosphere Due to CO2 Emission. Energy Sources, Part A, 30: p. 19, ISSN: 1556-7036 print/1556-7230 online, DOI: 10.1080/15567030701568727
Chilingar, G.V., Sorokhtin, O.G., Kilyuk L., and Gorfunkel, M. V., 2008b. Greenhouse gases and greenhouse effect, Environmental geology, Vol. 58, p. 1207-1213, DOI: 10.1007.s00254-008-1615-3, http://ruby.fgcu.edu/courses/twimberley/EnviroPhilo/GreenhouseGasesGreenhouseEffect.pdf
Chinn, T., 1996. New Zealand glacier responses to climate change of the past century. New Zealand Journal of Geology and Geophysics, Vol. 39, Issue 3, p. 415–428, https://doi.org/10.1080/00288306.1996.9514723
Choi, Y.-S., et al., 2017. Revisiting the iris effect of tropical cirrus clouds with TRMM and A‐Train satellite data. Journal of Geophysical Research: Atmospheres, Vol. 122, Issue 11, p. 5917-5931, https://doi.org/10.1002/2016JD025827
Christiansen, B., and Ljungqvist, F. C., 2012. The extra-tropical NH temperature in the last two millennia: reconstructions of lowfrequency variability. Climate of the Past, Vol. 8, p. 765-786. DOI: 10.5194/cpd-7-3991-2011
Christy, J. R., Spencer, R. W., and Braswell, W. D., 1997. How accurate are satellite ‘thermometers’? Nature, Vol. 389, p.342, https://www.nature.com/articles/38640.pdf
Christy, J. R., Spencer, R. W., and Braswell, W. D., 2000. MSU Tropospheric Temperatures: Dataset Construction and Radiosonde Comparisons, Journal of Atmopsheric and Oceanic Technology, Vol. 17, p. 1153-1170, https://doi.org/10.1175/15200426(2000)017<1153:MTTDCA>2.0.CO;2
Christy, J. R., et al., 2001. Differential trends in tropical sea surface and atmospheric temperatures since 1979. Geophysical Research Letters, Vol. 28, Issue 1, p. 183–186, DOI:10.1029/2000GL011167
Christy, J. R., et al., 2010. What Do Observational Datasets Say about Modeled Tropospheric Temperature Trends since 1979? Remote Sensing, Vol. 2, Issue 9, p. 2148-2169, DOI: 10.3390/rs2092148
Christy, J. R., 2016. Testimony on 2 Feb 2016 of John R. Christy, University of Alabama in Huntsville. U.S. House Committee on Science, Space & Technology. 23 pp, accessed and archived on June 08, 2020, https://docs.house.gov/meetings/SY/SY00/20160202/104399/HHRG-114-SY00-Wstate-ChristyJ-20160202.pdf
Christy, J. R., Spencer, R. W., Braswell, W. D., and Junod, R., 2018. Examination of space-based bulk atmospheric temperatures used in climate research. International Journal of Remote Sensing, Vol. 39, Issue 11, p. 3580-3607, DOI: 10.1080/01431161.2018.1444293
Church, J. A., and White, N. J., 2006. A 20th century acceleration in global sea-level rise, Geophysical Research Letters, Vol. 33, Issue 1, L01602, 4 pp., DOI:10.1029/2005GL024826
Chyba, C. F., Hand, K. P., and Thomas, P. J., 2021. Magnetic induction heating of planetary satellites: Analytical formulae and applications. Icarus, Vol. 360, Article114360, https://doi.org/10.1016/j.icarus.2021.114360
Chylek, P., Box, J. E., and Lesins, G., 2004. Global Warming and the Greenland Ice Sheet. Climatic Change, Vol. 63, p. 201-221, DOI: 10.1023/B:CLIM.0000018509.74228.03
Chylek, P., Dubey, M. K., and Lesins, G., 2006. Greenland warming of 1920–1930 and 1995–2005. Geophysical Research Letters, Vol. 33, L11707, DOI:10.1029/2006GL026510.
Chylek, P., Folland, C. K., Lesins, G., and Dubey, M. K., 2010. Twentieth century bipolar seesaw of the Arctic and Antarctic surface air temperatures. Geophysical Research Letters, Vol. 37, L08703, doi:10.1029/2010GL042793
Chylek, P., Folland, C. K., Dijkstra, H. A., Lesins, G. and Dubey, M. K., 2011. Ice-core data evidence for a prominent near 20 year timescale of the Atlantic Multidecadal Oscillation. Geophysical Research Letters, Vol. 38, Issue 13, L13704, 5 pp., DOI: 10.1029/2011GL047501
Chylek, P., Tans, P., Christy, J., and Dubey, M. V., 2018. The carbon cycle response to two El Nino types: an observational study. Environmental Research Letters, Vol. 13, Article 024001, https://doi.org/10.1088/1748-9326/aa9c5b
Chylek, P., Folland, C., Klett, J. D., and Dubey, M. K., 2020. CMIP5 Climate Models Overestimate Cooling by Volcanic Aerosols. Geophysical Research Letters, Vol. 47, Issue 3, 9 pp., DOI: 10.1029/2020GL087047
CIA, 1974. Potential Implications of Trends in World Population, Food Production, and Climate. OPR-401, Central Intelligence Agency, Directorate of Intelligence Office of Political Research, August 1974, 42 pp. + 2 Annexes. http://documents.theblackvault.com/documents/environment/potentialtrends.pdf
Ciais, P., et al., 2013. Carbon and Other Biogeochemical Cycles. In: Climate Change 2013: The Physical Science Basis. Contribution of Working Group I to the Fifth Assessment Report of the Intergovernmental Panel on Climate Change, Stocker, T.F., et al. (eds.), Cambridge University Press, Cambridge, United Kingdom and New York, NY, USA, p. 465-544. Claerbout, J., 2020. Patrick Moore condensed. http://sepwww.stanford.edu/sep/jon/climate.html Clapeyron E., 1834. Mémoire sur la Force motrice de la chaleur. Journal de l’Ecole Polytechnique, Vol.14, XXIIIe Cahier, p. 153-190, https://www3.nd.edu/~powers/ame.20231/clapeyron1834.pdf, accessed and archived on August 4, 2022.
Clark, P. U., et al., 2001. Freshwater forcing of abrupt climate change during the last glaciation. Science, Vol. 293, p. 283-287
Clark, P. U., Pisias, N. G., Stocker, T. F., and Weaver, A.J., 2002. Role of the thermohaline circulation in abrupt climate change. Nature, Vol. 415, Issue 6874, p.863-869, DOI: 10.1038/415863a.
Clark, N., 2005. Chicago Climate Exchange Inc., December 2005, https://unfccc.int/files/meetings/cop_11/climate_talk_series/application/pdf/cop11_kiosk_clark.pdf, accessed and archived on July 11, 2022
Clarkson, C., et al., 2020. Human occupation of northern India spans the Toba super-eruption ~74,000 years ago. Nature Communications, Vol. 11:961, 10 pp., https://doi.org/10.1038/s41467-020-14668-4
Clausius, E. R., 1850. Ueber die bewegende Kraft der Wärme. Annalen de Physik, Vol. 155, Issue 3, p. 368-397, https://doi.org/10.1002/andp.18501550306, accessed and archived on August 4, 2022, https://ia903406.us.archive.org/28/items/ueberdiebewegen00claugoog/ueberdiebewegen00claugoog.pdf
Clausius , E. R., 1864. Abhändlungen über die mechanische Wärmetheorie. Braunschweig, Druck und Verlag von Friedrich Vieweg und Sohn, 360 pp, https://ia600908.us.archive.org/31/items/abhandlungenber00claugoog/abhandlungenber00claugoog.pdf, accessed and archived on August 4, 2022,
Claussen, M., et al., 2002. Earth system models of intermediate complexity: Closing the gap in the spectrum of climate system models, Climate Dynamics, Vol. 18, p. 579-586, DOI: 10.1007/s00382-001-0200-1, https://epic.awi.de/id/eprint/11050/1/Cla2002a.pdf
Clauzon, G., Suc, J.-P., Gautier, F., Berger, A., and Loutre, M.-F., 1996. Alternate interpretation of the Messinian salinity crisis: Controversy resolved? Geology, Vol. 24, no. 4, p. 363-366, DOI: 10.1130/0091-7613(1996)024<0363:AIOTMS>2.3.CO;2
Cliver, E., Boriakoff, V., and Feynman, J., 1998. Solar variability and climate change: Geomagnetic aa index and global surface temperature. Geophysical Research Letters, Vol. 25, Issue 7, p. 1035-1038, https://doi.org/10.1029/98GL00499
CNRM, 2020a. Cycle de l’eau en Méditerranée - HyMeX, https://www.umr-cnrm.fr/spip.php?rubrique198, accessed and archived on November 25, 2020.
CNRM, 2020b. Heavy precipitation climatology. Centre National de Recherches Météorologiques - UMR 3589, https://www.umrcnrm.fr/spip.php?article521, accessed and archived on November 25, 2020.
Cobb, K. M., 2013. Highly Variable Highly Variable El Niño–Southern Oscillation Throughout the Holocene. Science, Vol.339, Issue 67, p. 67-70, DOI: 10.1126/science.1228246
Coe, D., Fabinski, W., and Wiegleb, G., 2021. The Impact of CO2, H2O and Other “Greenhouse Gases” on Equilibrium Earth Temperatures. International Journal of Atmospheric and Oceanic Sciences. Vol. 5, No. 2, 2021, p. 29-40, doi: 10.11648/j.ijaos.20210502.12
Coffin, M., and Eldholm, O., 1994. Large igneous provinces: Crustal structure, dimensions, and external consequences. Reviews of Geophysics, Vol. 32, Issue 1, Paper number 93RG02508, p. 1-36, DOI: 10.1029/93RG02508
Cogley, J. G., 2011. Himalayan Glaciers in 2010 and 2035. In: Singh V. P., Singh P., Haritashya U. K. (eds), Encyclopedia of Snow, Ice and Glaciers. Encyclopedia of Earth Sciences Series. Springer, Dordrecht, https://doi.org/10.1007/978-90-481-2642-2_673
Cohen, R., and Happer, W., 2015. Fundamentals of Ocean pH. Sept 18, 12 pp., http://co2coalition.org/wpcontent/uploads/2015/12/pH.pdf
Cohen, J., 2020. Pearl Jam Recruits Climate Change Activist Greta Thunberg for ‘Retrograde’. Variety, May 14, 2020, https://variety.com/2020/music/news/pearl-jam-greta-thunberg-retrograde-video-watch-1234606458/, accessed and archived on December 1, 2020.
Cohen, F., and Dechezleprêtre, A., 2022. Mortality, Temperature, and Public Health Provision: Evidence from Mexico. American Economic Journal: Economic Policy, Vol. 14, Issue 2, p. 161-192, DOI: 10.1257/pol.20180594
Cohn, T. A. and Lins, H. F., 2005. Nature’s style: Naturally trendy. Geophysical Research Letters, Vol. 32, Issue 23, L23402, doi:10.1029/2005GL024476
Colbourn, G., Ridgwell, A., and Lenton, T., 2015. The time scale of the silicate weathering negative feedback on atmospheric CO 2. Global Biogeochemical Cycles, Vol. 29, p. 583–596, DOI:10.1002/2014GB005054
Cole-Dai, J., et al., 2009. Cold decade (AD 1810-1819) caused by Tambora (1815) and another (1809) stratospheric volcanic eruption. Geophysical Research Letters, Vol. 36, Issue 22, L22703, DOI: 10.1029/2009GL040882
Cole-Dai, J., 2010. Volcanoes and climate. Wiley Interdisciplinary Reviews Climate Change, Vol. 1, n°6, p. 824-839, DOI: 10.1002/wcc.76
Coles, P., 2019. Relativity revealed. Nature, Books & Arts, Vol. 568, p. 306-307, https://www.nature.com/articles/d41586-019-01172z
Collina-Girard, J., 2014. La grotte Cosquer : une bulle de mémoire sous les eaux marseillaises. 8 pp., https://www.researchgate.net/publication/271200288_La_grotte_Cosquer_une_bulle_de_memoire_sous_les_eaux_marseill aises
Colling, A., et al., 2004. Ocean Circulation. The Open University, Butterworth-Heinemann, ISBN 0 7506 5278 0, 287 pp, http://www.sisal.unam.mx/labeco/LAB_ECOLOGIA/OF_files/54211042-Ocean-Circulation-Open-University.pdf, accessed and archived on August 7, 2020.
Collins, W. D., et al., 2004. Description of the NCAR Community Atmosphere Model (CAM 3.0). NCAR Technical Note, NCAR/TN464+STR, 214 pp..
Collins, M., et al, 2010. The impact of global warming on the tropical Pacific Ocean and El Niño. Nature Geoscience, Vol. 3, p. 391–397, DOI: 10.1038/ngeo868
Collomb, J.-D., 2014. The Ideology of Climate Change Denial in the United States. European Journal of American Studies, Vol. 9-1, 20pp. https://doi.org/10.4000/ejas.10305
Colmerauer, A., Roussel, P., 1993. The birth of Prolog. ACM SIGPLAN Notices, Vol. 28, Issue 3, p. 37-66, DOI:10.1145/155360.155362, http://alain.colmerauer.free.fr/alcol/ArchivesPublications/PrologHistory/19november92.pdf, accessed and archived on October 12, 2020.
Connell, 2015. Vulnerable Islands: Climate Change, Tectonic Change, and Changing Livelihoods in the Western Pacific. The Contemporary Pacific, Vol. 27, Issue 1, p. 1-36
Connell, J., 2018. 6 Nothing There Atoll? “Farewell to the Carteret Islands”: Living Climate Change in Oceania. In book: Pacific Climate Cultures, Chapter 6, p. 73-87, DOI: 10.2478/9783110591415-007
Connolley, W. (Stoat), 2016. Science advances one funeral at a time. ScienceBlogs, January 19, 2016, https://scienceblogs.com/stoat/2016/01/19/science-advances-one-funeral-at-a-time, accessed and archived on November 25, 2020.
Connolly, R., et al., 2019. Northern Hemisphere Snow-Cover Trends (1967-2018): A Comparison between Climate Models and Observations. Geosciences (Switzerland), Vol. 9, 135, 23 pp., DOI: 10.3390/geosciences9030135
Connolly, R., Soon, W., Connolly, M., Baliunas, S., Berglund, J., et al., 2021. How much has the Sun influenced Northern Hemisphere temperature trends? An ongoing debate. Research in Astronomy and Astrophysics, Vol. 21, No. 6, , 131-(68pp), doi: 10.1088/1674-4527/21/6/131, https://iopscience.iop.org/article/10.1088/1674-4527/21/6/131/pdf
Connor, S., 2011. Don't believe the hype over climate headlines. https://www.independent.co.uk/news/science/steve-connor-dontbelieve-the-hype-over-climate-headlines-2180195.html, accessed and archived on October 14, 2020.
Cook, J., Nuccitelli, D., Green, S. A., Richardson, M., Winkler, B., Painting, R., et al., 2013. Quantifying the consensus on anthropogenic global warming in the scientific literature. Environmental Research Letters, Vol. 8, Number 2, 024024, 7 pp., DOI:10.1088/1748-9326/8/2/024024
Cook, J., 2015. Tree-ring proxies and the divergence problem. https://www.skepticalscience.com/Tree-ring-proxies-divergenceproblem.htm, accessed and archived on November 25, 2020.
Cook, J., et al., 2016. Consensus on consensus: a synthesis of consensus estimates on human-caused global warming. Environmental Research Letters, Vol. 11, n°4, 048002, 7 pp., DOI:10.1088/1748-9326/11/4/048002
Cook, J., van der Linden, S., Maibach, E., and Lewandowsky, S., 2018. The Consensus Handbook. DOI:10.13021/G8MM6P. Cooper, A., et al., 2021. A global environmental crisis 42,000 years ago. Science, Vol. 371, Issue 6531, p. 811-818, DOI: 10.1126/science.abb8677
Copin-Montegut, C., 1988. A New Formula for the Effect of Temperature on the Partial Pressure of CO 2 in Seawater. Marine Chemistry, Vol. 25, p. 29-37, https://doi.org/10.1016/0304-4203(88)90012-6
Copin-Montégut, G., 1996. Chimie de l’eau de mer. Institut Océanographique, ISBN 13 : 9782903581145, 320 pp.
Cordato, R., 2013. Climate experts believe the next ice age is on it’s way…within a lifetime. The John Locke Foundation, https://www.johnlocke.org/update/climate-experts-believe-the-next-ice-age-is-on-its-way-within-a-lifetime/, accessed and archived on October 28, 2020.
Cornes, R., van der Schrier, G., van den Besselaar, E. J. M., and Jones, P. D., 2018. An Ensemble Version of the E-OBS Temperature and Precipitation Data Sets. Journal of Geophysical Research Atmospheres, Vol. 123, Issue 17, p. 9391-9409, DOI: 10.1029/2017JD028200
Cornwall, W., and Voosen, P., 2017. How a culture clash at NOAA led to a flap over a high-profile warming pause study. February 8, 2017, https://www.sciencemag.org/news/2017/02/how-culture-clash-noaa-led-flap-over-high-profile-warming-pause-study, accessed and archived on November 10, 2020.
Corrège, T., et al., 2000. Evidence for stronger El Niño-Southern Oscillation (ENSO) events in a mid-Holocene massive coral. Paleoceanography, Vol. 15, n°4, p. 465-470, DOI: 10.1029/1999PA000409
Corrick, E. C., et al., 2020. Synchronous timing of abrupt climate changes during the last glacial period. Science, Vol. 369, Issue 6506, p. 963-969, https://www.science.org/doi/10.1126/science.aay5538
Costa, S. M. S., and Shine, K. P., 2012. Outgoing Longwave Radiation due to Directly Transmitted Surface Emission. Journal of the Atmospheric Sciences, Vol. 69, p. 1865-1870, DOI: 10.1175/JAS-D-11-0248.1
Costella, J., 2010. The Climategate Emails. The Lavoisier Group, 168 pp, accessed and archived on August 14, 2020. http://www.lavoisier.com.au/articles/greenhouse-science/climate-change/climategate-emails.pdf
Coulaud, A., 2018. La lutte pour le climat est contraire aux libertés individuelles et donc sans doute avec la démocratie. Interview de François-Marie Bréon, July 29, 2018, https://www.liberation.fr/planete/2018/07/29/francois-marie-breon-la-lutte-pour-leclimat-est-contraire-aux-libertes-individuelles_1669641, accessed and archived on November 25, 2020.
Court, M., 2017. Les vagues de froid polaire sont bien liées au réchauffement de la planète. December 27, 2017, https://www.lefigaro.fr/sciences/2017/12/27/01008-20171227ARTFIG00191-les-coups-de-froid-polaire-sont-lies-aurechauffement.php, susbcription only, accessed and archived on October 14, 2020.
Courtillot, V., Féraud, G., Maluski, H., Vandamme, D., Moreau M. G., and Besse, J., 1988. Deccan flood basalts and the Cretaceous/Tertiary boundary. Nature, Vol. 333, p. 843–846.
Courtillot, V., Jaeger, J. J., Yang, Z., Féraud, G., and Hofmann, C., 1996. The influence of continental flood basalts on mass extinctions: Where do we stand? In: The Cretaceous-Tertiary Event and Other Catastrophes in Earth History, The Geological Society of Americ, Vol. 307, ISBN: 9780813723075, https://doi.org/10.1130/0-8137-2307-8.513
Courtillot, V., Gallet Y., Le Mouël, J.L., Fluteau, F., and Genevey, A., 2007. Are there connections between the Earth's magnetic field and climate ? Earth and Planetary Science Letters, Vol. 253, p. 328–339.
Courtillot, V., Gallet, Y., Le Mouël, J.-L., Fluteau, F., Genevey, A., 2008. Response to comment on “Are there connections between Earth's magnetic field and climate?, Earth Planet. Sci. Lett., 253, 328–339, 2007” by Bard, E., and Delaygue, M., Earth Planet. Sci. Lett., in press, 2007. Earth and Planetary Science Letters, Vol. 265, p. 308–311, doi:10.1016/j.epsl.2007.09.031
Courty, M.-A., et al., 2008. Regional Manifestation of the Widespread Disruption of Soil-Landscapes by the 4 kyr BP Impact-Linked Dust Event Using Pedo-Sedimentary Micro-Fabrics. In: New Trends in Soil Micromorphology, S. Kapur et al. (eds.), SpringerVerlag, p. 211-236, DOI: 10.1007/978-3-540-79134-8_12
Couteau, P., 1971. Sur la validité de la relation empirique masse-luminosité dans le calcul des masses des étoiles. Astrophysics and Space Science, Vol. 11, p. 55-58, https://doi.org/10.1007/BF02385021
Covington, J., 2014. IPCC Has Become “Too Blinkered and Corrupt to Save”. Interview of Vincent Gray, originally in "A leading Canadian newspaper, i.e. Financial Post" but the paper by Solomon, Lawrence (26 October 2007) has disappeared since, still available with edits thanks to the "American Movement to Restore Common Sense" http://roarkmj.blogspot.com/2014/10/ipcc-has-become-too-blinkered-and.html , accessed and archived on November 12, 2020.
Crichton, M., 2003. Aliens Cause Global Warming. Lecture on January 17, 2003 at the California Institute of Technology, https://stephenschneider.stanford.edu/Publications/PDF_Papers/Crichton2003.pdf, accessed and archived on November 25, 2020.
Crichton, M., 2009. Three Speeches by Michael Crichton, Environmentalism as Religion, The Case for Skepticism on Global Warming. SPPI Commentary and Essays, December 9, 45 pp, with the 3rd presentation made on January 25, 2005 at the National Press Club in Washington, D.C. http://scienceandpublicpolicy.org/images/stories/papers/commentaries/crichton_3.pdf, accessed and archived on November 13, 2020.
Crockford, S., 2017. Testing the hypothesis that routine sea ice coverage of 3-5 mkm2 results in a greater than 30% decline in population size of polar bears (Ursus maritimus). DOI: 10.7287/peerj.preprints.2737v3
Crockford, S., 2019. The Polar Bear Catastrophe That Never Happened. The Global Warming Policy Foundation, Kindle Edition, ASIN : B07PT7SCZ8, 211 pp.
Croix, A., 1992. Compte Rendu sur "Les Années De Misère: La famine au temps du Grand Roi", Revue d’Histoire Moderne & Contemporaine, tome 39, n°2, p. 333-335
Cronin, T. M., et al., 2005. Multiproxy evidence of Holocene climate variability from estuarine sediments, eastern North America, Paleoceanography, Vol. 20, PA4006, 21 pp., DOI:10.1029/2005PA001145
Crowley, K., and Rathi, A., 2021. Occidental to Strip Carbon From the Air and Use It to Pump Crude. January 13, 2021, bloomberg.com, https://www.bloomberg.com/news/articles/2021-01-13/occidental-oxy-wants-to-go-green-to-producemore-oil, accessed and archived on January 14, 2021.
Crucifix, M., 2011. How can a glacial inception be predicted? The Holocene, Vol. 21, p. 831-842, DOI:10.1177/0959683610394883
Cummings, W., 2019. The world is going to end in 12 years if we don't address climate change,' Ocasio-Cortez says. USA TODAY, January 22, 2019, https://eu.usatoday.com/story/news/politics/onpolitics/2019/01/22/ocasio-cortez-climate-changealarm/2642481002/, accessed and archived on November 25, 2020.
Curry, J. A., and Webster, P. J., 2011. Climate science and the uncertainty monster. Bulletin of the American Meteorological Society, Vol. 92, Issue 12, p. 1667-1682. DOI:10.1175/2011BAMS3139.1
Curry, 2016a. The art and science of climate model tuning. Climate Etc., August 1, 2016, https://judithcurry.com/2016/08/01/the-artand-science-of-climate-model-tuning/, accessed and archived on July 10, 2020.
Curry, 2016b. Climate modelers open up their black boxes to scrutiny. Climate Etc., November 5, 2016, https://judithcurry.com/2016/11/05/climate-modelers-open-up-their-black-boxes-to-scrutiny, accessed and archived on July 10, 2020.
Curry, J., 2016c. Climate power play by the AAAS et al. judithcurry.com, July 4, 2016 – https://judithcurry.com/2016/07/04/climatepower-play-by-the-aaas-et-al/, accessed and archived on July 7, 2022.
Curry, J., 2017. CLIMATE MODELS for the layman. The Global Warming Policy Foundation, GWPF Briefing 24, 30 pp., https://www.thegwpf.org/content/uploads/2017/02/Curry-2017.pdf, accessed and archived on July 10, 2020.
Curry, J., 2018. Sea Level and Climate Change. Climate Forecast Applications Network, 79 pp., http://www.cfanclimate.net, accessed and archived on June 30, 2020.
Curry, J., 2019a. Sea Level and Climate Change. Version 2, 11 February 2019, Climate Forecast Applications Network, 79 pp., https://curryja.files.wordpress.com/2018/11/special-report-sea-level-rise-3.pdf, accessed and archived on June 5, 2022.
Curry, J., 2019b. Early 20th century global warming. January 23, Climate Etc., https://judithcurry.com/2019/01/23/early-20thcentury-global-warming/
Cyronak, T., Schulz, K. G., and Jokiel, P. L., 2016. The Omega myth: what really drives lower calcification rates in an acidifying ocean. ICES Journal of Marine Science, Volume 73, Issue 3, p. 558–562, https://doi.org/10.1093/icesjms/fsv075
Czechowski, A., et al., 2010. Structure of the heliospheric current sheet from plasma convection in time-dependent heliospheric models. Astronomy and Astrophysics, Vol. 516, A17, 10 pp., https://doi.org/10.1051/0004-6361/200913542
D’Arrigo, R., Wilson, R., and Tudhope, A., 2009. The impact of volcanic forcing on tropical temperatures during the past four centuries. Nature Geoscience, Vol. 2, p. 51–56, DOI:10.1038/ngeo393
Dahl-Jensen, D., et al., 2013. Eemian interglacial reconstructed from a Greenland folded ice core. Nature, Vol. 493, p. 489-494, DOI: 10.1038/nature11789
Dai, A., and Trenberth, K. E., 2002. Estimates of Freshwater Discharge from Continents: Latitudinal and Seasonal Variations. Journal of Hydrometeorology, Vol. 3., Issue 6, p 660-687, https://doi.org/10.1175/1525-7541(2002)003<0660:EOFDFC>2.0.CO;2 D’Aleo, J., and MacRae, A. M., 2015. Cold Weather Kills 20 Times as Many People as Hot Weather. 5 pp., https://friendsofsciencecalgary.files.wordpress.com/2015/09/cold-weather-kills-macrae-daleo-4sept2015-final.pdf, accessed and archived on October 27, 2020.
Daly, J. L., 2003a. Tasmanian Sea Levels- The `Isle of the Dead' Revisited - Part 1. 2 nd February, http://www.john-daly.com/deadisle/, accessed and archived on November 19, 2020.
Daly, J. L., 2003b. Tasmanian Sea Levels- The `Isle of the Dead' Revisited - Part 2., 9 th February, http://www.johndaly.com/deadisle/part2.htm, accessed and archived on November 19, 2020.
Daly, J. L., 2003c. Sea Level at Hobart, Tasmania - A Failure to Authenticate. 11th June, http://www.john-daly.com/deadisle/hobartmsl.htm, accessed and archived on November 19, 2020.
Damon, P. E., and Sonett, C. P., 1991. Solar and terrestrial components of the atmospheric 14C variation spectrum. in Book: The Sun in Time. Sonnett, C. P. , Giampa, M. S., and Matthews, M. S., (Eds.). ISBN 0-8165-12987-3, published by the University of Arizona Press, Tucson, AZ USA, p. 360-388.
Dana, J. D., 1863. Manual of Geology, 823 pp, https://archive.org/details/bub_gb_QjwDAAAAQAAJ/mode/2up, accessed on December 7, 2020
Dansgaard, W., 1964. Stable Isotopes in Precipitation. Tellus, Vol. 16, Issue 4, p. 436-468, https://doi.org/10.1111/j.21533490.1964.tb00181.x
Dansgaard, W., White, J. W. C., and Johnsen, S. J., 1989. The abrupt termination of the Younger Dryas climate event. Nature, Vol.339, p. 532-534, https://doi.org/10.1038/339532a0
Dansgaard, W., et al., 1993. Evidence for general instability of past climate from a 250-kyr ice-core record, Nature, vol. 364, Issue 6434, p. 218-220, DOI: 10.1038/364218a0
Davies, J. H., and Davies, D. R., 2010. Earth's surface heat flux. Solid Earth, Vol. 1, p. 5–24, Doi: www.solid-earth.net/1/5/2010/ Davis, J. C., 1973. Statistics and Data Analysis in Geology. Wiley, ISBN 9780471198956, 550 pp.
Davis, W. J., 2017. The relationship between atmospheric carbon dioxide concentration and global temperature for the last 425 million years. Climate, Vol. 5, Issue 76, 35 pp., doi: 10.3390/cli5040076
Dawidoff, N., 2009. The Civil Heretic. The New York Times Magazine, March 25, 2009, accessed and archived on October 9, 2020. https://www.nytimes.com/2009/03/29/magazine/29Dyson-t.html or https://archive.nytimes.com/www.nytimes.com/2009/03/29/magazine/29Dyson-t.html de Baecque, A., 2003. 700 000 morts lors des canicules de 1718-1719. Libération, 14 Août 2003, updated 7 Août 1028, https://www.liberation.fr/france/2003/08/14/700-000-morts-lors-des-canicules-de-1718-1719_442098/, accessed and archived on August 12, 2022.
Debras, P., Poyet, P., Brisson, E., 1991. Expert Systems and Documentary Databases Integration. Computer-Aided Civil and Infrastructure Engineering, Vol. 6, Issue 4, p. 281-289, https://doi.org/10.1111/j.1467-8667.1991.tb00259.x
Debret, M., et al., 2007. The origin of the 1500-year climate cycles in Holocene North-Atlantic records. Climate of the Past, Vol. 3, p.569-575, DOI: 10.5194/cp-3-569-2007
Debret, M., 2008. Caractérisation de la variabilité climatique Holocène à partir de séries continentales, marines et glaciaires. Thèse de Doctorat de Spécialité: Sciences de la la Terre et de l'Univers, 23rd Oct., Université Joseph Fourier (Grenoble 1), 299 pp.
DeConto, R. M., 2008. Plate Tectonics and Climate Change. In: Encyclopedia of Paleoclimatology and Ancient Environments, Gornitz, F. (ed.), ISBN: 978-1-4020-4551-6, https://doi.org/10.1007/978-1-4020-4411-3_188
Decker, V., et al., 2020. Collapse of Holocene mangrove ecosystems along the coastline of Oman. Quaternary Research, p. 1-25, DOI: https://doi.org/10.1017/qua.2020.96
Defant, A., 1924. Die Schwankungen der atmospharischen Zirkulation fiber dem Nordatlantischen Ozean im 25-jahrigen Zeitraum 1881-1905. Geografiska Annaler, Vol. 6, p. 13-41, https://doi.org/10.2307/519605
De Freitas, C. R., Dedekind, M. O., and Brill, B. E., 2014. A Reanalysis of Long-Term Surface Air Temperature Trends in New Zealand. Environmental Modeling and Assessment, Vol. 20, p. 399-410, DOI: 10.1007/s10666-014-9429-z de Jager, C., and Versteegh, G. J. M., 2005. Do Planetary Motions Drive Solar Variability? Solar Physics, Vol. 229, p. 175-179, https://doi.org/10.1007/s11207-005-4086-7
de Larminat, P., 2014. Climate Change: Identification and Projections. Wiley-ISTE editions, London, ISBN: 978-1-848-21777-5, 152 pp., DOI: 10.1002/9781119053989
de Larminat, P., 2016. Earth climate identification vs. anthropic global warming attribution. Annual Reviews in Control, Vol. 42, 12 p., DOI: 10.1016/j.arcontrol.2016.09.018
Délèze M., 2020. Pression atmosphérique en fonction de l'altitude, 7 pp, accessed and archived on September 20, 2020. https://www.deleze.name/marcel/sec2/applmaths/pression-altitude/pression-altitude.pdf
Delfin, F. G., et al., 1997. Geological, 14C, and historical evidence for a 17th century eruption of Mt. Parker, southern Philippines. Journal of the geological Society of the Philippines, Vol LII, n°1, p. 25-42.
Delingpole, J., 2009a. Meet the man who has exposed the great climate change con trick. The Spectator, July 11, 2009, https://www.spectator.co.uk/article/meet-the-man-who-has-exposed-the-great-climate-change-con-trick, accessed and archived on November 26, 2020.
Delingpole, J., 2009b. Climategate: the corruption of Wikipedia. The Telegraph, Information Liberation, December 24, 2009, http://www.informationliberation.com/?id=28353
Delingpole, J., 2016. Climate Change: The Greatest-Ever Conspiracy Againt the Taxpayer. Breitbar.com, March 28, 2016, http://www.breitbart.com/london/2016/03/28/climate-change-the-biggest-conspiracy-against-the-taxpayer-in-history/, accessed and archived on November 5, 2020.
Delmas, R., Mégie, G., and Peuch, V.-H., 2005. Physique et chimie de l'atmosphère: 2e édition. Belin, ISBN 2-7011-3700-4, 638 pp. + CD Rom.
Delworth, T. L., et al., 2008. Chapter 4. The Potential for Abrupt Change in the Atlantic Meridional Overturning Circulation. In: Abrupt Climate Change, Final Report, Synthesis and Assessment Product 3.4, U.S. Climate Change Science Program And the Subcommittee on Global Change Research, USGS, NOAA, NSF, p. 258-359.
Delworth, T. L., et al., 2019. SPEAR: The Next Generation GFDL Modeling System for Seasonal to Multidecadal Prediction and Projection. Journal of Advances in Modeling Earth Systems, Vol. 12, Issue 3, Article e2019MS001895, https://doi.org/10.1029/2019MS001895
Delworth, T. L., and Knutson, T. R., 2020. Simulation of Early 20th Century Global Warming. Science, Vol 287, Issue 5461, p. 22462250, DOI: 10.1126/science.287.5461.224
De Marchi, L., 1895. ricerca teorica delle condizioni che determinano l'attuale distribuzione delle temperature e delle pioggie sulla superficie terrestre e che possono averla modificata nei precedenti periodi geologici. Premiato dal R. Istituto Lombardo di Scienze e Lettere al Concorso Ordinario Cagnola, xii, 231 pp.
Dembiński, B., 2015. Elements of Greek Scepticism in Richard Feynman's Views on Science. Folia Philosophica, T. 34, p.185-198, https://core.ac.uk/download/pdf/197747419.pdf
deMenocal, P. B., et al., 2000a. Abrupt onset and termination of the African Humid Period: rapid climate responses to gradual insolation forcing. Quaternary Science Reviews, Vol. 19, p. 347-361.
deMenocal, P. B., Ortiz, J. D., Guilderson, T., and Sarnthein, M., 2000b. Coherent High- and Low-Latitude Climate Variability During the Holocene Warm Period. Science, Vol. 288, Issue 5474, p. 2198-2202, DOI: 10.1126/science.288.5474.2198
deMenocal, P. B., and Tierney, J. E., 2012. Green Sahara: African Humid Periods Paced by Earth's Orbital Changes. Nature Education Knowledge, 3(10):12, https://www.nature.com/scitable/knowledge/library/green-sahara-african-humid-periods-paced-by82884405/, accessed and archived on July 11, 2020.
deMenocal, P. B., 2015. End of the African Humid Period. Nature Geoscience, Vol. 8, n°2, p. 86-87. DOI: 10.1038/ngeo2355
Dent, L., 2004. The retreat of the Great Aletsch glacier in Switzerland. Weather, Vol. 59, No. 8, p. 232-233, https://doi.org/10.1256/wea.191.03
Denton, G. H., and Karlén, W., 1973. Holocene climatic variations—Their pattern and possible cause. Quaternary Research, Vol. 3, Issue 2, p. 155-174, IN1-IN2, 175-205, https://doi.org/10.1016/0033-5894(73)90040-9
Derham, W., 1709. The History of the Great Frost in the Last Winter 1703 and 1708/9. Philosophical Transactions, Vol. 26, Issue 324, p. 454–478, doi:10.1098/rstl.1708.0073,
Deser, C., 2000. On the Teleconnectivity of the "Artic Oscillation". Geophysical Research Letters, Vol. 27, NO.6, p. 779-782, DOI: 10.1029/1999GL010945
Deser, C., Phillips, A., Bourdette, V., and Teng, H., 2012. Uncertainty in climate change projections: the role of internal variability. Climate Dynamics, Vol. 38, p. 527-546, DOI: 10.1007/s00382-010-0977-x
Deser, C., et al., 2020. Insights from Earth system model initial-condition large ensembles and future prospects. nature climate change, Vol. 10, p. 277-286, https://doi.org/10.1038/s41558-020-0731-2
Des Marais, D. J., Strauss, H., Summons, R. E., and Hayes, J., 1992. Carbon isotope evidence for the stepwise oxidation of the Proterozoic environment. Nature, Vol. 359, Issue 6396, p. 605-609, DOI: 10.1038/359605a0
Desprat, S., Sánchez Goñi, M. F., Loutre, M.-F., 2003. Revealing climatic variability of the last three millennia in northwestern Iberia using pollen influx data. Earth and Planetary Science Letters, Vol. 213, Issues 1–2, p. 63-78, https://doi.org/10.1016/S0012821X(03)00292-9
Després, V., et al., 2012. Primary biological particles in the atmosphere: A review. Tellus B, Vol. 64, n°1, 015598, 40 pp., DOI: 10.3402/tellusb.v64i0.15598
Detay, M., Poyet, P., Emsellem, Y., Bernardi, A., Aubrac, G., 1989. Development of the Saprolite Reservoir and its State of SaturationInfluence on the Hydrodynamic Characteristics of Drillings in Crystalline Basement. Proceedings of the French National Academy of Sciences, Series II, Vol. 309, Issue 4, p. 429-436.
Detay, M., and Poyet, P., 1989. Development and Evaluation of a Field Prototype Expert System for Village Water Supply Programs. Proc. of International Symposium on Groundwater Management: Quantity and Quality, Published by the International Association of Hydrogeologists, Benidorm, Spain, Oct. 2-5, IAHS n°188, p. 80-100, https://www.academia.edu/30128095, DOI: 10.13140/2.1.1057.2480
Detay, M., and Poyet, P., 1990a. Design and implementation of a field expert system for village water supply programs. Bulletin of Engineering Geology and the Environment, Vol. 41, n°1, p. 63-75, DOI: 10.1007/BF02590208
Detay, M., and Poyet, P., 1990b. Application of remote sensing in field hydro-engineering geology: the artificial intelligence approach. Proc. International Symposium: Remote sensing and water resources, organized by AIH and NSRS, Aug. 20-24, The Netherlands, Vol. 1, p. 849-858, https://www.academia.edu/30128091, DOI: 10.13140/2.1.3925.3447
Detay, M., and Poyet, P., 1990c. Introduction aux méthodes modernes de maîtrise de l’eau [troduction of modern water control methods]. Hydrogeology Journal, Hydrogéologie, Vol.1, p. 3-25.
Detay, M., and Poyet, P., 1990d. Influence of the development of the saprolite reservoir and of its state of saturation on the hydrodynamic characteristics of drillings in the cristalline basement. In: Proc. of the 28th International Geological Congress, selected papers on Hydrogeology, Washington, D.C., USA, July 9-19 1989, Vol.1, p.463-471, Simpson E. S. and Sharp, Jr., J. M., (eds.), Verlag Heinz Heise, ISBN 3-922705-60-X
Detay, M., Poyet, P., Castany, G., Bernardi, A., Casanova, R., Emsellem, Y., Brisson, E., Aubrac, G., 1991. Hydrogéologie de la limite Sud-Ouest du bassin du Lac Tchad au Nord Cameroun - mise en évidence d’un aquifère semi-captif de socle dans les zones de piémont et de « biseau sec ». Proceedings of the French National Academy of Sciences, Series II, Vol. 312, p. 1049-1056.
Detay, 1997. Water Wells, Implementation, Maintenance and Restoration. John Wiley & Sons, Series in Water Resource Engineering, 394 pp., ISBN: 2-225-85622-2 & 0-471-96695-9
Detay, M., 2013. Impact du volcanisme sur le climat passé et présent de la Terre. LAVE, Revue de l'Association Volcanologique Européenne, ISSN 0982-9601, n°162, p. 19-31.
Detay, 2017. Traité de volcanologie physique. Edition: Lavoisier Tech et DocPublisher: Lavoisier Tech et DocEditor: Lavoisier Tech etISBN: 978-2-7430-2258-7. https://www.researchgate.net/publication/312219336_Traite_de_volcanologie_physique
Devers, A., Vidal, J.-P., Lauvernet, C., and Graff, B., 2017. Reanalysis of the 1893 heat wave in France through offline data assimilation in a downscaled ensemble meteorological reconstruction. 19th EGU General Assembly, EGU2017, proceedings from the conference held 23-28 April, 2017 in Vienna, Austria., p.5618, DOI: 10.13140/RG.2.2.28093.61926
De Vivo, B., Rolandi, G., Gans, P.B., Calvert, A., Bohrson, W.A., Spera, F.J., Belkin, H.E., 2001. New constraints on the pyroclastic eruptive history of the Campanian volcanic Plain (Italy). Mineralogy and Petrology, Vol. 73, n°1, p. 47-65, DOI: 10.1007/s007100170010
DeWeese, T., 2002. The Heidelberg Appeal. American Policy Center, American Policy Center, March 29, 2002, https://americanpolicy.org/2002/03/29/the-heidelberg-appeal/, accessed and archived on October 6, 2020. Diamond, Jr. A. M., 1980. F. A. Hayek on constructivism and Ethics. The journal of Libertarian Studies, Vol. IV, No. 4 (Fall 1980), p. 353-365.
Dickens, G. R., O'Neil, J.R., Rea, D.K., and Owen, R.M., 1995. Dissociation of oceanic methane hydrate as a cause of the carbon isotope excursion at the end of the Paleocene. Paleoceanography and Paleoclimatology, Vol. 10, Issue 6, p. 965-971, https://doi.org/10.1029/95PA02087
Dickens, G. R., Castillo, M. M., and Walker, J. C. G., 1997. A blast of gas in the latest Paleocene: simulating first-order effects of massive dissociation of oceanic methane hydrate. Geology, Vol. 23, no. 3, p. 2>59-262, DOI: 10.1130/00917613(1997)025<0259:ABOGIT>2.3.CO;2
Dickson, A., 1993. The measurement of sea water pH. Marine Chemistry. Vol. 44, n°2, p. 131-142, DOI: 10.1016/03044203(93)90198-W
Dickson, A. G., Sabine, C. L. , and Christian, J. R., 2007. Guide to Best Practices for Ocean CO 2 Measurements. Sidney, British Columbia, North Pacific Marine Science Organization, PICES Special Publication 3, 191 pp, https://cdiac.essdive.lbl.gov/ftp/oceans/Handbook_2007/Guide_all_in_one.pdf
Didier, J., and Roche, A., 1999. Vie et oeuvre d’un physicien : Bernard Brunhes (1867-1910), pionnier du géomagnétisme. Comptes rendus de l'Académie des Sciences, Séries IIa, t. 328, no 2, p. 141-152.
Di Martino, E., Jackson, J. B. C., Taylor, P. D., and Johnson, K. G., 2018. Differences in extinction rates drove modern biogeographic patterns of tropical marine biodiversity. Science Advances, Vol. 4, no. 4, eaaq1508, DOI: 10.1126/sciadv.aaq1508
Dimichele, W., Gastaldo, R. A., and Pfefferkorn, H. W., 2005. Plant Biodiversity Partitioning in the Late Carboniferous and Early Permian and Its Implications for Ecosystem Assembly. Proceedings of the California Academy of Sciences, Vol. 56, Supplement I, No. 4, p. 24-41.
Dippery, J. K., Tissue, D. T., Thomas, R. B., Strain, B. R., 1995. Effects of low and elevated CO 2 on C3 and C4 annuals, I. Growth and biomass allocation, Oecologia, Vol. 101, p. 13–20, https://doi.org/10.1007/BF00328894
Djorgovski, G., 2004. Ay 122 - Fall 2004 - Lecture 7, based on "Astronomy: A Physical Perspective" by Marc Kutner and "An Introduction to Modern Astrophysics" by B. Carroll & D. Ostlie, Kutner chaps. 3.5, 9.1 - 9.5, C&O chap. 10, https://www.astro.caltech.edu/~george/ay20/Ay20-Lec7x.pdf
Dole, R., et al., 2011. Was there a basis for anticipating the 2010 Russian heat wave? Geophysical Research Letters, Vol.38, Issue 6, L06702, 5 pp., https://doi.org/10.1029/2010GL046582
Dollfus, A., 1957. Etude des Planètes par la Polarisation de leur Lumière. Suppléments aux Annales d'Astrophysique, Fascicule N°4, 114 pp.
Dollfus, A, Focas, J. H., and Bowel, E., 1969. La planète Mars la nature de sa surface et les propriétés de son atmosphère, d'après la polarisation de sa lumière. Partie II - La nature du Sol de la planète Mars. Astron Astrophys. 2, 63, p. 105-121.
Domeisen, D. I. V., Chaim, I. G, and Butler, A. H., 2018. The Teleconnection of El Niño Southern Oscillation to the Stratosphere. Reviews of Geophysics, Vol. 57, Issue 1, https://doi.org/10.1029/2018RG000596
Domenech, C., 2020. Delphine Batho et François Ruffin veulent instaurer un quota de kilomètres en avion par personne et par an. Capital.fr, July 2, 2020, https://www.capital.fr/economie-politique/delphine-batho-et-francois-ruffin-veulent-instaurer-unquota-de-kilometres-en-avion-par-personne-et-par-an-1374307, accessed and archived on November 26, 2020.
Dommergues, J.-L., and Guiomar, M., 2011. La «Dalle à ammonites de Digne». Étude d’un site fossilifère d’importance patrimoniale. Revue de Paléobiologie, Vol. 30, N° 1, p. 261-293, https://hal.archives-ouvertes.fr/hal-00741464/document
Domingues, C. M., et al. 2008. Improved estimates of upper-ocean warming and multi-decadal sea-level rise. Nature, Vol. 453, Issue 7198, p. 1090-1093, DOI: 10.1038/nature07080
Donald, H. K., et al., 2020. The pH dependency of the boron isotopic composition of diatom opal ( Thalassiosira weissflogii). Biogeosciences, Vol. 17, p. 2825–2837, https://doi.org/10.5194/bg-17-2825-2020
Donders, T.H., et al. 2018. Land–sea coupling of early Pleistocene glacial cycles in the southern North Sea exhibit dominant Northern Hemisphere forcing. Climate of the Past, Vol. 14, n°3, p. 397–411, DOI: 10.5194/cp-14-397-2018
Doney, S. C., 2006. The Dangers of Ocean Acidification. Scientific American, March, Vol. 294, Issue 3, p. 58-65,DOI: 10.1038/scientificamerican0306-58, https://www.geo.arizona.edu/~reiners/geos195K/Doney2006_Cole.pdf
Donohoe, A. and D.S. Battisti, 2011. Atmospheric and Surface Contributions to Planetary Albedo. Journal of Climate, vol. 24, p. 44014418. DOI: 10.1175/2011JCLI3946.1
Donohue, R. J., Roderick, M. L., McVicar, T. R., and Farquhar, G. D., 2013. Impact of CO2 fertilization on maximum foliage cover across the globe's warm, arid environments. Geophysical Research Letters, Vol. 40, Issue 12, p. 3031-3035, https://doi.org/10.1002/grl.50563
Dorale, J. A., et al., 2010. Sea-Level Highstand 81,000 Years Ago in Mallorca. Science, Vol. 327, Issue 5967, p. 860-633, DOI: 10.1126/science.1181725
Dore, J. E., et al., 2009. Physical and biogeochemical modulation of ocean acidification in the central North Pacific. Proc. of the Natl. Acad. of Sci. of the U.S.A., Vol. 106, Issue 30, p. 12235-12240; https://doi.org/10.1073/pnas.0906044106
Douglas, B. C., 1992. Global sea level acceleration. Journal of Geophysical Research, Vol. 97, Issue C8, p. 12,699-12,706, https://doi.org/10.1029/92JC01133
Douglas, B. C., 1997. Global Sea Rise: A Redetermination. Surveys in Geophysics, Vol. 18, p. 279–292, https://doi.org/10.1023/A:1006544227856
Douglass, D. H., and Knox, R. S., 2005. Climate forcing by the volcanic eruption of Mount Pinatubo. Geophysical Research Letters. Vol.32, L05710, DOI:10.1029/2004GL022119.
Dragić, A., et al., 2011. Forbush decreases - Clouds relation in the neutron monitor era. Astrophysics and Space Sciences Transactions, Vol. 7, n°3, p. 315-318, DOI: 10.5194/astra-7-315-2011
Driessen, P., 2015. Climate Crisis, Inc. has become a $1.5 trillion industry. CFACT Insights, August 22nd, https://www.cfact.org/2015/08/22/climate-crisis-inc-has-become-a-1-5-trillion-industry/, accessed and archived on November 5, 2020.
Driscoll, S., Bozzo, A., Gray, L. J., Robock, A., and Stenchikov, G., 2012. Coupled Model Intercomparison Project 5 (CMIP5) simulations of climate following volcanic eruptions. Journal of Geophysical Research, Vol. 117, Issue D17, D17195. https://doi.org/10.1029/2012JD017607
Dronkers, J., Boeije, R., and Misdorp, R., 1990. Socioeconomic, Legal, Institutional, Cultural, and Environmental Aspects of Measures for the Adaptation of Coastal Zones at Risk to Sea Level Rise. In Titus J. G. et al. (Eds.) Changing Climate and the Coast, Vol. 1, Adaptive Responses and their Economic, Environmental, and Institutional Implications, p. 175-194.
Drukier, C., and Ozimek, T., 2022. ESG Is a Globalist ‘Scam’ Meant to Usher In ‘One World Government’: James Lindsay. The Epoch Times, July 23, https://www.theepochtimes.com/esg-is-a-globalist-scam-meant-to-usher-in-one-world-government-jameslindsay_4617189.html, accessed and archived on July 25, 2022.
Druffel, E. R. M., Williams, P. M., Bauer, J. E., Ertel, J. R., 1992. Cycling of Dissolved and Particulate Organic Matter in the Open Ocean. Journal of Geophysical Research Atmospheres, Vol. 971, C10, p. 15639-15659, DOI: 10.1029/92JC01511
Duarte, C.M., et al., 2013. Is Ocean Acidification on an Open-Ocean Syndrome? Understanding Anthropogenic Impacts on Seawater pH. Estuaries and Coasts, Vol. 36, p. 221–236, DOI 10.1007/s12237-013-9594-3
Düben, P. D., et al., 2014. On the use of inexact, pruned hardware in atmospheric modelling. Philosophical Transactions of the Royal Society A, Vol. 372, Article 20130276, 16 pp., https://doi.org/10.1098/rsta.2013.0276
Ducrocq, V., et al., 2014. HyMeXSOP1: The Field Campaign Dedicated to Heavy Precipitation and Flash Flooding in the Northwestern Mediterranean. Bulletin of the American Meteorological Society, American Meteorological Society, Vol. 95, Issue 7, p.10831100, DOI: ff10.1175/BAMS-D-12-00244.1f
Duff, R. E., and Morel, F. M. M., 1980. The geochemical control of seawater (Sillen revisited). Environmental Science & Technology, Vol. 14, n°10, p. 1182-1186.
Dufresne, J.-L., 2009. L'effet de serre: sa découverte, son analyse par la méthode des puissances nettes échangées et les effets de ses variations récentes et futures sur le climat terrestre. Soutenance pour l'habilitation à diriger les recherches, Université Pierre et Marie Curie, Laboratoire de Météorologie Dynamique, Institut Pierre Simon Laplace, 103 pp., https://www.lmd.jussieu.fr/~jldufres/publi/2009/HDR_JLD.pdf
Dufresne, JL., Treiner, J., 2011. L'effet de serre atmosphérique : plus subtil qu'on ne le croit ! Union des Professeurs de Physique et de Chimie, Le Bup n°936, p. 821-840.
Dufresne, JL., Treiner, J., 2011. L'effet de serre atmosphérique : plus subtil qu'on ne le croit !, La Météorologie, n°72, p.31-41.
Dufresne, J-L., 2019. Courrier des lecteurs. L'actualité Chimique n°441, p.87-88.
Dugmore, A. J., Keller, C., McGovern, T. H., Casely, A. F., and Smiarowski, K., 2010. Norse Greenland Settlement and Limits to Adaptation. In book: Adapting to Climate Change Thresholds, Values, Governance, Chapter: 7, Publisher: Cambridge University Press, p. 96-113, DOI: 10.1017/CBO9780511596667.008
Dull, R. A., et al., 2019. Radiocarbon and geologic evidence reveal Ilopango volcano as source of the colossal ‘mystery’ eruption of 539/40 CE. Quaternary Science Reviews, Vol. 222, 105855, https://doi.org/10.1016/j.quascirev.2019.07.037
Duran, J., 2011. Ce site, pour quoi faire ? June 3, 2011, http://www.pensee-unique.fr/pourquoi.html, accessed and archived on September 22, 2020.
Duran, J., 2012. Le débat en cours sur le réchauffement climatique sous la loupe. March 30, 2012, http://www.penseeunique.fr/theses.html, accessed and archived on September 22, 2020.
Duran, J., 2014. Paroles de grands chercheurs sur le réchauffement climatique. January 10, 2014. http://www.penseeunique.fr/paroles.html, accessed and archived on September 22, 2020.
Durand-Manterola, H. J., and Cordero, G., 2014. Assessments of the energy, mass and size of the Chicxulub Impactor. https://arxiv.org/abs/1403.6391
Durden, T., 2020. Triumph Of The Woke Oligarchs. Zerohedge, April 28, 2020, https://www.zerohedge.com/markets/triumph-wokeoligarchs , 5pp, accessed and archived on November 26, 2020.
Durner, G., et al., 2017. Increased Arctic sea ice drift alters adult female polar bear movements and energetics. Global Change Biology, Vol. 23(sp2), 14 pp., DOI: 10.1111/gcb.13746
Du Toit, A. L., 1937. Our Wandering Continents: An Hypothesis of Continental Drifting. Oliver and Boyd, Edinburgh, 366 pp., 48 illustrations.
Duvat, V. K. E., 2018. A global assessment of atoll island platform changes over the past decades. Wiley interdisciplinary reviews: Climate Change, e557, Vol. 10, Issue 1, DOI: 10.1002/wcc.557
Duvat, V. K. E., and Magnan, A., 2019. Rapid human-driven undermining of atoll island capacity to adjust to ocean climate-related pressures. Scientific Reports, Vol. 9, article 15129, https://doi.org/10.1038/s41598-019-51468-3
Duvat, V. K. E., 2020. Human-driven atoll island expansion in the Maldives. Anthropocene, Vol. 32, article 100265, https://doi.org/10.1016/j.ancene.2020.100265
Dyson, F. J., 1949. The Radiation Theories of Tomonaga, Schwinger, and Feynman. Physical Review, Vol. 75, Issue 3, p. 486-502, https://doi.org/10.1103/PhysRev.75.486
Dyson, F. J., 1976. Can we control the Carbon Dioxide in the Atmosphere? Energy, Vol. 2, p. 287-291.
Ebell, M., and Milloy, S. J., 2019. Wrong Again: 50 Years of Failed Eco-pocalyptic Predictions, Competitive Enterprise Institute, September 18, 2019, https://cei.org/blog/wrong-again-50-years-failed-eco-pocalyptic-predictions , accessed and archived on November 3, 2020.
Ébelmen, J. J., 1845. Recherches sur les produits de la décomposition des espèces minérales de la famille des silicates. Annales des Mines, 4e série, t. VII., p. 1415-1453.
Ébelmen, J. J., 1847. Sur la décomposition des roches. Annales des Mines, 12, p. 627-654.
Eddy, J. A., 1976. The Maunder Minimum. Science, Vol. 192, Issue 4245, p. 1189-1202, DOI: 10.1126/science.192.4245.1189
Eddy, J. A., 1977. Climate and the changing sun. Climatic Change, Vol. 1, p. 173–190.
Edvardsson, S., Karlsson, K. G., and Engholm, M., 2002. Accurate spin axes and solar system dynamics: Climatic variations for the Earth and Mars, Astronomy and Astrophysics, Vol. 384, Issue 2, p. 689–701, https://doi.org/10.1051/0004-6361:20020029
Egorova T., et al., 2018a. Revised historical solar irradiance forcing. Astronomy and Astrophysics, Vol. 615, A85, https://doi.org/10.1051/0004-6361/201731199
Egorova, T. A., Rozanov, E., Arsenovic, P., Peter, T. and Schmutz, W., 2018b. Contributions of Natural and Anthropogenic Forcing Agents to the Early 20th Century Warming. Frontiers in Earth Science, Vol. 6, Article 206, 8 pp., DOI: 10.3389/feart.2018.00206
Einstein, A., 1905a. Über einen die Erzeugung und Verwandlung des Lichtes betreffenden heuristischen Gesichtspunkt [On a heuristic point of view concerning the production and transformation of light]. Annalen der Physik, Bern, Eingegangen 18. März 1905, Vol. 17, Issue 132, p. 91-107 [Vol. 322, Issue 6, p. 132-148, https://doi.org/10.1002/andp.19053220607 ]
Einstein, A., 1905b. Über die von der molekularkinetischen Theorie der Wärme geforderte Bewegung von in ruhenden Flüssigkeiten suspendierten Teilchen [On the movement of small particles suspended in stationary liquids required by the milecular-kinetic theory of heat]. Annalen der Physik, Bern, Eingegangen 11. Mai 1905, Vol. 322, Issue 8, p. 549-560, https://doi.org/10.1002/andp.19053220806
Einstein, A., 1905c. Zur Elektrodynamik bewegter Körper [On the electrodynamics of moving bodies]. Annalen der Physik, Bern, Eingegangen 30. Juni 1905, Vol. 332, Issue 10, p. 891-921, https://doi.org/10.1002/andp.19053221004
Einstein, A., 1905d. Ist die Trägheit eines Körpers von seinem Energieinhalt abhängig? [Does the inertia of a body depend upon its energy content?], Annalen der Physik, Eingegangen 27. September, Vol. 323, Issue 13, p. 639-641, https://doi.org/10.1002/andp.19053231314
Einstein, A., 1916. Die Grundlage der allgemeinen Relativitätstheorie [The foundation of the general theory of relativity]. Annalen der Physik, Vol. 354, Issue 7, p. 769-822, http://dx.doi.org/10.1002/andp.19163540702
Einstein, A., 1919. Induktion und Deduktion in der Physik [Induction and Deduction in Physics]. In: Berliner Tageblatt, 25 December 1919, p. [1] of 4. Beiblatt. Retreived in The Collected Papers of Albert Einstein, Translation Vol. 7, Princeton University Press, 2002, p. 108-109, http://alberteinstein.info/vufind1/images/einstein/ear01/view/1/5-191.tr_000012852.pdf, accessed and archived on May 19, 2020.
Eisenman, I., Schneider, T., Battisti, D. S., and Bitz, C. M., 2011. Consistent Changes in the Sea Ice Seasonal Cycle in Response to Global Warming. Journal of Climate, Vol. 24, Issue 20, p. 5325-5335, https://doi.org/10.1175/2011JCLI4051.1
Ekholm, N., 1901. On the Variations of the Climate of the Geological and Historical Past and their Causes Quaterly Journal of the Royal Meteorological Society, Vol. 27, No. 117, p. 1-62, https://doi.org/10.1002/qj.49702711702
Ellis, R., 2013. Equation for Global Warming, Derivation and Application. 15 pp., http://www.globalwarmingequation.info/global %20warming%20eqn.pdf, accessed and archived on September 24, 2020.
Ellsaesser, H. W., 1984. The climatic effect of C02: A different view. Atmospheric Environment, Vol. 18, Issue 2, p. 431-434, https://doi.org/10.1016/0004-6981(84)90118-5
Ellsaesser, H. W., MacCracken, M. C., Walton, J. J., and Grotch, S. L., 1984. Global Climatic Trends as Revealed by the Recorded Data. Reviews of Geophysics, Vol. 24, Issue 4, p. 745-792, DOI: 10.1029/RG024i004p00745
Ellsaesser, H. W., 1991. Comment on "The global warming debate heats up: An analysis and perspective," by S.H. Schneider. Bulletin American Meteorological Society, Vol. 72, n°7, p 1009, https://watermark.silverchair.com/1520-0477-72_7_1009.pdf
Ellsaesser, H. W., 2002. The Current Status of Global Warming. Energy & Environment, p. 125-129, https://doi.org/10.1260/0958305021501128
Emiliani, C., 1954. Temperatures of Pacific Bottom Waters and Polar Superficial Waters during the Tertiary. Science, Vol. 119, Issue 3103, p. 853-855, DOI: 10.1126/science.119.3103.853
English, R., 2013. Incomplete information and the right to know: Climategate’s long tail. UK Human Rights Blog, June 10, 2013, https://ukhumanrightsblog.com/2013/06/10/incomplete-information-and-the-right-to-know-climategates-long-tail/, accessed and archived November 27, 2020.
EPICA CM, 2006. One-to-one coupling of glacial climate variability in Greenland and Antarctica, Nature, Vol. 444, p. 195-198, https://doi.org/10.1038/nature05301
Epstein, S. and Sharp, R., 1967. Oxygen and Hydrogen Isotope Variations in a Firn Core, Eights Station Western Antarctica . Journal of Geophysical Research, Vol. 72, n°22, p. 5595-5598.
Erren, H., 2003a. Langley revisited. March 25, 2004, http://members.casema.nl/errenwijlens/co2/langleyrevdraft2.htm, accessed and archived on November 26, 2020.
Erren, H., 2003b. Arrhenius was wrong. http://members.casema.nl/errenwijlens/co2/arrhrev.htm, accessed and archived on November 26, 2020.
Ericksson, E., and Welander, P., 1956. On a Mathematical Model of the Carbon Cycle in Nature. Tellus VIII(2), p. 155-175, https://doi.org/10.1111/j.2153-3490.1956.tb01207.x
Ermolli, I., et al., 2013. Recent variability of the solar spectral irradiance and its impact on climate modelling. Atmospheric Chemistry Physics, Vol. 13, p. 3945-3977, DOI:10.5194/acp-13-3945-2013
Ersek, V., 2020. How climate change caused the world’s first ever empire to collapse. The Conversation, January 3, 2019, https://theconversation.com/how-climate-change-caused-the-worlds-first-ever-empire-to-collapse-109060, accessed and archived on June 7, 2020.
ESE, 1999. NASA's Earth Science Enterprise, Understanding our Changing Planet. 1999 Fact Book, 23 pp, https://ntrs.nasa.gov/api/citations/19990058181/downloads/19990058181.pdf, accessed and archived on November 1, 2020.
ESHG-Health-02.00. Carbon Dioxide Health Hazard Information Sheet. ESHG FSIS Environmental, Safety and Health Group, 3 pp., https://www.fsis.usda.gov/wps/wcm/connect/bf97edac-77be-4442-aea4-9d2615f376e0/Carbon-Dioxide.pdf?
MOD=AJPERES, accessed and archived on February 5, 2021.
Essenhigh, R. H., 2009. Potential Dependence of Global Warming on the Residence Time (RT) in the Atmosphere of Anthropogenically Sourced Carbon Dioxide. Energy & Fuels, Vol. 23, Issue 5, 2773–2784, https://doi.org/10.1021/ef800581r
Essex, C., McKitrick, R., and Andresen, B., 2007. Does a Global Temperature Exist? Journal of Non-Equilibrium Thermodynamics, Vol.32, No. 1, p. 1-27, https://doi.org/10.1515/JNETDY.2007.001
Essex, C. and Ridley, M., 2016. Foreword to Laframboise "PeerReview, Why Skepticism is Essential". The Global Warming Policy Foundation, 25 pp., https://www.thegwpf.org/content/uploads/2016/10/PeerReview.pdf
Etheridge, D. M. , Steele, L. P., Langenfelds, R. L., et al., 1996. Natural and anthropogenic changes in atmospheric CO 2 over the last 1000 years from air in Antarctic ice and firn. Journal of Geophysical Research, Atmospheres, Vol. 101, Issue D2, p. 4115-4128, https://doi.org/10.1029/95JD03410
Etienne, J.-L., Allen, P. A., Rieu, R., and Le Guerroué, E., 2007. Neoproterozoic glaciated basins: a critical review of the Snowball Earth hypothesis by comparison with Phanerozoic glaciations. In: Glacial Sedimentary Processes and Products, Wiley, p. 343-399, https://doi.org/10.1002/9781444304435.ch19
Everett, S. M., 2013. Structural and Kinetic Studies of Structure I Gas Hydrates via Low Temperature X-Ray Diffraction and High Resolution Neutron Diffraction. Doctoral Dissertation (PhD), University of Tennessee, Knoxville, https://trace.tennessee.edu/utk_graddiss/1718
EWHC 2288, 2007. Dimmock v Secretary of State for Education & Skills. [2007] EWHC 2288 (Admin), [2008] 1 All ER 367, Case No: CO/3615/2007, Royal Courts of Justice Strand, London, WC2A 2LL, http://www.bailii.org/ew/cases/EWHC/Admin/2007/2288.html, accessed and archived on July 6, 2020.
Eyring, V., Bony, S., Meehl, G. A., Senior, C. A., Stevens, B., Stouffer, R. J., and Taylor, K. E., 2016. Overview of the Coupled Model Intercomparison Project Phase 6 (CMIP6) experimental design and organization, Geoscientific Model Development, Vol. 9, p. 1937–1958, https://doi.org/10.5194/gmd-9-1937-2016
Farquhar, G. D., and Roderick, M. L., 2003. Atmospheric science: Pinatubo, diffuse light, and the carbon cycle. Science, Vol. 299, Issue 5615, p. 1997-1998, DOI: 10.1126/science.1080681
Farmer G.T., and Cook J., 2013. Earth’s Albedo, Radiative Forcing and Climate Change. In: Climate Change Science: A Modern Synthesis. Springer, Dordrecht, DOI 10.1007/978-94-007-5757-8_10
Fasullo, J. T., Nerem, R. S., Hamlington, B., 2016. Is the detection of accelerated sea level rise imminent?. Scientific reports, Vol. 6, Article number: 31245, DOI: 10.1038/srep31245
FECYT, 2010. Spanish Foundation for Science and Technology. "Every person emits two tons of carbon dioxide a year through eating, Spanish study finds". ScienceDaily, November 2, 2010, www.sciencedaily.com/releases/2010/11/101102131108.htm, accessed and archived on October 20, 2020.
Fedele, F. G., Giaccio, B., Isaia, R., and Orsi, G., 2002. Ecosystem Impact of the Campanian Ignimbrite Eruption in Late Pleistocene Europe. Quaternary Research, Vol. 57, Issue 3, p. 420-424, https://doi.org/10.1006/qres.2002.2331
Fenero, R., Cotton, L., Molina, E., and Monechi S., 2013. Micropaleontological evidence for the late Oligocene Oi-2b global glaciation event at the Zarabanda section, Spain. Palaeogeography Palaeoclimatology Palaeoecology, Vol.369, 13 pp., DOI: 10.1016/j.palaeo.2012.08.020
Festinger, L., 1957. A theory of cognitive dissonance. First published by Row, Peterson and Cie, Evanston, IL, 291 pp. Fettweis, X., Hanna, E., Gallée, H., Huybrechts, P. and Erpicum, M., 2008. Estimation of the Greenland ice sheet surface mass balance for the 20th and 21st centuries. The Cryosphere, Vol. 2, Issue 2, p. 117–129, https://doi.org/10.5194/tc-2-117-2008
Feyerabend, P., 1978. Science in a Free Society. Schocken Books, 221 p.
Feynman, J., and Ruzmaikin, A., 2011. The Sun's Strange Behavior Maunder Minimum or Gleissberg Cycle. Solar Physics, Vol. 272, Issue 2, p. 351-363, DOI: 10.1007/s11207-011-9828-0
Feynman, J., and Ruzmaikin, A., 2014. The Centennial Gleissberg Cycle and its association with extended minima, Journal of Geophysical Research:Space Physics, Vol. 119, p. 6027-6041, DOI:10.1002/2013JA019478.
Feynman, R., 1965. The Character of Physical Law. The M.I.T. Press, First published by The British Broadcasting Corporation, ISBN 0 262 06016 7 (hardcover), 176 pp.
Feynman, R., 1998. The Meaning of It All - Thoughts of a Citizen-Scientist. Helix Books, Perseus Books, Reading, Massachusetts, ISBN 0-7382-0166-9, 133 pp.
Fichefet, T., et al., 2003. Implications of changes in freshwater flux from the Greenland ice sheet for the climate of the 21st century. Geophysical Research Letters, Vol. 30, Issue 17, 1911, DOI:10.1029/2003GL017826.
Fielding, C. R., Frank, T. D., and Isbell, J. L., 2008. The late Paleozoic ice age—A review of current understanding and synthesis of global climate patterns, in Fielding, C.R., Frank, T.D., and Isbell, J.L., (eds.), Resolving the Late Paleozoic Ice Age in Time and Space: Geological Society of America, Special Paper 441, p. 343–354, DOI: 10.1130/2008.2441(24)
Finkbeiner, A., 2019. Jason—a secretive group of Cold War science advisers—is fighting to survive in the 21st century. science.org, June 27, https://www.science.org/content/article/jason-secretive-group-cold-war-science-advisers-fighting-survive-21stcentury, accessed and archived on August 23, 2022.
Finnegan, S., Bergmann, K., Eiler, J.M., et al., 2011, The magnitude and duration of Late Ordovician–early Silurian glaciation. Science, Vol. 331, p. 903–906, https://doi.org/10.1126/science.1200803
Fischer, H., Wahlen, M., Smith, J., Mastroianni D., and Deck, B., 1999. Ice Core Records of Atmospheric CO2 Around the Last Three Glacial Terminations. Science, Vol. 283, n°5408, p. 1712-1714, DOI: 10.1126/science.283.5408.1712
Fjørtoft, R., 1952. On a Numerical Method of Integrating the Barotropic Vorticity Equation. Tellus, Vol. 4, Issue 3, p. 179-194, https://doi.org/10.1111/j.2153-3490.1952.tb01003.x
Flåten, G. R., 2015. Caterpillar - An adaptive algorithm for detecting process changes from acoustic emission signals. Analytica Chimica Acta, Vol. 544, n°1, p. 280-291, DOI: 10.1016/j.aca.2004.12.043
Flato, G., and Marotzke, J., et al., 2013. Evaluation of Climate Models, Chapter 9, In: Climate Change 2013: The Physical Science Basis. Contribution of Working Group I to the Fifth Assessment Report of the Intergovernmental Panel on Climate Change, Cambridge University Press, p. 741-866, https://www.ipcc.ch/site/assets/uploads/2018/02/WG1AR5_Chapter09_FINAL.pdf, accessed and archived on June 8, 2020.
Fleming, K., et al., 1998. Refining the eustatic sea-level curve since the Last Glacial Maximum using far- and intermediate-field sites. Earth and Planetary Science Letters, Vol. 163, p. 327–342, https://doi.org/10.1016/S0012-821X(98)00198-8
Fluteau, F., 2003. Earth dynamics and climate changes. Comptes Rendus Geoscience, Vol. 335, Issue 1, p. 157-174, https://doi.org/10.1016/S1631-0713(03)00004-X
FMH-1. 1995. Federal Meteorological Handbook No.1, Surface Weather Observations and Reports, FCM-H1-2017, November 30, 2017, https://www.ofcm.gov/publications/fmh/FMH1/FMH1_2017.pdf, accessed and archived on November 26, 2020.
Fogwill, C., Hogg, A., Turney, C., and Thomas, Z., 2021. Earth's magnetic field broke down 42,000 years ago and caused massive sudden climate change. February 19, 2021, https://phys.org/news/2021-02-earthmagnetic-field-broke-years.html, accessed and archived on February 21, 2020.
Folland, C. K., Karl, T. R., and Vinnikov, K. YA., 1990. Observed Climate Variations and Change. IPCC WG1, Chapter 7, p. 199-233, https://www.ipcc.ch/site/assets/uploads/2018/03/ipcc_far_wg_I_chapter_07-1.pdf, accessed and archived on June 16, 2020.
Folland, C. K., Boucher, O., Colman, A., and Parker, D., 2018. Causes of irregularities in trends of global mean surface temperature since the late 19th century. Science Advances, Vol. 4, no. 6, eaao5297, https://doi.org/10.1126/sciadv.aao5297
Forbes, V., 2018. Waves and Tides - Watching Weather Waves, but Missing Climate Tides. https://clexit.net/2018/07/19/waves-andtides/#more-174
Forsyth, P. Y., 1988. In the Wake of Etna, 44 B.C. Classical Antiquity, Vol. 7, n°1, p. 49–57, https://doi.org/10.2307/25010878
Forte, A., Bruckman, A., 2008. Scaling Consensus: Increasing Decentralization in Wikipedia Governance. Proceedings of the 41st Annual Hawaii International Conference on System Sciences (HICSS 2008), ISBN 978-0-7695-3075-8, p. 157-166. CiteSeerX 10.1.1.84.8022, doi:10.1109/HICSS.2008.383, http://andreaforte.net/ForteBruckmanScalingConsensus.pdf
Foscolos, A., E., 2010. Climatic Changes: Anthropogenic Influence or Naturally Induced Phenomenon. Bulletin of the Geological Society of Greece, Proceedings of the 12th International Congress, Patras, May, 2010, XLIII, No 1 – 8 to No 1 – 31, http://geolib.geo.auth.gr/digeo/index.php/bgsg/article/viewFile/6621/6383
Foster, G. L., and Rae, J. W. B., 2016. Reconstructing Ocean pH with Boron Isotopes in Foraminifera. Annual Review of Earth and Planetary Sciences, Vol. 44, p. 207–237, DOI: 10.1146/annurev-earth-060115-012226
Four, J.-M., 2021. À cause de la vague de froid, la Suède importe de l'électricité produite par des centrales à charbon. https://www.francetvinfo.fr/replay-radio/un-monde-d-avance/a-cause-de-la-vague-de-froid-la-suede-importe-de-lelectricite-produite-par-des-centrales-a-charbon_4270463.html, accessed and archived on February 11, 2021.
Fourier, J.-B, 1827. Mémoire sur les températures du globe terrestre et des espaces planétaires. Mémoires de l’Académie Royale des Sciences de l’Institut de France, tome VII, p. 570-604.
Fox, 2011. NASA Top Climate Scientist Arrested on White House Protest. Fox News, August 31, 2011, https://www.foxnews.com/science/nasa-top-climate-scientist-arrested-on-white-house-protest, accessed and archived on October 10, 2020.
Francis, J. E., et al., 2009. From Greenhouse to Icehouse – The Eocene / Oligocene in Antarctica. in: Developments in Earth & Environmental Sciences, Chapter 8, F. Florindo and M. Siegert (eds.), Elsevier, p 311-372, DOI 10.1016/S1571-9197(08)000086
Frank, H., 1994. Ancient Atmosphere - Validity of Ice Records, Foreword Environmental Science and Pollution Research, Vol. 1, n°3, p. 161-171.
Frank, D., Esper, J., Zorita, E., and Wilson, R., 2010. A noodle, hockey stick, and spaghetti plate: A perspective on high-resolution paleoclimatology. Wiley Interdisciplinary Reviews: Climate Change, Vol. 1, p. 507–516, DOI:10.1002/wcc.53
Frank, P., 2008. A Climate of Belief. SKEPTIC, Vol. 14, No. 1, p. 22-30, https://www.skeptic.com/wordpress/wpcontent/uploads/v14n01resources/climate_of_belief.pdf
Frank, P., 2010. Uncertainty in the Global Average Surface Air Temperature Index: A Representative Lower Limit. Energy and Environment, Vol. 21, n°8, p. 969-989
Frank, P., 2015a. Are Climate Modelers Scientists. 24th February, https://wattsupwiththat.com/2015/02/24/are-climate-modelersscientists/, accessed and archived on November 20, 2020
Frank, P., 2015b. Do Climate Projections Have Any Physical Meaning? May 20, https://wattsupwiththat.com/2015/05/20/do-climateprojections-have-any-physical-meaning/ accessed and archived on November 20, 2020
Frank, P., 2016a. Systematic Error in Climate Measurements: The surface air temperature record. The Science and Culture Series — Nuclear Strategy and Peace Technology, International Seminars on Nuclear War and Planetary Emergencies 48th Session, Erice, Sicily, 20 August 2015, pp. 337-351, https://doi.org/10.1142/9789813148994_0026
Frank, P., 2016b. Systematic Error in Climate Measurements: The surface air temperature record. Presented at World Federation of Scientists, Erice, Sicily, 20 August 2015, https://wattsupwiththat.com/2016/04/19/systematic-error-in-climatemeasurements-the-surface-air-temperature-record/, accessed and archived on November 20, 2020.
Frank, P., 2019. Propagation of Error and the Reliability of Global Air Temperature Projections. Frontiers in Earth Science, Vol. 7, p. 223, DOI: 10.3389/feart.2019.0022
Frankignoul, C., Hasselmann, K., 1977. Stochastic climate models, Part II Application to sea-surface temperature anomalies and thermocline variability. Tellus, 24 (4), p. 289–305, https://doi.org/10.3402/tellusa.v29i4.11362
Franklin, F. A., and Soper, P. R., 2003. Some Effects of Mean Motion Resonance Passage on the Relative Migration of Jupiter and Saturn. The Astronomical Journal, Vol. 125, n°5, p. 2678-2691.
Franzke, C., 2012. Nonlinear Trends, Long-Range Dependence, and Climate Noise Properties of Surface Temperature. Journal of Climate, Vol. 25, Issue 12, p. 4172-4183, https://doi.org/10.1175/JCLI-D-11-00293.1
Freeth, S. J., 1994. Lake Nyos: can another disaster be avoided? Geochemical Journal, Vol. 28, Issue 3, p. 163-172, https://doi.org/10.2343/geochemj.28.163
Frick, W., et al., 2017. Fatalities at wind turbines may threaten population viability of a migratory bat. Biological Conservation, Vol.209, p. 172-177, DOI: 10.1016/j.biocon.2017.02.023
Friedman, I., O'Neil, J., and Cebula, G., 1982. Two New Carbonate Stable‐Isotope Standards. Geostandards Newsletter, Vol. 6, Issue 1, p. 11-12, https://doi.org/10.1111/j.1751-908X.1982.tb00340.x
Fudge, T. J., et al., 2016a. Variable relationship between accumulation and temperature in West Antarctica for the past 31,000 years. Geophysical Research Letters, Vol. 48, Issue 8, p. 3795-3803, https://doi.org/10.1002/2016GL068356
Fudge, T. J., et al., 2016b. Electrical stratigraphy of the WAIS Divide ice core: Identification of centimeter‐scale irregular layering. Journal of Geophysical Research Earth Surface, Vol. 121, Issue 7, p. 1218-1229, https://doi.org/10.1002/2016JF003845
Fulks, G. J., 2019. Perhaps Chalmers should consider the scientists? August 31, 2019. https://geoethic.com/2019/08/31/perhapschalmers-should-consider-the-scientists/, accessed and archived on November 27, 2020.
Fuster, J.-J.-N., 1845. Des Changements Dans Le Climat de la France: Histoire de Ses Révolutions Météorologiques, Le climat de la France a changé et change. ISBN-13 : 978-0259070726, 518 pp., http://www.ipgp.fr/~legoff/Download-PDF/SoleilClimat/Fuster1845-changements_climat_France.pdf, accessed and archived on August 15, 2020.
Fyfe, J. C., Meehl, G. A., England, M. H., et al., 2016. Making sense of the early-2000s warming slowdown. Nature Climate Change, Vol. 6, p. 224–228, https://doi.org/10.1038/nclimate2938
Gaillardet, J., 2000. Cycle du carbone - Le cycle géologique du carbone. Planet Terre-ENS de Lyon, September 19, 2000, https://planet-terre.ens-lyon.fr/article/td-cycle-du-carbone2.xml accessed and archived on May 28, 2020.
Gaillardet, J., Calmels D., Romero-Mujalli, G., and Zakharova, E., 2018. Global climate control on carbonate weathering intensity. Chemical Geology, Vol. 527, 11 pp., DOI: 10.1016/j.chemgeo.2018.05.009
Gallet, Y., 2021. The dawn of archeomagnetic dating Académie des sciences, Comptes Rendus Géoscience, Sciences de la Planète, Vol. 353, issue 1, p. 285-296, https://doi.org/10.5802/crgeos.73
Galin, V. Y., Smyshlyaev, S., and Volodin, E., 2007. Combined chemistry-climate model of the atmosphere. Izvestiya Atmospheric and Oceanic Physics, Vol. 43, n°4, p. 399-412, DOI: 10.1134/S0001433807040020
Galvez, M., and Gaillardet, J., 2012. Historical constraints on the origins of the carbon cycle concept. Comptes Rendus Geosciences, Vol. 344, Issues 11–12, p. 549-567, DOI: 10.1016/j.crte.2012.10.006
Galvez, M., 2013. Some Early Roots of Our Carbon Cycle. Published on line for the Deep Carbon Observatory on 04/24/2013, 3 pp., http://deepcarbon.net/content/go-deeper and https://www.researchgate.net/publication/236946869, accessed and archived on May 29, 2020.
Gao, C., Robock, A. , and Ammann, C., 2008. Volcanic forcing of climate over the past 1500 years: An improved ice core-based index for climate models. Journal of Geophysical Research, Vol. 113, Issue D23, D23111, DOI:10.1029/2008JD010239
Gao, Y., et al., 2022. The occupation history of the longest-dwelling Adelie penguin colony reflects Holocene climatic and environmental changes in the Ross Sea, Antarctica. Quaternary Sciences Reviews, Vol. 284, 12 pp., https://doi.org/10.1016/j.quascirev.2022.107494
Garnier, E., 2010. Bassesses Extraordinaires et Grandes Chaleurs - 500 ans de sécheresses et de chaleurs en France et dans les pays limitrophes. La Houille Blanche, n°4, 17 pp., DOI: 10.1051/lhb/2010039
Garnier, E., 2011. Les sociétés méditerranéennes à l’épreuve du climat 1500-1850. Sud-Ouest européen, Revue géographique des Pyrénées et du Sud-Ouest, N°32, p. 21-33, DOI : 10.4000/soe.651, http://journals.openedition.org/soe/651
Garnier, E., 2012. Sécheresses et canicules avant le Global Warming 1500-1950. in Berchtold, J., Le Roy Ladurie , E. (dir.), Canicules et froids extrêmes, Paris, Hermann, 2012, p. 297-325.
Gaspard, P., 2005. Chaos, Scattering and Statistical Mechanics. Cambridge University Press, 470 pp.
Gasparrini, A., et al., 2015. Mortality risk attributable to high and low ambient temperature: a multicountry observational study. The Lancet, Vol. 386, Issue 9991, p. 369-375, https://doi.org/10.1016/S0140-6736(14)62114-0
Gasparrini, A., et al., 2022. Small-area assessment of temperature-related mortality risks in England and Wales: a case time series analysis. The Lancet Planetary Health, Vol. 6, Issue 7, p. e557-e564, https://doi.org/10.1016/S2542-5196(22)00138-3 Gates, W., 2020. COVID-19 is awful. Climate change could be worse. GatesNotes, The Blog of Bill Gates, August 4, 2020, https://www.gatesnotes.com/Energy/Climate-and-COVID-19?WT.mc_id=20200807100000_COVID19-and-Climate_BGLI_&WT.tsrc=BGLI, accessed and archived on August 13, 2020.
Gattuso, J.-P., Frankignoulle, Bourge, I., Romaine, S., and Buddemeier, R. W., 1998. Effect of calcium carbonate saturation of seawater on coral calcification. Global and Planetary Change, Vol. 18, p. 37–46, https://doi.org/10.1016/S09218181(98)00035-6
Gaucher, E., Govindarajan, S., and Ganesh, O., 2008. Palaeotemperature trend for Precambrian life inferred from resurrected proteins. Nature, Vol. 451, Issue 7179, p. 704-707, DOI: 10.1038/nature06510
Gautier, E., et al., 2019. 2600-years of stratospheric volcanism through sulfate isotopes. Nature Communications, Vol.10, Article 466, 7 pp., https://doi.org/10.1038/s41467-019-08357-0
Ge, Q., Liu, H., Ma, X., Zheng, J., and Hao, Z., 2017. Characteristics of Temperature Change in China over the Last 2000 years and Spatial Patterns of Dryness-Wetness during Cold and Warm Periods. Advances in Atmospheric Sciences, Vol. 34, p. 941-951, https://doi.org/10.1007/s00376-017-6238-8
Geirsdóttir, A., et al., 2019. The onset of neoglaciation in Iceland and the 4.2 ka event. Climate of the Past, Vol. 15, p. 25-40, https://doi.org/10.5194/cp-15-25-2019
Geller, R. J., Jackson, D. D., Kagan, Y. K., and Mulargia, F., 1997. Earthquakes Cannot Be Predicted. Science, Vol. 275, Issue 5306, p. 1616-1616, DOI: 10.1126/science.275.5306.1616
Gelles, D., 2022. Stanford Gets $1.1 Billion for New Climate School From John Doerr. The New York Times, May 4, https://www.nytimes.com/2022/05/04/climate/john-doerr-stanford-climate.html , accessed and archived on September 6, 2022.
Genov, G. Y., 2005. Physical processes of the CO 2 hydrate formation and decomposition at conditions relevant to Mars. Dissertation zur Erlangung des Doktorgrades der Mathematisch-Naturwissenschaftlichen Fakultäten der Georg-August-Universität zu Göttingen, https://ediss.uni-goettingen.de/bitstream/handle/11858/00-1735-0000-0006-B57D-6/genov.pdf, accessed and archived on July 29, 2020.
Gennes (de) P.-G., and Badoz, J., 1996. Fragile Objects: Soft Matter, Hard Science, and the Thrill of Discovery. ISBN-13 : 9781461275282, 205 pp.
Gerhart, L. M., and Ward, J. K., 2010. Plant responses to low [CO2] of the past. New Phytologist, Vol. 188, Issue 3, p. 674-695, https://doi.org/10.1111/j.1469-8137.2010.03441.x
Gerlach, T., 2011. Volcanic Versus Anthropogenic Carbon Dioxide. EOS, EOS Transactions, AGU, Vol. 92, n°24, p. 201-208, https://doi.org/10.1029/2011EO240001
Gerlich, G., and Tscheuschner, R. D., 2009. Falsification Of The Atmospheric CO2 Greenhouse Effects Within The Frame Of Physics, International Journal of Modern Physics B, vol. 23, n°3, p. 275–364, DOI: 10.1142/S021797920904984X, http://arxiv.org/PS_cache/arxiv/pdf/0707/0707.1161v4.pdf
Gervais, F., 2014. Tiny warming of residual anthropogenic CO2. International Journal of Modern Physics B, Vol. 28, No. 13, 14500, https://doi.org/10.1142/S021797921450095795
Gervais, F., 2016a. Anthropogenic CO2 warming challenged by 60-year cycle. Earth-Science Reviews, Vol. 155, p 129-135, http://dx.doi.org/10.1016/j.earscirev.2016.02.005
Gervais, F., 2016b. Le réchauffement climatique est-il dû au carbone? Mémoires de l’Académie des Sciences, Arts et Belles-Lettres de Touraine, tome 29, 2016, p. 181-194.
Gervais, F., 2018. L'urgence Climatique est un Leurre. Editions de l'Artilleur, www.lartilleur.fr, ISBN 978-2-810-00962-6, 301 pp.
Gervais, F. 2022. Impasses climatiques: Les contradictions du discours alarmiste sur le climat. Editions l'Artilleur, ISBN-13 978-281000-1111-79, Editions du Toucan, 293 pp.
Gettelman, A., Hannay, C., Bacmeister, J. T., Neale, R. B., Pendergrass, A. G., Danabasoglu, G., and Mills, M. J., 2019. High climate sensitivity in the community Earth system model version 2 (CESM2). Geophysical Research Letters, Vol. 46, p. 8329–8337. https://doi.org/10.1029/2019GL083978
Geuskens, G., 2019. Le réchauffement climatique d’origine anthropique. Science, climat et énergie, February 14, 2019, https://www.science-climat-energie.be/2019/02/14/le-rechauffement-climatique-dorigine-anthropique/, accessed and archived on December 11, 2020.
Giacomelli, L., Perrotta, A., Scandone, R., Scarpati, C., 2003. The eruption of Vesuvius of 79 AD and its impact on human environment in Pompei. Episodes, Vol. 26, n°3, p. 235–238, DOI: 10.18814/epiiugs/2003/v26i3/014
Gibbs, S. J., Bown, P. R., Sessa, J. A., Bralower, T. J., and Wilson, P. A., 2006. Nannoplankton Extinction and Origination Across the Paleocene-Eocene Thermal Maximum. Science, Vol. 314, Issue 5806, p. 1770-1773, DOI: 10.1126/science.1133902
Gilbert, G. K., 1895. Sedimentary Measurement of Cretaceous Time. The Journal of Geology, Vol. 3, No. 2, p. 121-127, https://www.jstor.org/stable/pdf/30054556.pdf
Gill, A. E. 1982. Atmosphere–Ocean Dynamics. International Geophysics Series, Vol. 30, Donn W. L. (Ed.), Academic Press, 662 pp., http://www.scsio.ac.cn/jgsz/glbm/rsjyc/yjsjy/gztz/201607/W020160729627088211986.pdf, accessed and archived on March 20, 2021.
Gilli, E., 2018. Karstodyssée 2016, Analyse des marqueurs eustatiques, tectoniques et tsunamiques dans les karsts littoraux méditerranéens. Rapport de mission, Centre d‟Etude du Karst, Nice, 52 pp., in French, DOI: 10.13140/RG.2.2.33426.15048
Gilliland, R. L., 1989. Solar evolution. Palaeogeography, Palaeoclimatology, Palaeoecology, Vol. 75, Issues 1–2, p. 35-55, https://doi.org/10.1016/0031-0182(89)90183-1
Gilmore, G., and Tausch-Pebody, G., 2021. The 1919 eclipse results that verified general relativity and their later detractors- a story re-told. The Royal Society, Notes and Records, Vol. 76, Issue 1, p. 155-180, https://doi.org/10.1098/rsnr.2020.0040
Giraudeau, J., Cremer, M., Manthé, S., Labeyrie, L., and Bond, G., 2000. Coccolith evidence for instabilities in surface circulation south of Iceland during Holocene times. Earth and Planetary Science Letters, Vol. 179, Issue 2, p. 257-268, https://doi.org/10.1016/S0012-821X(00)00113-8
GISS, 2015. NASA, NOAA Find 2014 Warmest Year in Modern Record. 16 January, https://www.giss.nasa.gov/research/news/20150116/, accessed and archived on November 10, 2020.
Glacken, C. J., 1967. Traces on the Rhodian Shore - nature and culture in Western thought from ancient times to the end of the eighteenth century, Berkeley, University of California Press, ISBN: 9780520032163, 800 pp., https://doi.org/10.1525/9780520343054
Glassman, J. A., 2009. The Acquittal of Carbon Dioxide. Rocket Scientist's Journal, September 2, 2013, http://www.rocketscientistsjournal.com/2006/10/co2_acquittal.html, accessed and archived on November 26, 2020.
Gleick, J., 1987. Chaos: Making a New Science, Open Road Integrated Media, 180 Varick Street, New York, NY 10014, ISBN: 978-14532-1048-2, 376 pp.
Gleissberg, W., 1944. A table of secular variations of the solar cycle. Journal of Geophysical Research, Terrestrial Magnetism and Atmospheric Electricity, Vol. 49, Issue 4, pp. 243-244, https://doi.org/10.1029/TE049i004p00243
Goddard725, S., 2019. Data Tampering Past The Climate Tipping Point. June 24, https://www.youtube.com/watch? v=8tODIRhhV80&feature=youtu.be and https://www.desmogblog.com/steven-goddard
Godwin, B., 2018. Paris Accord Based on Fraud. July 2018 – CLEXIT – Climate Exit, https://clexit.net/2018/07/13/paris-accord-basedon-fraud/, accessed and archived on October 22, 2020.
Godwin, B., 2020. Delay Time for Terrestrial InfraRed Radiation to escape Earth's Atmosphere. August 6, 2020, 18 pp., DOI: 10.13140/RG.2.2.32477.64481, accessed and archived on December 12, 2020.
Goklany, I. M., 2011. Could biofuel policies increase death and disease in developing countries? Journal of American Physicians and Surgeons, Vol. 16, Issue 1, p. 9–13, https://www.jpands.org/vol16no1/goklany.pdf
Goklany, I. M., 2015. Carbon Dioxide, The good news. The Global Warming Policy Foundation, 33 p. plus references, http://www.thegwpf.org/content/uploads/2015/10/benefits1.pdf, accessed and archived on September 24, 2020. Goldberg, M., et al., 2022. A Criterion for the Stability of Planets in Chains of Resonances, DOI: 10.48550/arXiv.2207.13833, accessed and archived on August 9, 2022.
Goldblatt, C., Claire, M. W., Lenton, T. M., Matthews, A. J., Watson, A. J., and Zahnle, K. J., 2009. Nitrogen-enhanced greenhouse warming onearly Earth. Nature Geoscience, Vol. 2, p. 891–896. DOI:10.1038/NGEO692
Goldreich, P., and Nicholson, P. D., 1989a. Tidal friction in early-type stars. Astrophysical Journal, Vol. 342, Issue 2, pp. 1079-1084. Goldreich, P., and Nicholson, P. D., 1989b. Tides in rotating fluids. Astrophysical Journal, Vol. 342, Issue 2, pp. 1075-1078. Goldstein, L., 2017. Demand Investigation of the UAH Shooting! Watts Up With That?, April 26, 2017, https://wattsupwiththat.com/2017/04/26/demand-investigation-of-uah-shooting/, accessed and archived on November 26, 2020.
Golyandina, N. E., and Zhigljavsky, A., 2013. Singular Spectrum Analysis for Time Series. Chapter 2, 61 pp., Basic SSA. Springer, ISBN: 978-3-642-34913-3, Book 119 pp., DOI: 10.1007/978-3-642-34913-3
Goode, P. R., et al., 2021. Earth's albedo 1998–2017 as measured from earthshine. Geophysical Research Letters, Vol. 48, Article: e2021GL094888. https://doi.org/10.1029/2021GL094888
Goody, R. M., 1964. Atmospheric Radiation, Oxford University Press, New York, 436 pp.
Goody, R. M., and Yung, Y. L., 1995. Atmospheric Radiation: Theoretical Basis, 2nd edition, ISBN-13: 978-0195102918, 519 pp.
Goosse H., Barriat, P. Y., Lefebvre, W., Loutre, M. F., and Zunz, V., 2010. Introduction to climate dynamics and climate modeling. Online textbook available at http://www.climate.be/textbook
Gornitz, V., 2012. The Great Ice Meltdown and Rising Seas: Lessons for Tomorrow. NASA GISS Science Briefs, June 2012, https://www.giss.nasa.gov/research/briefs/gornitz_10/, accessed and archived on June 21, 2020.
Gosselin, P. L., and Richard, K., 2014. Papers Supporting a Skeptical-of-the-Consensus Position for 2014. 248 total papers, 147 on natural contributions to climate change (sun, ocean oscillations, clouds). https://notrickszone.com/248-skeptical-papersfrom-2014/
Gosselin, P. L., and Richard, K., 2015. Papers Supporting a Skeptical-of-the-Consensus Position for 2015. 282 peer-reviewed papers published in 2015 supporting the skeptical position that natural factors are in fact a dominant climate driver. https://notrickszone.com/250-skeptic-papers-from-2015/
Gosselin, P. L., and Richard, K., 2016a. Papers Supporting a Skeptical-of-the-Consensus Position for 2016. 500 peer-reviewed papers published in 2016 supporting the skeptical position that natural factors are in fact a dominant climate driver. https://notrickszone.com/skeptic-papers-2016/
Gosselin, P. L., and Richard, K., 2016b. Skeptic Papers 2016 (1), I. Solar Influence On Climate (133), II. Natural Oceanic/Atmospheric Oscillation (ENSO, NAO, AMO, PDO, AMOC) Influence On Climate (45), III. Natural Ozone Variability and Climate (3), IV. A Questionable To Weak Influence Of Humans, CO2 On Climate (12), V. Low CO2 Climate Sensitivity (5), https://notrickszone.com/skeptic-papers-2016-1/
Gosselin, P. L., and Richard, K., 2016c. Skeptic Papers 2016 (2), I. Lack Of Anthropogenic/CO2 Signal In Sea Level Rise (34), II. Warmer Holocene Climate, Non-Hockey Sticks (40), III. No Net Regional Warming Since Early- Mid-20th Century (15), IV. The Uncooperative Cryosphere: Polar Ice Sheets, Sea Ice (34), V. Abrupt, Degrees-Per-Decade Natural Global Warming (Dansgaard-Oeschger Events) (8), VI. Ocean Acidification? (14), VII. Natural Climate Catastrophes – Without CO2 Changes (4), VIII. Recent Cooling In The North Atlantic (3), https://notrickszone.com/skeptic-papers-2016-2/
Gosselin, P. L., and Richard, K., 2016d. Skeptic Papers 2016 (3), I. Failing/Failed Renewable Energy, Climate Policies (10), II. Climate Model Unreliability/Biases and the Pause (34), III. Elevated CO2 Greens Planet, Raises Crop Yields (10), IV. Wind Turbines, Solar Utilities Endangering Wildlife (7), V. Heat Not Hazardous To Polar Bears, Humans (3), VI. Less Extreme, Unstable Weather With Warming (15), VII. No Increasing Trends In Intense Hurricanes (3), VIII. No Increasing Trends In Drought Frequency, Severity (7), IX. Urban Surfaces Cause (Artificial) Warming (4), X. ‘Settled’ Science Dismantled (3), XI. Natural CO2, Methane Sources Out-Emit Humans (3), XII. Fires, Anthropogenic Climate Change Disconnect (5), XIII. Miscellaneous (4), https://notrickszone.com/skeptic-papers-2016-3/ Gosselin, P. L., and Richard, K., 2017a. Skeptic Papers 2017 (1), Solar Influence On Climate (121), ENSO, NAO, AMO, PDO Climate Influence (44), Modern Climate In Phase With Natural Variability (13), Cloud/Aerosol Climate Influence (10), Volcanic/Tectonic Climate Influence (6), The CO2 Greenhouse Effect – Climate Driver? (15), https://notrickszone.com/skepticpapers-2017-1/
725Tony Heller writes under the pen-name of Steven Goddard
Gosselin, P. L., and Richard, K., 2017b. Skeptic Papers 2017 (2), Lack Of Anthropogenic/ CO 2 Signal In Sea Level Rise (39), No Net Warming During 20th (21st) Century (13), A Warmer Past: Non-Hockey Stick Reconstructions (60), Abrupt, Degrees-PerDecade Natural Global Warming (7), A Model-Defying Cryosphere, Polar Ice (34), Antarctic Ice Melting In High Geothermal Heat Flux Areas (4), Recent Cooling In The North Atlantic, Southern Ocean (10), https://notrickszone.com/skeptic-papers2017-2/
Gosselin, P. L., and Richard, K., 2017c. Skeptic Papers 2017 (3), Climate Model Unreliability/Biases/Errors and the Pause (28), Failing Renewable Energy, Climate Policies (12), Wind Power Harming The Environment, Biosphere (8), Elevated CO 2 Greens Planet, Produces Higher Crop Yields (14), Warming Beneficial, Does Not Harm Humans, Wildlife (8), Warming, Acidification Not Harming Oceanic Biosphere (18), Decreases In Extreme, Unstable Weather With Warming (3), Urban Heat Island: Raising Surface Temperatures Artificially (5), No Increasing Trends In Intense Hurricanes (4), No Increasing Trends In Drought/Flood Frequency, Severity (3), Natural CO2, Methane Sources Out-Emit Human Source (4), Increasing Snow Cover Since The 1950s (3), Miscellaneous (7) Scientists: We Don’t Know (3), https://notrickszone.com/skeptic-papers-2017-3/
Gosselin, P. L., and Richard, K., 2018a. Skeptic Papers 2018 (1), 1. Climate Change Observation, Reconstruction (190), No Net Warming Since Mid/Late 20th Century (36), A Warmer Past: Non-Hockey Stick Reconstructions (77), Lack Of Anthropogenic/CO2 Signal In Sea Level Rise (16), Sea Levels Multiple Meters Higher 4,000-7,000 Years Ago (18), A ModelDefying Cryosphere, Polar Ice (34), Mass Extinction Events Caused By Glaciation, Sea Level Fall (3), Antarctic Ice Melting In High Geothermal Heat Flux Areas (2), Abrupt, Degrees-Per-Decade Natural Global Warming (5), https://notrickszone.com/skeptic-papers-2018-1/
Gosselin, P. L., and Richard, K., 2018b. Skeptic Papers 2018 (2), 2. Natural Mechanisms Of Weather, Climate Change (153), Solar Influence On Climate (104), ENSO, NAO, AMO, PDO Climate Influence (22), Modern Climate In Phase With Natural Variability (8), Cloud/Aerosol Climate Influence (4), Volcanic/Tectonic Climate Influence (3), The CO2 Greenhouse Effect – Climate Driver? (13), https://notrickszone.com/skeptic-papers-2018-2/
Gosselin, P. L., and Richard, K., 2018c. Skeptic Papers 2018 (3), 3. Unsettled Science, Failed Climate Modeling (161), Climate Model Unreliability/Biases/Errors (27), Urban Heat Island: Raising Surface Temperatures Artificially (5), Failing Renewable Energy, Climate Policies (18), Wind Power Harming The Environment, Biosphere (19), Elevated CO2: Greens Planet, Higher Crop Yields (20), Polar Bear (and other) Populations Not Decreasing (10), Global Warming Saves Lives. Cold Kills. (9), Warming, Acidification Not Harming Oceanic Biosphere (11), Coral Bleaching Is A Natural, Non-Anthropogenic Phenomenon (2), No Increasing Trends In Intense Hurricanes/Storms (8), No Increasing Trend In Drought/Flood Frequency, Severity (7), Natural CO2 Emissions A Net Source, Not A Net Sink (5), Global Fire Frequency Declining As CO2 Rises (2), CO2 Changes Lag Temperature Changes By 1000+ Years (3), Global Losses/Deaths From Weather Disasters Declining (2), No AGW Changes To Hydrological Cycle Detectable (6), Peak Oil As Myth (3), Miscellaneous (16), https://notrickszone.com/skeptic-papers-2018-3/
Gosselin, P. L., 2018d. Europe’s Top Climate Scientist Loses It: Claims Mankind Now Undergoing Climate-Related “Collective Suicide Attempt”…Rapid “Mass Extinction”! NoTricksZone, May 16, 2018, https://notrickszone.com/2018/05/16/europes-topclimate-scientist-loses-it-claims-mankind-now-undergoing-climate-related-collective-suicide-attempt-rapid-mass-extinctionmass-extinction-event/, accessed and archived on October 28, 2020.
Gosselin, P. L., and Richard, K., 2019a. Skeptic Papers 2019 (1), A Warmer Past: Non-Hockey Stick Reconstructions, https://notrickszone.com/skeptic-papers-2019-1/
Gosselin, P. L., and Richard, K., 2019b. Skeptic Papers 2019 (2), Solar Influence On Climate, https://notrickszone.com/skeptic-papers2019-2/
Gosselin, P. L., and Richard, K., 2019c. Skeptic Papers 2019 (3), Climate Model Unreliability/Biases/Errors and the Pause, https://notrickszone.com/skeptic-papers-2019-3/
Gosselin, P. L., and Richard, K., 2020a. Skeptic Papers 2020 (1), A Warmer Past: Non-Hockey Stick Reconstructions, https://notrickszone.com/skeptic-papers-2020-1/
Gosselin, P. L., and Richard, K., 2020b. Skeptic Papers 2020 (2), Solar Influence On Climate, https://notrickszone.com/skeptic-papers2020-2/
Gosselin, P. L., and Richard, K., 2021a. Skeptic Papers 2021 (2), A Warmer Past: Non-Hockey Stick Reconstructions, https://notrickszone.com/skeptic-papers-2021-1/
Gosselin, P. L., and Richard, K., 2021a. Skeptic Papers 2021 (2), Solar Influence On Climate, https://notrickszone.com/skeptic-papers2021-2/
Gough, C. M., 2011. Terrestrial Primary Production: Fuel for Life. Nature Education Knowledge, 3(10):28, 5 pp., https://www.nature.com/scitable/knowledge/library/terrestrial-primary-production-fuel-for-life-17567411/
Grachev, A. M., and Severinghaus, J., 2005. A revised +10±4 °C magnitude of the abrupt change in Greenland temperature at the Younger Dryas termination using published GISP2 gas isotope data and air thermal diffusion constants. Quaternary Science Reviews, Vol. 24, n°5-6, p. 513-519, DOI: 10.1016/j.quascirev.2004.10.016
Gráda, C. Ó., and Chevet, J.-M., 2002. Famine and Market in Ancien Régime France. The Journal of Economic History, Vol. 62, No. 3, p.706-733, https://www.jstor.org/stable/3132553
Gradstein, F. M., Ogg, J. G., Schmitz, M. D., Ogg, G. M., 2012. The Geologic Time Scale. Elsevier, Oxford (UK), 1176 pp. Gradstein, F. M., Ogg, J. G., and Hilgen, F. J., 2012. On The Geologic Time Scale. Newsletters on Stratigraphy, Vol. 45, Issue 2, p. 171–188, DOI: 10.1127/0078-0421/2012/0020
Graham, R. W., et al., 2016. Timing and causes of mid-Holocene mammoth extinction on St. Paul Island, Alaska. Proc. of the Natl. Acad. of Sci. of the U.S.A., Vol. 113, Issue 33, p. 9310-9314, https://doi.org/10.1073/pnas.1604903113
Grannis, S., 2020. The crisis is over, but at terrible cost. April 12, 2020, http://scottgrannis.blogspot.com/2020/04/the-crisis-is-overbut-at-terrible-cost.html, accessed and archived on November 26, 2020.
Grasso, D., 2018. Assessment of National Oceanic and Atmospheric Administration Scientific Integrity Policies and Procedures as applied to Review of “Possible Artifacts of Data Biases in the Recent Global Surface Warming Hiatus.” MITRE Corporation, Report number: MTR180173V1, 67 pp., DOI: 10.13140/RG.2.2.25837.44003
Gravel, S., Browning, G. L., Caracena, F., and Kreiss, H.-O, 2020. The relative contributions of data sources and forcing components to the large-scale forecast accuracy of an operational model. Unpublished yet, available at http://www.climateaudit.info/pdf/others/browning.pdf, accessed and archived on August 15, 2020.
Graven, H., et al., 2017. Compiled records of carbon isotopes in atmospheric CO2 for historical simulations in CMIP6. Geoscientific Model Development, Vol. 10, p 4405-4417, https://doi.org/10.5194/gmd-10-4405-2017
Graves, T., Gramacy, R., Watkins, N. and Franzke, C., 2017. A brief history of long memory: Hurst, Mandelbrot and the road to ARFIMA, 1951-1980. Entropy, Vol. 19, Issue 9, p. 437, DOI: 10.3390/e19090437
Gray, L. J., Haigh, J. D., Harrison, R. G., 2005. Review of the Influences of Solar Changes on the Earth's Climate, Hadley Centre technical note 62, January, Met Office, 81 pp, accessed and archived from RG on July 18, 2020.
Gray, L. J., et al. 2010. Solar influences on climate. Reviews of Geophysics, Vol. 48, RG4001, 53 pp., https://doi.org/10.1029/2009RG000282
Gray, L. J., et al. 2012. Correction to “Solar influences on climate”. Reviews of Geophysics, Vol. 50, Issue 1, RG1006, https://doi.org/10.1029/2011RG000387
Gray, V., 2008a. Support for a Call for Review of the UN IPCC . New Zealand Climate Science Coalition. Gray, V., 2008b. The Global Warming Scam. 39 pp., http://icecap.us/images/uploads/GLOBALSCAM.pdf, accessed and archived on August 23, 2020.
Gray, V., 2010. South Pacific Sea Level: A Reassessment. Science & Public Policy Institute, SPPI Original Paper, 24 pp., http://scienceandpublicpolicy.org/, accessed and archived on June 8, 2020.
Gray, V., 2011. The Seven Station Series. Energy & Environment, Vol. 22, n°4, p. 429-439, https://doi.org/10.1260/0958305X.22.4.429
Gray, L., 2013. David Attenborough - Humans are plague on Earth. The Telegraph, January 22, 2013, https://www.telegraph.co.uk/news/earth/earthnews/9815862/Humans-are-plague-on-Earth-Attenborough.html, subscription acces.
Greenpeace, 2001. Press release: “Kilimanjaro set to lose its ice field by 2015 due to climate change.” Originally available from http://archive.greenpeace.org/pressreleases/climate/2001nov6.html but it has been suppressed!, https://www.scoop.co.nz/stories/WO0111/S00047.htm, accessed and archived July 28, 2020 and I keep as for all other documents a pdf copy for the reader!
Gregory, K. B., 2013. Water Vapor Decline Cools the Earth: NASA Satellite Data. March 6, 2013, https://friendsofscience.org/assets/documents/Water_Vapor_Decline_Cools_the_Earth__NASA_Satellite_Data.htm, accessed and archived, August 27, 2020.
Gregory, K. B., 2019. Climate Models Are Running too Hot! June 4, 2019, https://blog.friendsofscience.org/2019/06/04/climatemodels-are-running-too-hot/ accessed and archived, September 3, 2020.
Gregory, K. B., 2020. Climate Sensitivity by Energy Balance with Urban and Natural Warming. June 14, 2020, 14 pp., https://blog.friendsofscience.org/wp-content/uploads/2020/06/Climate_Sensitivity_Energy_Balance_Gregory-2020-1.pdf, accessed and archived August 28, 2020.
Greshko, M., 2018. These Ancient Humans Survived a Supervolcano. National Geographic, March 12, 2018, https://www.nationalgeographic.com/news/2018/03/toba-supervolcano-eruption-humans-south-africa-science/, accessed and archived on June 7, 2020.
Griffiths, S. D., and Peltier W. R., 2008. Megatides in the Arctic Ocean under glacial conditions. Geophysical Research Letters, Vol. 35, Issue 8, L08605, https://doi.org/10.1029/2008GL033263
Grinsted, A., Moore, J. C., and Jevrejeva, S., 2009. Reconstructing sea level from paleo and projected temperatures 200 to 2100AD. Climate Dynamics, Vol. 34, n°4, p. 461-472, DOI:10.1007/s00382-008-0507-2.
Grishin, S. Yu., et al., 1996. Succession following the catastrophic eruption of Ksudach volcano (Kamchatka, 1907). Vegetatio, Vol.127, p. 129-153.
Grossmann, C., and Roos, H.-G., 2007. Numerical Treatment of Partial Differential Equations. Translated and revised by Stynes, M., Springer Science & Business Media, ISBN 978-3-540-71584-9, DOI:10.1007/978-3-540-71584-9, https://home.kku.ac.th/wattou/research/resources/e-book/num02.pdf, accessed and archived August 24, 2020.
Grossman, E. L., and Joachimski, M. M., 2022. Ocean temperatures through the Phanerozoic reassessed. Scientific Reports, Vol. 12, Article 8938, https://doi.org/10.1038/s41598-022-11493-1
Gu, L., et al., 2003. Response of a deciduous forest to the Mount Pinatubo eruption: enhanced photosynthesis. Science, Vol. 299, Issue 5615, p. 2035-2038, DOI: 10.1126/science.1078366
Guevara-Murua, A., et al., 2014. Observations of a stratospheric aerosol veil from a tropical volcanic eruption in December 1808: is this the "Unknown" ~1809 eruption? Climate of the Past Discuss., Vol. 10, 1901–1932, DOI: 10.5194/cpd-10-1901-2014
Guillermic, M., et al., 2020. Seawater pH reconstruction using boron isotopes in multiple planktonic foraminifera species with different depth habitats and their potential to constrain pH and p CO2 gradients. Biogeosciences, Vol. 17, p. 3487-3510, DOI: 10.5194/bg-17-3487-2020
Guillevic, M., et al., 2014. Evidence for a three-phase sequence during Heinrich Stadial 4 using a multiproxy approach based on Greenland ice core records. Climate of the Past, Vol. 10, n°6, p. 2115-2133, DOI: 10.5194/cp-10-2115-2014
Guo, Y., et al., 2014. Global variation in the effects of ambient temperature on mortality: a systematic evaluation. Epidemiology, Vol. 25, n°6, p. 781-789, DOI: 10.1097/EDE.0000000000000165
Gurov, E. P., Koeberl, C., and Yamnichenko, A., 2007. El’gygytgyn impact crater, Russia: Structure, tectonics, and morphology. Meteoritics & Planetary Science, Vol. 42, N° 3, p. 307–319, https://doi.org/10.1111/j.1945-5100.2007.tb00235.x
Gutjahr, M., et al., 2017. Very large release of mostly volcanic carbon during the Palaeocene-Eocene Thermal Maximum. Nature, Vol.548, p. 573–577, http://dx.doi.org/10.1038/nature23646
Guyard, H., Chapron, E., St-Onge, G., and Labrie, J., 2013. Late-Holocene NAO and oceanic forcing on high-altitude proglacial sedimentation (Lake Bramant, Western French Alps). The Holocene, Vol. 23, n°8, p. 1163-1172, DOI: 10.1177/0959683613483616
Gwynne, P., 1975. The Cooling World. Newsweek, "Science" section, 28 April 1975, p. 64, http://www.wmconnolley.org.uk/sci/iceage/newsweek-coolingworld.pdf, accessed and archived August 7, 2022. HA, 1952. dates of droughts and "excessive heat" during the approximate period 1152 to 1852. The Hampshire Advertiser, Southampton, Hampshire, England, Saturday, July 17, 1852. The article was a reprint from the original paper from Galignani's messenger726: https://www.newspapers.com/newspage/401721042/
Haan, D., and Raynaud, D., 2002. Ice core record of CO variations during the last two millennia: atmospheric implications and chemical interactions within the Greenland ice. Tellus B, Vol. 50, Issue 3, p. 253-262, https://doi.org/10.1034/j.16000889.1998.t01-2-00004.x
Haberl, H., et al., 2007. Quantifying and mapping the human appropriation of net primary production in earth's terrestrial ecosystems. Proc. of the Natl. Acad. of Sci. of the U.S.A., Vol. 104, n°31, p. 12942-12947, https://doi.org/10.1073/pnas.0704243104
Habicht, M. H., 2015. Examining the Mid-Brunhes Event in the Terrestrial Arctic: an Organic Geochemical Record from Lake El’gygytgyn, Russia. Masters Theses. 272. https://doi.org/10.7275/7486638 https://scholarworks.umass.edu/masters_theses_2/272
Hack, J.J., Boville, B.A. , Briegleb, B.P., Kiehl, J.T., Rasch, P.J., and Williamson, D.L., 1993. Description of the NCAR Community Climate Model (CCM2). NCAR Tech. Note, NCAR/TN-382+STR, National Center for Atmospheric Research, Boulder, CO, 108 pp, https://opensky.ucar.edu/islandora/object/technotes %3A149/datastream/PDF/download/Description_of_the_NCAR_Community_Climate_Model__CCM2_.citation
Haddadi, A., 2015. La Mort Blanche qui Guette les Montagnes d'Azilal. Le360, January 21, 2015, https://fr.le360.ma/societe/la-mortblanche-qui-guette-les-montagnes-dazilal-30277, accessed and archived October 16, 2020.
Hadrien, M., 2014. (alias in fact Beslu, P.) CO2 Coupable Ou Non Coupable ? Mélibée Ed., ISBN-13 : 978-2362524103, 134 pp. https://www.lecolocritique.fr/app/download/8373853495/DP412_light.pdf?t=1441224710, accessed and archived November 26, 2020.
HAHSG, 1992. Heidelberg Appeal to Heads of States and Governments. https://www.heartland.org/publicationsresources/publications/the-heidelberg-appeal, accessed and archived October 6, 2020.
Haigh, J. D., 1996: Impact of solar variability on climate. Science, Vol. 272, Issue 5264, p. 981-984, DOI: 10.1126/science.272.5264.981
Haigh, J. D., 2001. Climate Variability and the Influence of the Sun. Science, Vol. 294, Issue 5549, p. 2109-2111, DOI: 10.1126/science.1067013
Haigh, J. D., 2003. The effect of solar variability on the Earth's climate. Philosophical Transactions of The Royal Society A Mathematical Physical and Engineering Sciences, Vol. 361, Issue 1802, p. 95-111, DOI: 10.1098/rsta.2002.1111
Haigh, J. D., and Blackburn, M., 2006. Solar Influences on Dynamical Coupling Between the Stratosphere and Troposphere. Space Science Reviews, Vol. 125, n°1-4, 15 pp., DOI: 10.1007/978-0-387-48341-2_26
Haigh, J. D., 2007. The Sun and the Earth's Climate. Living Reviews in Solar Physics, Vol. 4, n°2, 59 pp., DOI: 10.12942/lrsp-2007-2
Haine, T., 2016. Vagaries of Atlantic overturning. Nature Geoscience, Vol. 9, p. 479-480, https://doi.org/10.1038/ngeo2748
Hall, J., 1859, Description and figures of the organic remains of the Lower Helderberg group and the Oriskany sandstone: New York Geological Survey: Paleontology, Vol. 3, 532 pp., https://nysl.ptfs.com/awweb/pdfopener? sid=78D437375DE94A83027611E292CD39AA&did=136203&fl=%2FLibrary1%2Fpdf%2F994552368_V3-part1-text.pdf, accessed and archived December 7, 2020.
Hall, J., 1882, Contributions to the geological history of the American continent: American Association for the Advancement of Science, 31st Annual Meeting, Salem, Massachusetts, Salem Press, p. 29–69. Hamid, M., 2018. Vague de froid au Maroc : les instructions de Mohammed VI. November 3, 2018, https://www.afrik.com/vague-defroid-au-maroc-les-instructions-de-mohammed-vi, accessed and archived October 16, 2020.
Hamill, P., Jense, E. J., Russell, P. B., and Bauman, J. J., 1997. The life cycle of stratospheric aerosol particles. Bulletin of the American Meteorological Society, Vol. 78, issue 7, p. 1395-1410, DOI: 10.1175/1520-0477(1997)078<1395:TLCOSA>2.0.CO;2 Hamilton, S. G., and Derocher, A. E., 2018. Assessment of global polar bear abundance and vulnerability. Animal Conservation, Vol.22, Issue 1, p. 83-95, https://doi.org/10.1111/acv.12439
Hamlington, B. D., Milliff, R. F. , van Loon, H., and Kim, K.-Y., 2015. A Southern Hemisphere sea level pressure-based precursor for ENSO warm and cold events. Journal of Geophysical Research: Atmospheres, Vol. 120, p. 2280–2292, doi:10.1002/2014JD022674.
Hammer, C U, et al., 1978, Dating of Greenland ice cores by flow models, isotopes, volcanic debris and continental dust. Journal of Glaciology, Vol. 20, n° 82, p. 3-26, https://doi.org/10.3189/S0022143000021183 https://www.igsoc.org/journal/20/82/igs_journal_vol20_issue082_pg3-26.pdf
726https://en.wikipedia.org/wiki/John_Anthony_Galignani other journals reprinted the Galignani's original paper and can be found at: https://skeptics.stackexchange.com/questions/44011/did-the-the-hampshire-advertiser-publish-an-article-about-many-droughts-in-eur
Hanna, E. and Cappelen, J. 2002a. Recent climate of Southern Greenland. Weather, Vol. 57, Issue 9, p. 320-328, https://doi.org/10.1256/00431650260283497
Hanna, E. and Cappelen, J. 2002b. Recent cooling in coastal southern Greenland and relation with the North Atlantic Oscillation. Geophysical Research Letters, Vol. 30, n°3, p.1132-1-3, doi:10.1029/2002GL015797
Hansen, J., 1981. Climate Impact of Increasing Atmospheric Carbon Dioxide. Science, Vol. 213., Issue 4511, p. 957-966, DOI: 10.1126/science.213.4511.957
Hansen, J., et al., 1984. Climate sensitivity: Analysis of feedback mechanisms. In Climate Processes and Climate Sensitivity. J.E. Hansen and T. Takahashi (eds.), AGU Geophysical Monograph 29, Maurice Ewing Vol. 5. American Geophysical Union, p. 130163.
Hansen, J. E., and Lebedeff, S., 1987. Global trends of measured surface air temperature. Journal of Geophysical Research, Vol. 92 D11, p.13345-13372, DOI: 10.1029/JD092iD11p13345
Hansen, J., et al., 1997. Forcings and chaos in interannual to decadal climate change. Journal of Geophysical Research, Vol. 102, Issue D22, p. 25679-25720, DOI: 10.1029/97JD01495.
Hansen, J. E., 1998. Climate forcings in the industrial era. Proc. of the Natl. Acad. of Sci. of the U.S.A., Vol. 95, Issue 22, p. 1275312758, https://doi.org/10.1073/pnas.95.22.12753
Hansen, J., et al., 2002. Climate forcings in Goddard Institute for Space Studies SI2000 simulations. Journal of Geophysical Research, Vol. 107, n°D18, 4347, 37 pp., DOI: 10.1029/2001JD001143
Hansen, J. E., 2004. Dangerous Anthropogenic Interference, A Discussion of Humanity’s Faustian Climate Bargain and the Payments Coming Due. Presentation on October 26, 2004, in the Distinguished Public Lecture Series at the Department of Physics and Astronomy, University of Iowa, 46 pp, http://www.columbia.edu/~jeh1/2004/dai_complete_20041026.pdf, accessed and archived November 26, 2020.
Hansen, J., et al., 2005. Efficacy of climate forcings. Journal of Geophysical Research, Vol. 110, D18104, DOI: 10.1029/2005JD005776. Hansen, J., Sato, M., Russell, G., and Kharecha, P., 2013a. Climate sensitivity, sea level and atmospheric carbon dioxide. Philosophical Transactions of the Royal Society A, Vol. 371, Issue 2001, 20294, https://doi.org/10.1098/rsta.2012.0294
Hansen, J., Sato, M., and Ruedy, R., 2013b. Global Temperature Update Through 2012. 15 Jan., 7 pp., http://www.columbia.edu/~jeh1/mailings/2013/20130115_Temperature2012.pdf, accessed and archived November 9, 2020.
Hansen, J., Sato, M., and Ruedy, R., 2014. Global Temperature Update Through 2013. 21 Jan., 14 pp., https://citeseerx.ist.psu.edu/viewdoc/download?doi=10.1.1.601.879&rep=rep1&type=pdf, accessed and archived November 9, 2020.
Hansen, K., 2016. Lorenz validated. Climate Etc., October 5, 2016, https://judithcurry.com/2016/10/05/lorenz-validated/, accessed and archived November 26, 2020.
Happer, W., 2003. Harmful Politicization of Science. In: Politicizing Science: The Alchemy of Policymaking, Michael Gough (ed.), George C. Marshall Institute, 313 pp, p. 27-48, accessed and archived November 26, 2020. https://www.hoover.org/sites/default/files/uploads/documents/0817939326_27.pdf
Happer, W., and Lindzen, R., 2022. Comment and Declaration on the SEC’s Proposed Rule “The Enhancement and Standardization of Climate-Related Disclosures for Investors,” File No. S7-10-22, 87 Fed. Reg. 21334. June 17, 2022, CO 2 Coalition, https://co2coalition.org/wp-content/uploads/2022/06/Happer-Lindzen-SEC-6-17-22.pdf, accessed and archived July 26, 2022.
Harari, Y. N., 2015. Sapiens: A Brief History of Humankind. Penguin Random House, Vintage, London, ISBN: 9780099590088, 498pp. Harde, H., 2013. Radiation and Heat Transfer in the Atmosphere: A Comprehensive Approach on a Molecular Basis. International Journal of Atmospheric Sciences, Article ID 503727, 26 pp., https://doi.org/10.1155/2013/503727
Harde, H., 2014. Advanced Two-Layer Climate Model for the Assessment of Global Warming by CO2. Open Journal of Atmospheric and Climate Change, Vol. 1, No. 3, 50 pp., DOI: 10.15764/ACC.2014.03001
Harde, H., 2017a. Radiation Transfer Calculations and Assessment of Global Warming by CO 2 International Journal of Atmospheric Sciences, Vol. 2017, Article ID 9251034, 30 pp., https://doi.org/10.1155/2017/9251034
Harde, H., 2017b. Scrutinizing the carbon cycle and CO2 residence time in the atmosphere. Global and Planetary Change, Vol. 152, pp. 19-26. http://dx.doi.org/10.1016/j.gloplacha.2017.02.009
Harde, H., 2019. What Humans Contribute to Atmospheric CO2: Comparison of Carbon Cycle Models with Observations. Earth Sciences, Vol. 8, n°3, p.139-158. DOI: 10.11648/j.earth.20190803.13
Harde, H., 2022. How Much CO2 and the Sun Contribute to Global Warming: Comparison of Simulated Temperature Trends with Last Century Observations. Science of Climate Change, International Journal of Science and Philosophy, Vol. 1, n°2, pp. N3 1-46, https://doi.org/10.53234/scc202211/xxx
Hardiman, S. C., et al., 2019. The Impact of Prescribed Ozone in Climate Projections Run With HadGEM3-GC3.1. Journal of Advances in Modeling Earth Systems, Vol. 11, Issue 11, p. 3443-3453, http://dx.doi.org/10.1029/2019MS001714
Hards, V., 2005. Volcanic Contributions to the Global Carbon Cycle. Sustainable and Renewable Energy, Occasional Publication n°10, British Geological Survey, 20 pp.
Hardy, D. R., 2011. Kilimanjaro. Chapter from book “Encyclopedia of Snow, Ice and Glaciers”, Singh, V. P., et al. (eds), ISBN: 978-90481-2641-5, p.672-679, DOI: 10.1007/978-90-481-2642-2_315
Hardy, D., 2018. Greatest Snowfall on Kilimanjaro Glaciers in Years. April 4, 2018, https://glacierhub.org/author/doug-hardy/, accessed and archived July 28, 2020.
Haren, P., 1979. Optimal design of Hagen-Cockerall raft. M.S. Thesis, Massachusetts Institute of Technology. Dept. of Civil Engineering, 121 pp., https://dspace.mit.edu/handle/1721.1/57715
Haren, P., and Mei, C.C., 1979. Wave Power Extraction by a Train of Rafts: Hydrodynamic Theory and Optimum Design, Applied Ocean Research, Vol. 1, Issue 3, p. 147-157, DOI: 10.1016/0141-1187(79)90014-2
Haren, P., and Mei, C.C., 1980. Rafts for Absorbing Wave Power. Proceedings 13th Symposium on Naval Hydrodynamics, 6-10 October, 1980, Sasakawa Hall, Tokyo, p. 877-886.
Haren, P., and Mei, C.C., 1981. Head-sea Diffraction by a Slender Raft with Application to Wave-Power Absorption. Journal of Fluid Mechanics, Vol. 104, p. 505-526, https://doi.org/10.1017/S0022112081003029
Haren, P., and Mei, C.C., 1982. An Array of Hagen-Cockerell Wave Power Absorbers in Head Seas. Journal of Applied Ocean Research, Vol. 4, Issue 1, p. 51-56, DOI: 10.1016/S0141-118780021-7
Harmon-Jones, E. and Mills, J., 2019. An Introduction to Cognitive Dissonance Theory and an Overview of Current Perspectives on the Theory. In: Cognitive Dissonance, Second Edition: Reexamining a Pivotal Theory in Psychology, E. Harmon-Jones (ed.), 22 pp., http://dx.doi.org/10.1037/0000135-001
Harpending, H. C., Sherry, S. T., Rogers, A. L., and Stoneking, M., 1993. The genetic structure of ancient human populations. Current Anthropology, Vol. 34, n°4, p. 483–496, DOI: 10.1086/204195
Harper, D. A. T., Hammarlund, E. U., and Rasmussen, C. M. Ø., 2014. End Ordovician extinctions: A coincidence of causes. Gondwana Research,Vol. 25, Issue 4, p. 1294–1307, https://doi.org/10.1016/j.gr.2012.12.021
Harper, J., 2015. An inconvenient truth: 'Climate change industry' now a $1.5 trillion global business. The Washington Times, August 11, 2015, https://www.washingtontimes.com/news/2015/aug/11/climate-change-industry-now-15-trillion-global-bus/, accessed and archived November 5, 2020.
Harries, J. E., et al., 2008. The Far-infrared Earth. Reviews of Geophysics, Vol. 46, Issue 4, RG4004, Paper number 2007RG000233, 34pp., DOI: 10.1029/2007RG000233
Harrison, R. G., and Stephenson, D. B., 2006. Empirical evidence for a nonlinear effect of galactic cosmic rays on clouds. Proceedings of the Royal Society A, Vol. 462, Issue 2068, p. 1221-1233, https://doi.org/10.1098/rspa.2005.1628
Harrison, S., and Stainforth, D., 2009. Predicting Climate Change: Lessons From Reductionism, Emergence, and the Past. EOS, Vol. 90, n°13, p. 111-112, https://agupubs.onlinelibrary.wiley.com/doi/pdf/10.1029/eost2009EO13
Harrison, N. L., and Sachs, J. D., 2022. A Call for an independent inquiry into the origin of the SARS-CoV-2 virus. Proc. of the Natl. Acad. of Sci. of the U.S.A., Vol. 111, no. 21, e2202769119, https://doi.org/10.1073/pnas.2202769119
Harte, J., and Socolow, R. H., 1971. Patient Earth. Holt, Rinehart and Winston, Inc., ISBN: 0-03-085103-3 (Paper), 357 p. Hartley, M. E., and Thordarson, T., 2013. The 1874–1876 volcano‐tectonic episode at Askja, North Iceland: Lateral flow revisited. Geochemistry, Geophysics, Geosystems, Vol. 14, Issue 7, p. 2286-2309, https://doi.org/10.1002/ggge.20151
Hartz, N., and Milthers, V., 1901. Det senglaciale Ler i Allerød Teglværksgrav (The late glacial clay of the clay-pit at Allerød). Meddelelser fra Dansk geologisk Forening (Bulletin of the Geological Society of Denmark), Vol. 2, n°8, p.31-60, https://2dgf.dk/publikationer/bulletin/bulletin-volume-2-1901/ https://2dgf.dk/xpdf/bull-1902-2-2-31-60.pdf
Hasselmann, K., 1976. Stochastic climate models, Part I. Theory. Tellus XXVIII, 6 (31), p. 473-485.
Hatzianastassiou, N., et al., 2005. Global distribution of Earth’s surface shortwave radiation budget. Atmospheric Chemistry and Physics, Vol. 5, p. 2847–2867, https://doi.org/10.5194/acp-5-2847-2005
Hausfather, Z., 2014. How not to calculate temperature. The Blackboard, June 5, 2014, http://rankexploits.com/musings/2014/hownot-to-calculate-temperature/, accessed and archived September 8, 2020.
Hausfather, Z., 2018. Analysis: Fossil-fuel emissions in 2018 increasing at fastest rate for seven years. https://www.carbonbrief.org/analysis-fossil-fuel-emissions-in-2018-increasing-at-fastest-rate-for-seven-years., accessed and archived November 24, 2020.
Hausfather, Z., Drake, H.F., Abbott, T., and Schmidt, G.A. 2019. Evaluating the Performance of Past Climate Model Projections. Geophysical Research Letters, Vol. 47, n°1, DOI: 10.1029/2019GL085378
Hausfather, Z., Marvel, K., Schmidt, G. A.,Nielsen-Gammon; J.-W., and Zelinka, M., 2022. Climate simulations: recognize the ‘hot model’ problem. Nature, Vol. 605, p. 26-29, doi: https://doi.org/10.1038/d41586-022-01192-2
Haverd, V., et al., 2020. Higher than expected CO2 fertilization inferred from leaf to global observations. Global Change Biology, Vol.26, Issue 4, p. 2390-2402, https://doi.org/10.1111/gcb.14950
Hay, W. W., 1996. Tectonics and climate. Geologische Rundschau, Vol. 85, p. 409–437
Hayakawa, H., et al., 2021. Graphical evidence for the solar coronal structure during the Maunder minimum: comparative study of the total eclipse drawings in 1706 and 1715. Journal of Space Weather Space Climate, Vol. 11, n°1, 28 pp., https://doi.org/10.1051/swsc/2020035
Hayek, F. A., 1978. New Studies in Philosophy, Politics, Economics, and the History of Ideas. The University of Chicago Press Books, 322 pp., ISBN: 9780226321288.
Hayes, M., 2013. Bats Killed in Large Numbers at United States Wind Energy Facilities. BioScience, Vol. 63, Issue 12, p. 975-979, DOI: 10.1525/bio.2013.63.12.10
Hayes, M., et al., 2019. A smart curtailment approach for reducing bat fatalities and curtailment time at wind energy facilities. Ecological Applications, Vol. 29 (0169501), e01881, DOI: 10.1002/eap.1881
Hays, J. D., Imbrie, J., Shackleton, N. J., 1976. Variations in the Earth's Orbit: Pacemaker of the Ice Ages. Science, New Series, Vol. 194, Number 4270, p.1121-1132, DOI: 10.1126/science.194.4270.1121
He, S., Wang, H., Li, F., Li, H. and Wang, C., 2020. Solar-wind–magnetosphere energy influences the interannual variability of the northern-hemispheric winter climate. National Science Review, Vol. 7, Issue 1, p. 141–148, https://doi.org/10.1093/nsr/nwz082
Heaton, T. J., 2021. Radiocarbon: A key tracer for studying Earth’s dynamo, climate system, carbon cycle, and Sun. Science, Vol. 374, Issue 6568, Article: eabd7096, 11 pp., DOI: 10.1126/science.abd7096
Heavens, N. G., Ward, D. S., and Natalie, M. M., 2013. Studying and Projecting Climate Change with Earth System Models. Nature Education Knowledge, 4(5):4, https://www.nature.com/scitable/knowledge/library/studying-and-projecting-climate-changewith-earth-103087065/ , accessed and archived June 17, 2020.
Hecht, L., 2007. Cosmoclimatology, Kepler, and Moon’s Model of the Nucleus. EIR Executive Intelligence Review, March 9, p. 19-21, https://larouchepub.com/eiw/public/2007/eirv34n10-20070309/19_710_feat.pdf, accessed and archived November 26, 2020.
Hegerl, G. C., et al., 2006. Detection of Human Influence on a New, Validated 1500-Year Temperature Reconstruction. Journal of Climate, Vol. 20, p. 650-666, DOI: 10.1175/JCLI4011.1
Hegerl, G. C., Brönnimann, S., Schurer, A., and Cowan, T., 2018. The early 20th century warming: Anomalies, causes, and consequences. WIREs (Wiley Interdisciplinary Reviews) Climate Change, Vol. 9, Issue 4, Article e522, https://doi.org/10.1002/wcc.522
Hein, C., and Schirmacher, M., 2016. Impact of Wind Energy on Bats: a Summary of our Current Knowledge. Human-Wildlife Interactions, Vol. 10, p. 19-27, DOI: 10.26077/x7ew-6349
Heinsohn, G., 1994. Vorzeit - Frühzeit - Gegenwart, Interdisziplinäres Bulletin 4/94, Vol. 4, p. 76-81, http://www.xn—zeitensprngellb.de/wp-content/uploads/vfg.1994.4.pdf, accessed and archived July 30, 2020.
Heinrich, H., 1988. Origin and consequences of cyclic ice rafting in the northeast Atlantic Ocean during the past 130,000 years. Quaternary Research, Vol. 29, Issue 2, p. 142-152, https://doi.org/10.1016/0033-5894(88)90057-9
Heiri, O., et al., 2015. Stacking of discontinuous regional palaeoclimate records: Chironomid-based summer temperatures from the Alpine region. The Holocene, Vol. 25, p.137-149, DOI: 10.1177/0959683614556382
Heller, T., 2016. NOAA Adjustments Increase US July Warming By 1,000%. https://realclimatescience.com/2016/08/noaaadjustments-increase-us-july-warming-by-1000/, accessed and archived November 14, 2020.
Helmer, R., 2016. The Lessons of Lysenko. November, 29, 2016, https://rogerhelmermep.wordpress.com/2016/11/29/the-lessonsof-lysenko/, accessed and archived November 26, 2020.
Henderson, D. M., 2010. Pterosaur Body Mass Estimates from Three-Dimensional Mathematical Slicing. Journal of Vertebrate Paleontology, Vol. 30, Issue 3, p. 768–785.
Henderson, D. R., and Hooper, C. L., 2017. Flawed Climate Models. Stanford University, Hoover Institution, April 4, 2017, https://www.hoover.org/research/flawed-climate-models, accessed and archived on November 27, 2020.
Henderson, R., Reinert, S., Dekhtyar, P., Migdal, A., 2017. Climate Change in 2017: Implications for Business. Harvard Business School memo, n°9-317-032, 39pp, https://www.hbs.edu/environment/documents/climate_change_2017.pdf, accessed and archived June 5, 2020.
Hendriks, I. E. , Duarte, C. M. , and Álvarez, M., 2010. Vulnerability of marine biodiversity to ocean acidification: A meta-analysis. Estuarine, Coastal and Shelf Science, Vol. 86, p. 157-164, DOI: 10.1016/j.ecss.2009.11.022
Henehan, M. J., et al. 2019. Rapid ocean acidification and protracted Earth system recovery followed the end-Cretaceous Chicxulub impact. Proc. of the Natl. Acad. of Sci. of the U.S.A., Vol. 116, n°45, p. 22500-22504, https://doi.org/10.1073/pnas.1905989116
Henry, W., 1803. Experiments on the quantity of gases absorbed by water, at different temperatures, and under different pressures. Philosophical Transactions of the Royal Society of London, Vol. 93, p. 29–274. DOI: 10.1098/rstl.1803.0004
Hensch, M., et al., 2019. Deep low-frequency earthquakes reveal ongoing magmatic recharge beneath Laacher See Volcano (Eifel, Germany). Geophysical Journal International, Volume 216, Issue 3, p. 2025–2036, https://doi.org/10.1093/gji/ggy532
Hernández-Almeida, I., Grosjean, M., Przybylak, R., and Tylmann, W., 2015. A chrysophyte-based quantitative reconstruction of winter severity from varved lake sediments in NE Poland during the past millennium and its relationship to natural climate variability. Quaternary Science Reviews, Vol. 122, p. 74-88, https://doi.org/10.1016/j.quascirev.2015.05.029
Herndl, G. J., and Reinthaler, T., 2013. Microbial control of the dark end of the biological pump. Nature Geoscience, Vol. 6, Issue 9, p. 718-724, doi: 10.1038/ngeo1921
Hertz, J., 2004. Historique en grandes enjambées de la thermodynamique de l’équilibre. Journal de Physique IV, Vol. 122, p. 3-20, DOI: 10.1051/jp4:2004122001, https://jp4.journaldephysique.org/articles/jp4/pdf/2004/10/jp4122001.pdf, accessed and archived August 4, 2022.
Hertzberg, M., 2011. History of Encounters with the Sky Dragon, In Book: Slaying the Sky Dragon - Death of the Greenhouse Gas Theory - The Settled Climate Science Revisited, Ball et al. (eds.) Stairway Press, ISBN 978 0 9827734 0 6, p. 151-175. Hertzberg, M., and Schreuder, H., 2016. Role of atmospheric carbon dioxide in climate change. Energy & Environment, Vol. 27, Issue 6-7, p. 785-797, DOI: 10.1177/0958305X16674637
Herschel, W., 1801. Observations tending to investigate the nature of the Sun, in order to find the causes or symptoms of its variable emission of light and heat; With remarks on the use that may possibly be drawn from solar observations. Philosophical Transactions of the Royal Society of London. Vol. 91, p. 265–318.
Herschel, W., 1803. Account of the changes that have happened, during the last twenty-five years, in the relative situation of doublestars; with an investigation of the cause to which they are owing. Proceedings of the Royal Society of London, Vol. 93, https://doi.org/10.1098/rstl.1803.0015
Hessler, I., et al., 2014. Implication of methodological uncertainties for mid-Holocene sea surface temperature reconstructions. Climate of the Past, European Geosciences Union (EGU), Vol. 10, p. 2237-2252. DOI: 10.5194/cp-10-2237-2014
Higgs, R., 2021. Critique Of Geological Society Of London 2020 Scientific Statement On Climate. Geoclastica Technical Note 2021-3 https://www.researchgate.net/publication/350400042_Critique_Of_Geological_Society_Of_London_2020_Scientific_Statem ent_On_Climate
Hill, M. L., Dibblee, T. W., Jr., 1953. San Andreas, Garlock, and Big Pine Faults, California: A Study of the Character, History and Tectonic Significance of their Displacements. Geological Society of America Bulletin, Vol. 64, n°4, p. 443-458, doi:10.1130/0016-7606(1953)64[443:sagabp]2.0.co;2
Hinkel, L., 2018. Chaos and climate - Celebrating two pioneers of modern meteorology. MIT, Earth, Atmospheric and Planetary Sciences, May 18, https://science.mit.edu/chaos-and-climate/ and MIT news https://news.mit.edu/2018/mit-chaos-andclimate-celebration-two-pioneers-modern-meteorology-0214, accessed and archived August 21, 2022.
Hinnov, L.A., 2005. Astronomical signals from Pre-Cenozoic eras. In Berger, A., and Ercegovac, M. (eds.), Milutin Milankovitch 125th Anniversary Symposium: Paleoclimate and the Earth Climate System, Proceedings of the Serbian Academy of Sciences and Arts, Belgrade, Serbia.
Hinnov, L.A., and Park, J., 1998. Detection of astronomical cycles in the sedimentary record by frequency modulation (FM) analysis. Journal of Sedimentary Research, Vol. 68, n°4, p. 524–539, https://doi.org/10.2110/jsr.68.524
Hinnov, L.A., and Goldhammer, RK., 1991. Spectral analysis of the Middle Triassic Latemar Limestone. Journal of Sedimentary Petrology, Vol. 61, n°7, p. 1173- 1193, https://doi.org/10.1306/D4267861-2B26-11D7-8648000102C1865D
HMCTS, 2013. Stephen McIntyre and the Information Commissioner and University of East Anglia, (PDF - Appeal No: EA/2012/0156), HM Courts & Tribunals Service, May 17, 2013, https://www.casemine.com/judgement/uk/5b35bf9d2c94e01ed25519a7 can be read only, accessed November 27, 2020, official site does not answer when checked on November 27, 2020 http://informationrights.decisions.tribunals.gov.uk//DBFiles/Decision/i1014/20130517%20Decision%20EA20120156.pdf
Hodgson, K. A., and Nairn, I. A., 2005. The c. AD 1315 syn-eruption and AD 1904 post-eruption breakout floods from Lake Tarawera, Haroharo caldera, North Island, New Zealand. New Zealand Journal of Geology & Geophysics, Vol. 48, p. 491-506, DOI: 00288306/05/4803-0491
Hoegh-Guldberg, O., et al., 2007. Coral Reefs Under Rapid Climate Change and Ocean Acidification. Science, Vol. 318, Issue 5857, p. 1737-1742, DOI: 10.1126/science.1152509
Hoegh-Guldberg, O. 2012. The adaptation of coral reefs to climate change: Is the Red Queen being outpaced? Scientia Marina, Vol. 76, n°2, p. 403-408, DOI:10.3989/scimar.03660.29A
Hoegh-Guldberg, O. 2014. Coral reef sustainability through adaptation: glimmer of hope or persistent mirage? Current Opinion in Environmental Sustainability, Vol. 7, p. 127-133, DOI: 10.1016/j.cosust.2014.01.005
Hoelzle, M., Haeberli, W., Dischl, M., and Peschke, W., 2003. Secular glacier mass balances derived from cumulative length changes. Global and Planetary Change, Vol. 36, Issue 4, p. 295-306. DOI: 10.1016/S0921-8181(02)00223-0
Hofer, S., Tedstone, A. J., Fettweis, X., and Bamber J. L., 2017. Decreasing cloud cover drives the recent mass loss on the Greenland Ice Sheet. Science Advances, Vol. 3, e1700584, 8 pp., DOI: 10.1126/sciadv.1700584
Hoffert, M. I., and Covey, C., 1992. Deriving global climate sensitivity from palaeoclimate reconstructions. Nature, Vol.360, p.573–576, DOI: 10.1038/360573a0
Hoffman, P. F., et al., 2017. Snowball Earth climate dynamics and Cryogenian geology-geobiology. Science Advances, Vol. 3, e1600983, 43 pp., DOI: 10.1126/sciadv.1600983
Hofmann, G. E., et al., 2011. High-Frequency Dynamics of Ocean pH: A Multi-Ecosystem Comparison. PLOS ONE, Vol. 6, Issue 12, Article: e28983. https://doi.org/10.1371/journal.pone.0028983
Högbom, A. G., 1894. Om sannolikheten för sekulära förändringar i atmosfärens kolsyrehalt (i.e. On the probability of global changes in the level of atmospheric CO2). Svensk kemisk Tidskrift, (Bd. VI. Phil. Mag. S. 5. Vol. 41. No. 251. April 1896), p. 169-177.
Holdaway, A., Ford, M., and Owen S., 2021. Global-scale changes in the area of atoll islands during the 21st century. Anthropocene Vol. 33, Article 100282, https://doi.org/10.1016/j.ancene.2021.100282
Hollande, F., 2015a. Discours pour l’ouverture du forum "Vers la COP 21 : la société civile mobilisée pour le climat", Manille, Feb 26, 2015, https://ph.ambafrance.org/Discours-pour-l-ouverture-du-forum in French or https://ph.ambafrance.org/Speech-ofFrench-President in English, accessed and archived on November 27, 2020.
Hollande, F., 2015b. Address to the 70th session of the UN General Assembly in New York, Sept 28, 2015, starting at 1'56 in French, https://www.youtube.com/watch?v=awIpxM0w4as, accessed on November 27, 2020.
Holman, M., 1994. Symplectic Maps for the N-body Problem with Applications to Solar System Dynamics. Ph.D thesis presented at MIT, May 18, 111 pp.
Holmes, R., 2017. Molar Mass Version of the Ideal Gas Law Points to a Very Low Climate Sensitivity. Earth Sciences, Vol. 6, No. 6, p. 157-163, DOI: 10.11648/j.earth.20170606.18
Holmes, R. I., 2018. Thermal Enhancement on Planetary Bodies and the Relevance of the Molar Mass Version of the Ideal Gas Law to the Null Hypothesis of Climate Change. Earth Sciences, Vol. 7, Issue 3, p. 107-123, doi: 10.11648/j.earth.20180703.13
Holmes, R. I., 2019. On the Apparent Relationship Between Total Solar Irradiance and the Atmospheric Temperature at 1 Bar on Three Terrestrial-type Bodies. Earth Sciences, Vol. 8, Issue 6, p. 346-351, doi: 10.11648/j.earth.20190806.15
Holton, J.R., 1975. The Dynamic Meteorology of the Stratosphere and Mesosphere. American Meteorological Society, Meteorological Monograph, Volume 15, Number 37, Boston, 216 pp. + Index, https://doi.org/10.1007/978-1-935704-31-7
Holton, J. R., et al., 1995. Stratosphere-troposphere exchange. Reviews of Geophysics, Vol. 33, Issue 4, p. 403-439, DOI: 10.1029/95RG02097
Holzhauser H., Magny M. and Zumbühl H.J., 2005. Glacier and lake level variations in western central Europe over the last 3500 years. The Holocene, Vol 15, n°6, p. 789-801. DOI: 10.1191/0959683605hl853ra
Hornborg, A., 2017. How to turn an ocean liner: a proposal for voluntary degrowth by redesigning money for sustainability, justice, and resilience. Journal of Political Ecology, Vol. p. 623-332, DOI: 10.2458/v24i1.20900
Hong, F., and Zhao, X., 2014. Information Manipulation and Climate Agreements. American Journal of Agricultural Economics, Volume 96, Issue 3, p. 851–861, https://doi.org/10.1093/ajae/aau001
Hongyang, L., 2021. Beijing records its coldest day in over 50 years. January 7, 2021, http://www.chinadaily.com.cn/a/202101/07/WS5ff68310a31024ad0baa11a6.html, accessed and archived on September 9, 2022.
Hönish, B., and Hemming, N. G., 2005. Surface ocean pH response to variations in pCO2 through two full glacial cycles. Earth and Planetary Science Letters, Vol. 236, p. 305-314, DOI: 10.1016/j.epsl.2005.04.027
Hood, L. L., and Jirikowic, J. L., 1990. A probable ≡2400 year solar quasi-cycle in atmospheric ∆14C. In: NASA, Goddard Space Flight Center, Climate Impact of Solar Variability Conference, August, p. 98-105, (SEE N91-12456 03-92)
Hooper, C. L., and Henderson, D. R., 2016. A Fatal Flaw with Climate Models. Regulation, Cato Institute, Winter 2016-2017, p. 9-10. Hopkins, R., 2015. Of climates past: 1963, the last time the River Thames froze. https://transitionnetwork.org/news/of-climates-past1963-the-last-time-the-river-thames-froze, accessed and archived on August 11, 2022.
Hoskins, B. J., and Simmons, A. J., 1975. A multi-layet spectral model and the semi-implicit method. Quaterly Journal of The Royal Meteorological Society, Vol. 101, p. 637-655.
Houghton, R. A. , Davidson, E. A., and Woodwe, G. M., 1998. Missing sinks, feedbacks, and understanding the role of terrestrial ecosystems in the global carbon balance. Global Biogeochemical Cycles, Vol. 12, Issue 1, p. 25-34, https://doi.org/10.1029/97GB02729
Hourdin, F., et al., 2017. The Art and Science of Climate Model Tuning. Bulletin of the American Meteorological Society, Vol. 98, Issue 3, p. 589-602, https://doi.org/10.1175/BAMS-D-15-00135.1
Houston, J. R., and Dean, R. G., 2011. Sea-Level Acceleration Based on U.S. Tide Gauges and Extensions of Previous Global-Gauge Analyses. Journal of Coastal Research, Vol. 27, Issue 3, p. 409-417, DOI:10.2112/JCOASTRES-D-10-00157.1
Howard, D., Shaviv, N. J., and Svensmark, H., 2015. The solar and Southern Oscillation components in the satellite altimetry data. Journal of Geophysical Research: Space Physics, Vol. 120, p. 3297-3306. https://doi.org/10.1002/2014JA020732
Hoyle, F., and Wickramasinghe, C., 2001. Cometary impacts and ice-ages. Astrophysics and Space Science, Vol. 275, p. 367–376, https://doi.org/10.1023/A:1002717413720
Hoyt, D. V., and Schatten, K. H., 1993. A discussion of plausible solar irradiance variations. Journal of Geophysical Research Atmospheres, Vol. 98, n°A11, p.18895-18906, DOI: 10.1029/93JA01944
Hoyt, D. V., and Schatten, K. H., 1997. The Role of the Sun in the Climate Change. Oxford Univ Press, New York, 288 p., http://library.uniteddiversity.coop/Climate_Change/The_Role_of_the_Sun_in_Climate_Change.pdf, accessed and archived on July 13, 2020.
HRC, 2009. Long-term forecasting models, in: Report "Longterm meteorological forecasting in Australia" to House of Representatives Committees, https://www.aph.gov.au/Parliamentary_Business/Committees/House_of_Representatives_Committees? url=isi/weather/report/chapter3.pdf, accessed and archived on December 11, 2020.
Hruska, J., 2020. Toba Supervolcano Probably Didn’t Kill Off Most Humans 74,000 Years Ago. February, 27, 2020, https://www.extremetech.com/extreme/306663-the-toba-supervolcano-eruption-probably-didnt-kill-off-most-of-humanity74000-years-ago, accessed and archived on June 7, 2020.
Hu, A., Meehl, G. A., Han, W., et al., 2015. Effects of the Bering Strait closure on AMOC and global climate under different background climates. Progress in Oceanography, Vol. 132, p. 174-196, https://doi.org/10.1016/j.pocean.2014.02.004
Huang, B., et al., 2015. Extended Reconstructed Sea Surface Temperature Version 4 (ERSST.v4). Part I: Upgrades and Intercomparisons. Journal of Climate, Vol. 28, Issue 3, p. 911-930, DOI: 10.1175/JCLI-D-14-00006.1
Huang, B., et al., 2017. Extended Reconstructed Sea Surface Temperature, Version 5 (ERSSTv5): Upgrades, Validations, and Intercomparisons. Journal of Climate, Vol. 30, n°20, p. 8179-8205, https://doi.org/10.1175/JCLI-D-16-0836.1
Huang, C.-Y., Zhao, M., Wang, C.-C., and Wei, G., 2001. Cooling of the South China Sea by the Toba eruption and correlation with other climate proxies 71,000 years ago. ∼ Geophysical Research Letters, Vol. 28, Issue 20, p.3915–3918, https://doi.org/10.1029/2000GL006113
Huang, S. P., Pollack, H. N., and Shen, P.-Y., 2008. A late Quaternary climate reconstruction based on borehole heat flux data, borehole temperature data, and the instrumental record. Geophysical Research Letters, Vol. 35, Issue 13, L13703, 5 pp., https://doi.org/10.1029/2008GL034187
Huang, H.-H., et al., 2015. The Yellowstone magmatic system from the mantle plume to the upper crust. Science, Vol.348, Issue 6236, p. 773-776, DOI: 10.1126/science.aaa5648
Huang, J., Ou, T., Chen, D., Luo, Y., and Zhao, Z., 2019. The amplified Arctic warming in recent decades may have been overestimated by CMIP5 models. Geophysical Research Letters, Vol. 46, Issue 22, p. 13338–13345, https://doi.org/10.1029/2019GL084385
Huang, Y., et al., 2019. Magnetic anomaly map of Shatsky Rise and its implications for oceanic plateau formation. Journal of Geophysical Research: Solid Earth, Vol. 126, e2019JB019116, 27 pp., https://doi.org/10.1029/2019JB019116
Huet, S., 2010. L'imposteur, c'est lui. Réponse à Claude Allègre. Stock, 196 pp., ISBN 978-2234064881
Huet, S., 2016. Climat et débat scientifique : Richard Lindzen est-il crédible ? September 1, 2016, http://sciences.blogs.liberation.fr/2011/11/08/climat-et-debat-scientifique-richard-lindzen-estil-credible-/, accessed and archived on November 27, 2020.
Hugues, P., 1974. Climate: A Key to the World's Food Supply, NOAA Magazine, Vol. 4, Issue 4, 72 pp, accessed and archived on June 23, 2022.
Hulme, M., 2013. How climate models gain and exercise authority. In: Hastrup, Kirsten, The Social Life of Climate Change Models, p.30, https://mikehulme.org/wp-content/uploads/2011/09/Hulme-in-Hastrup-pre-publication.pdf
Hulme, M., 2015. (Still) Disagreeing about Climate Change: Which Way Forward? Zygon, Vol. 50, no. 4, pp. 893-905. https://s3.amazonaws.com/academia.edu.documents/52603944/2015_Hulme_Zygon.pdf
Hulme, M., 2018. Against climate emergency. https://mikehulme.org/against-climate-emergency/# , accessed May 2020.
Humlum, O. 1999. Late-Holocene climate in central West Greenland: meteorological data and rock-glacier isotope evidence. The Holocene , Vol. 9, Issue 5, p. 581-594, https://doi.org/10.1191/095968399671916949
Humlum, O., Stordahl, K., Solheim, J.-E., 2013. The phase relation between atmospheric carbon dioxide and global temperature. Global and Planetary Change, 100, p. 51-69, http://dx.doi.org/10.1016/j.gloplacha.2012.08.008
Humphery-Jenner, M., 2022. HSBC Banker Suspended for Climate Change & ESG Risk Comments. May 24, https://www.youtube.com/watch?v=Ea52ZiobHT8, https://www.unsw.edu.au/staff/mark-humphery-jenner, accessed on July 24, 2022.
Hunt, C. W. , Salisbury, J. E., and Vandemark, D., 2011. Contribution of non-carbonate anions to total alkalinity and overestimation of pCO2 in New England and New Brunswick rivers. Biogeosciences, Vol. 8, p. 3069–3076, DOI: 10.5194/bg-8-3069-2011
Hunter, J., Coleman, R., and Pugh, D., 2003. The sea level at Port Arthur,Tasmania, from 1841 to the present. Geophysical Research Letters, Vol. 30, n°7, 1401, 4 pp., DOI: 10.1029/2002GL016813
Hurrell, J. W., 1995. Comparison of NCAR Community Climate Model (CCM) climates. Climate Dynamics, Vol. 11, p. 25-50
Hurrell, J. W., 1996. Influence of variations in extratropical wintertime teleconnections on Northern Hemisphere temperature. Geophysical Research Letters, Vol. 23, Issue 6, p. 665-668, https://doi.org/10.1029/96GL00459
Hurrell, J. W., et al., 2009. A Unified Modeling Approach to Climate System Prediction. Bulletin of the American Meteorological Society, Vol. 90, Issue 12, p. 1819-1832, DOI: 10.1175/2009BAMS2752.1
Hurst, H. E., 1951. Long term storage capacities of reservoirs. Transactions of the American Society of Civil Engineers, Vol. 116, Issue 1, p. 776–808, https://doi.org/10.1061/TACEAT.0006518
Hurst, H. E., 1956. The Problem of Long-Term Storage in Reservoirs. Hydrological Sciences Journal (Association Internationale d'Hydrologie Scientifique), Vol. 1, Issue 3, p. 13-27, DOI:10.1080/02626665609493644
Husum, K., and Hald, M., 2004. A continuous marine record 8000-1600 cal. yr BP from the Malangenfjord, north Norway : foraminiferal ans isotopic evidence. The Holocene, Vol. 14, n°6, p. 877-887, https://doi.org/10.1191/0959683604hl752rp
Huybers, P., 2005. Comment on ‘Hockey Sticks, Principal Components, and Spurious Significance’ by S. McIntyre and R. McKitrick. Geophysical Research Letters, Vol. 32, Issue 20, L20705, 3 pp., doi:10.1029/2005gl023395.
Huybers, P., and Wunsch, C., 2005. Obliquity pacing of the late Pleistocene glacial terminations. Nature, Vol. 434, Issue 7032, p. 491494, DOI: 10.1038/nature03401
Huybers, P., 2011. Combined obliquity and precession pacing of late Pleistocene deglaciations. Nature, Vol. 480, Issue 7376, p. 229232, DOI: 10.1038/nature10626
ICEF, 2020. ICEF - Governments emergency declaration spreadsheet, Innovation for Cool Earth Forum, https://docs.google.com/spreadsheets/d/1tb-LklFWLujYnjmCSvCWRcLUJCCWAL27dKPzVcFq9CQ/edit#gid=0, accessed and archived on November 27, 2020.
Idso, C. D., 2012. The State of the Earth's Terrestrial Biosphere: How is it responding to rising atmospheric CO 2 and Warmer temperature? Center for the Study of Carbon Dioxide and Global Change, http://www.co2science.org/education/reports/greening/TheStateofEarthsTerrestrialBiosphere.pdf
Idso, C. D., 2013. The Positive Externalities of Carbon Dioxide: Estimating the Monetary Benefits of Rising Atmospheric CO 2 Concentrations on Global Food Production. Center for the Study of Carbon Dioxide and Global Change, http://www.co2science.org/education/reports/co2benefits/MonetaryBenefitsofRisingCO2onGlobalFoodProduction.pdf, 30pp, accessed and archived on August 8, 2020.
Idso, C. D., Carter, R. M., and Singer, S. F., 2013. Climate Change Reconsidered II: Physical Science 2013 Report of the Nongovernmental International Panel on Climate Change (NIPCC), Summary for Policymakers, https://www.heartland.org/_template-assets/documents/CCR/CCR-II/Summary-for-Policymakers.pdf, accessed and archived on November 27, 2020.
Idso, C. D., Carter, R. M., and Singer, S. F., 2015. Why Scientists Disagree About Global Warming: The NIPCC Report on Scientific Consensus. Published for the Nongovernmental International Panel on Climate Change (NIPCC) by The Heartland Institute, ISBN-13 978-1-934791-57-8, 122 pp., https://friendsofscience.org/assets/documents/12-04-15_why_scientists_disagree.pdf, accessed and archived on August 23, 2020.
Idso, C. D., 2019. What Rising CO2 Means for Global Food Security. CO2 Coalition, http://co2coalition.org/wpcontent/uploads/2019/02/Rising_CO2__Food-Security-2-21-19-1.pdf, accessed and archived on August 8, 2020.
Idso, C.D., Legates, D. and Singer, S.F. 2019. Climate Science. In: Climate Change Reconsidered II: Fossil Fuels. Nongovernmental International Panel on Climate Change. Arlington Heights, IL: The Heartland Institute, p. 107-285, http://climatechangereconsidered.org/wp-content/uploads/2018/12/2-Climate-Science-final.pdf , accessed and archived on August 23, 2020.
Indermühle, A., et al., 1999. Holocene carbon-cycle dynamics based on CO 2 trapped in ice at Taylor Dome, Antarctica. Nature, Vol. 398, Issue 6723, p. 121-126, https://doi.org/10.1038/18158
Indermühle, A., Monnin, E., Stauffer, B. and Stocker, T. F., 2000. Atmospheric CO 2 concentration from 60 to 20 kyr BP from the Taylor Dome ice core, Antarctica. Geophysical Research Letters, Vol. 27, n°5, p. 735-738.
Ingole, V., Sheridan, S. C., Juvekar, S., Achebak, H., and Moraga, P., 2022. Mortality risk attributable to high and low ambient temperature in Pune city, India: A time series analysis from 2004 to 2012. Environmental Research, Vol. 204, Part C, article 112304, 7 pp., https://doi.org/10.1016/j.envres.2021.112304
Inhofe, J., 2008. U.S. Senate Minority Report. U.S. Senate Environment and Public Works Committee Minority Staff Report. December 11, 2008. Simpson's quotes p. 3 and p.11. https://www.hsdl.org/?view&did=233163, 231 pp., accessed and archived November 24, 2020.
Inhofe, J., 2012. The Greatest Hoax: How the Global Warming Conspiracy Threatens Your Future. WND Books, ISBN: 9781936488490, 305 pp.
Ioannidis, J. P. A., 2005. Why Most Published Research Findings Are False. PLoS Medicine, Vol. 2, Issue 8, article: e124, p. 0696-0701, https://doi.org/10.1371/journal.pmed.0020124
IPCC, 1996. Climate Change 1995. The IPCC second scientific assessment. Houghton JT, L.G. Meira Filho, B.A. Callander, N. Harris, A., Kattenberg, K. Maskell (eds.), Cambridge University Press, Cambridge, 572 pp.
IPCC, 2000. Emissions Scenarios - Summary for Policymakers. A Special Report of IPCC Working Group III, IPCC, WMO/UNEP, https://www.ipcc.ch/site/assets/uploads/2018/03/sres-en.pdf
IPCC, 2001. Climate Change 2001: The Scientific Basis. Contribution of Working Group I to the Third Assessment Report of the Intergovernmental Panel on Climate Change, Houghton, J.T., Y. Ding, D.J. Griggs, M. Noguer, P.J. van der Linden, X. Dai, K. Maskell, and C.A. Johnson (eds.), Cambridge University Press, Cambridge, United Kingdom and New York, NY, USA, 881pp, https://archive.ipcc.ch/ipccreports/tar/wg1/pdf/WGI_TAR_full_report.pdf
IPCC, 2007a. Intergovernmental Panel on Climate Change, AR4 Climate Change 2007: The Physical Science Basis. Solomon, S., et al. (eds.), Cambridge University Press, 996 pp.
IPCC, 2007b. Intergovernmental Panel on Climate Change, Climate Change 2007: Mitigation of Climate Change. Metz, B, et al. (eds.), Cambridge University Press, 851 pp
IPCC, 2010. IPCC statement on the melting of Himalayan glaciers. https://archive.ipcc.ch/pdf/presentations/himalaya-statement20january2010.pdf, accessed and archived on July 6, 2020.
IPCC, 2012. Managing the Risks of Extreme Events and Disasters to Advance Climate Change Adaptation. A Special Report of Working Groups I and II of the Intergovernmental Panel on Climate Change, Cambridge University Press, Cambridge, UK, and New York, NY, USA, 582 pp, https://www.ipcc.ch/site/assets/uploads/2018/03/SREX_Full_Report-1.pdf
IPCC, 2013a. IPCC AR5 WG1, Climate Change 2013: The Physical Science Basis. Contribution of Working Group I to the Fifth Assessment Report of the Intergovernmental Panel on Climate Change, Stocker, T.F., D. Qin, G.-K. Plattner, M. Tignor, S.K. Allen, J. Boschung, A. Nauels, Y. Xia, V. Bex and P.M. Midgley (eds.), Cambridge University Press, Cambridge, United Kingdom and New York, NY, USA, 1535 pp. https://www.ipcc.ch/report/ar5/wg1/ and https://www.ipcc.ch/site/assets/uploads/2018/02/WG1AR5_all_final.pdf
IPCC, 2013b. Appendix A to the Principles Governing IPCC Work - Procedures for the Preparation, Review, Acceptance, Adoption, Approval and Publication of IPCC Reports. ipcc.ch, September 2018, https://www.ipcc.ch/site/assets/uploads/2018/09/ipccprinciples-appendix-a-final.pdf
IPCC, 2013c. IPCC Factsheet: How does the IPCC approve reports? https://archive.ipcc.ch/, 30 August 2013, https://archive.ipcc.ch/news_and_events/docs/factsheets/FS_ipcc_approve.pdf
IPCC, 2013d. Annex III: Glossary [Planton, S. (ed.)]. In: Climate Change 2013: The Physical Science Basis. Contribution of Working Group I to the Fifth Assessment Report of the Intergovernmental Panel on Climate Change [IPCC, 2013a]. Cambridge University Press, Cambridge, United Kingdom and New York, NY, USA, https://www.ipcc.ch/site/assets/uploads/2018/02/WG1AR5_AnnexIII_FINAL.pdf
IPCC, 2014. Climate Change 2014: Synthesis Report. Contribution of Working Groups I, II and III to the Fifth Assessment Report of the Intergovernmental Panel on Climate Change [Core Writing Team, R.K. Pachauri and L.A. Meyer (eds.)]. IPCC, Geneva, Switzerland, 151 pp.
IPCC, 2018a. Detection of Climate Change and Attribution of Causes, Chapter 12. 44 pp. https://www.ipcc.ch/site/assets/uploads/2018/03/TAR-12.pdf
IPCC, 2018b. Global Warming of 1.5°C. Summary for Policymakers, An IPCC Special Report on the impacts of global warming of 1.5°C, 32 pp., https://report.ipcc.ch/sr15/pdf/sr15_spm_final.pdf
IPCC, 2018c. Technical Summary of the Working Group I Report, 64 pp., Co-ordinating Lead Authors: Albritton, D. L., and Meira Filho, L. G., https://www.ipcc.ch/site/assets/uploads/2018/07/WG1_TAR_TS.pdf, accessed and archived on January 18, 2021. IPCC, 2020. IPCC TRUST FUND PROGRAMME AND BUDGET. FIFTY-SECOND SESSION OF THE IPCC, Paris, France, 24 -28 February 2020, IPCC-LII/Doc. 2, 20.XII.2019, https://www.ipcc.ch/site/assets/uploads/2019/12/201220190208-Doc2-IPCC-Prog.Budget.pdf
IPCC, 2022a. Summary for Policymakers. IPCC_AR6_WGI_SPM, accessed and archived on July 11, 2022, https://www.ipcc.ch/report/ar6/wg1/downloads/report/IPCC_AR6_WGI_SPM.pdf
IPCC, 2022b. Technical Summary. accessed and archived on July 11, 2022, IPCC_AR6_WGI_TS. https://www.ipcc.ch/report/ar6/wg1/downloads/report/IPCC_AR6_WGI_TS.pdf
IPCC, 2022c. Annex X: Expert Reviewers of the IPCC Sixth Assessment Report. accessed and archived on July 11, 2022, https://www.ipcc.ch/report/ar6/wg1/downloads/report/IPCC_AR6_WGI_AnnexX.pdf
IPCC, 2022d. IPCC AR6 WG1, Climate Change 2021: The Physical Science Basis. Contribution of Working Group I to the Fifth Assessment Report of the Intergovernmental Panel on Climate Change, still unavailable whereas SPM and TS have already been released on July, 11, 2022, https://www.ipcc.ch/report/ar6/wg1/ , accessed and not available on July 11, 2022. Iribarne, J. V., and Godson, W. L., 1981. Atmospheric Thermodynamics: 2nd edition, Geophysics and Astrophysics Monographs, Vol.6, Reidel Publishing Company, Dordrecht (Holland), 259 pp, DOI:10.1016/0377-0265(82)90006-9
Isermann, R., and Münchhof, M., 2011. Identification of Dynamic Systems, An Introduction with Applications. e-ISBN 978-3-54078879-9, Springer-Verlag, 710 pp.
http://people.duke.edu/~hpgavin/SystemID/References/Isermann+Munchhof-IdentificationOfDynamicSystems-2011.pdf
Itoh, K., et al., 2018. The Solar Wind and Climate. https://arxiv.org/ftp/arxiv/papers/1807/1807.03976.pdf, accessed and archived on August 6, 2022.
Ivany, L., et al., 2018. Little lasting impact of the Paleocene-Eocene Thermal Maximum on shallow marine molluscan faunas. Science Advances, Vol. 4, Article: eaat5528, 9 pp., DOI: 10.1126/sciadv.aat5528
Jaccard, S. L., et al., 2005. Glacial/interglacial changes in subarctic north pacific stratification. Science, Vol. 308, Issue 5724, p. 10031006, DOI: 10.1126/science.1108696
Jackson, K., 2017. The Global Warming Thought Police Want Skeptics In 'Jail'. Investor's Business Daily, October 24, 2017, https://www.investors.com/politics/commentary/the-global-warming-thought-police-want-skeptics-in-jail/, accessed and archived on November 27, 2020.
Jacob, D. J., 1999. Introduction to Atmospheric Chemistry. Chapter 2: Atmospheric Pressure, Princeton University Press, PDF version: http://acmg.seas.harvard.edu/publications/jacobbook/index.html
Jacoby, S., 2005. Freethinkers, A History of American Secularism. Holt McDougal (ed.), ISBN-13: 978-0805077766, 417pp.
Jackson, K., 2015. Another Climate Alarmist Lets It Slip: Why They Want To Scare You. Investor's Business Daily, August 10, 2015, https://www.investors.com/another-climate-alarmist-admits-what-warming-scare-is-all-about/?ntt=naomi+klein, accessed and archived on November 27, 2020.
Jacobs, G., et al., 1994. Decade-scale trans-Pacific propagation and warming effects of an El Niño anomaly. Nature, Vol.370, Issue 6488, p. 360-363, DOI: 10.1038/370360a0
Jacobson, J. L., 1990. Holding Back the Sea. In: Titus, J. G., Wedge, R., Psuty, N., and Fancher, J., (Eds). Changing Climate and the Coast, Vol. 1, Adaptive Responses and their Economic, Environmental, and Institutional Implications, p. 101-124
Jaffrés, J.B.D., Shileds, G.A., and Wallmann, K., 2007. The oxygen isotope evolution of seawater: a critical review of a long-standing controversy and an improved geological water cycle model for the past 3.4 billion years. Earth Science Reviews, p.83, p. 83122, DOI: 10.1016/j.earscirev.2007.04.002
Jakobsson, M., et al. 2010. New insights on Arctic Quaternary climate variability from palaeorecords and numerical modelling. Quaternary Science Reviews, Vol. 29, Issues 25-26, p. 3349-3358, https://doi.org/10.1016/j.quascirev.2010.08.016
James, F., 2009. Al Gore Slips On Artic Ice; Misstates Scientist's Forecast. The Two-Way, npr.org, December 15, https://www.npr.org/sections/thetwo-way/2009/12/al_gore_trips_on_artic_ice_mis.html, accessed and archived on September 2, 2022.
Jansen, E., J. et al., 2007. Palaeoclimate. In S. Solomon et al. (eds.), Chapter 6, Climate Change 2007: The Physical Science Basis. Contribution of Working Group I to the Fourth Assessment Report of the Intergovernmental Panel on Climate Change, New York: Cambridge University Press, p. 433-484, https://www.ipcc.ch/site/assets/uploads/2018/02/ar4-wg1-chapter6-1.pdf
Järvinen, E., et al., 2018. Additional global climate cooling by clouds due to ice crystal complexity. Atmospheric Chemistry and Physics, Vol. 18, p. 15767-15781, DOI: 10.5194/acp-18-15767-2018
Jaworowski, Z., Segalstad, T.V., and Ono, N., 1992a. Do glaciers tell a true atmospheric CO 2 story? The Science of the Total Environment, Vol. 114, p. 227-284, DOI: 10.1016/0048-9697(92)90428-U
Jaworowski, Z., T. V. Segalstadt, and V. Hisdal, 1992b. Atmospheric CO2 and Global Warming: A critical Review 2nd revised edition, Meddelelser NR. 119, Norsk-Polarinstitutt, 76 pp.
Jaworowski, Z., 1994a. Climate Change: Incorrect information on pre-industrial CO2. Statement written for the Hearing before the US Senate Committee on Commerce, Science, and Transportation, March 19, 5 pp, http://www.warwickhughes.com/icecore/, accessed and archived on November 27, 2020.
Jaworowski, Z., 1994b. Ancient Atmosphere - Validity of Ice Records. Environmental Science and Pollution Research, Vol.1, n°3, p. 161-171, DOI: 10.1007/BF02986939.
Jaworowski , Z., 1997. Ice Core Data Show No Carbon Dioxide Increase. 21st CENTURY, p. 42-52, http://21scitech.com/2006_articles/IceCoreSprg97.pdf
Jaworowski, Z., 2003. Solar Cycles, Not CO2, Determine Climate. 21st CENTURY, p. 52-65. https://21sci-tech.com/Articles %202004/Winter2003-4/global_warming.pdf
Jaworowski, Z., 2004. Climate Change: Incorrect information on pre-industrial CO2. Statement written for the Hearing before the US Senate Committee on Commerce, Science, and Transportation, March 19, 2004. http://www.warwickhughes.com/icecore/, accessed and archived on July 30, 2020.
Jaworowski, Z., 2007. CO2: The Greatest Scientific Scandal of Our Time. EIR Science, p. 38-53, https://www.co2web.info/Jaworowski %20CO2%20EIR%202007.pdf
Jaworowski, Z., 2009. The Sun, Not Man, Still Rules Our Climate. 21st Century Science & Technology, Vol. 10, p. 10-28, https://21scitech.com/Articles_2009/Sun_Climate_sp09.pdf
Jayaraj, V., 2018. The Climate-Change Derangement Syndrome: Undermining Science and Demonizing Skeptics. WUWT, September 4, 2018, https://wattsupwiththat.com/2018/09/04/the-climate-change-derangement-syndrome-undermining-science-anddemonizing-skeptics/, accessed and archived on November 27, 2020.
Jayaraj, V., 2022. Arctic Ice at Decade-High Level: Can Doomsayers Explain? co2coalition.org, August 30, https://co2coalition.org/2022/08/30/arctic-ice-at-decade-high-level-can-doomsayers-explain/ Jenkins, H. W., Jr., 2017. Change Would Be Healthy at U.S. Climate Agencies. The Wall Street Journal, February 4, 2017, http://hockeyschtick.blogspot.com/2017/02/change-would-be-healthy-at-us-climate.html, https://www.wsj.com/articles/change-would-be-healthy-at-u-s-climate-agencies-1486165226, accessed and archived on October 28, 2020.
Jevrejeva, S., Moore, J. C., Grinsted, A., and Woodworth, P. L., 2008. Recent global sea level acceleration started over 200 years ago? Geophysical Research Letters, Vol. 35, L08715, 4 pp., DOI: 10.1029/2008GL033611
Jevrejeva, S., Moore, J. C., Grinsted, A., Matthews, A. P., and Spada, G., 2014. Trends and acceleration in global and regional sea levels since 1807. Global and Planetary Change, Vol. 113, p. 11-22, http://dx.doi.org/10.1016/j.gloplacha.2013.12.004
Jézéquel, A., et al., 2018. Behind the veil of extreme event attribution. Climatic Change, Vol. 149, Issue 6926, p. 1-17, DOI: 10.1007/s10584-018-2252-9
Jiang, J. H., et al., 2012. Evaluation of cloud and water vapor simulations in CMIP5 climate models using NASA “A-Train” satellite observations. Journal of Geophysical Research, Vol. 117, D14, D14105, 24 pp., DOI:10.1029/2011jd017237
Jiang, L.-Q., Carter, B. R., Feely, R. A., Lauvset, S. K., and Olsen, A., 2019. Surface ocean pH and buffer capacity: past, present and future. Nature Scientific Reports, Vol. 9, Article 18624, 11 pp., https://doi.org/10.1038/s41598-019-55039-4
Jiménez-Moreno, G., et al., 2019. Early Pliocene climatic optimum, cooling and early glaciation deduced by terrestrial and marine environmental changes in SW Spain. Global and Planetary Change, Vol. 180, p. 89-99, https://doi.org/10.1016/j.gloplacha.2019.06.002
Joerin, U. E., Stocker, T. F., and Schlüchter, C., 2006. Multicentury glacier fluctuations in the Swiss Alps during the Holocene. The Holocene, Vol. 16, n°5, p. 697-704, DOI: 10.1191/0959683606hl964rp
Joerin, U. E., K. Nicolussi, A. Fischer, T.F. Stocker and C. Schlüchter. 2008. Holocene optimum events inferred from subglacial sediments at Tschierva glacier, Eastern Swiss Alps. Quaternary Science Reviews, Vol. 27, p. 337-350, https://doi.org/10.1016/j.quascirev.2007.10.016
Johnson, B. W. and Goldblatt, C., 2018. EarthN: A New Earth System Nitrogen Model. Geochemistry, Geophysics, Geosystems, Vol. 18, Issue 8, p. 2516-2542, https://doi.org/10.1029/2017GC007392
Jolivet, L., et al., 2016. Neo-Tethys geodynamics and mantle convection: from extension to compression in Africa and a conceptual model for obduction. Canadian journal of earth sciences, National Research Council, Canada, Vol. 53, Issue 11, p. 1-15. DOI: ff10.1139/cjes-2015-0118
Jomelli, V., Favier, V., Rabatel, A., and Brunstein, D., 2009. Fluctuations of glaciers in the tropical Andes over the last millennium and palaeoclimatic implications: A review. Palaeogeography Palaeoclimatology Palaeoecology, Vol.281, n°3, p. 269-282, DOI: 10.1016/j.palaeo.2008.10.033
Jones, C. D., and Cox, P. M., 2005. On the significance of Atmospheric CO2 growth-rate anomalies in 2002-2003. Geophysical Research Letters, Vol. 32, L14816, 4 pp., DOI: 10.1029/2005GL023027
Jones, P., 2004. email from Phil Jones to Tom Wigley dated Fri Sep 24 09:12:10 2004 and obtained through FOIA. https://sealevel.info/FOIA/2011/FOIA/mail/0538.txt, accessed and archived on June 16, 2022.
Jones, N., 2013. Rising waters: How fast and how far will sea levels rise. YaleEnvironment360, October 21, 2013, https://e360.yale.edu/features/rising_waters_how_fast_and_how_far_will_sea_levels_rise , accessed and archived on November 27, 2020.
Joos, F., et al., 2001. Global warming feedbacks on terrestrial carbon uptake under the Intergovernmental Panel on Climate Change (IPCC) Emission Scenarios. Global Biogeochemical Cycles, Vol. 15, Issue 4, p. 891-907, https://doi.org/10.1029/2000GB001375
Joos, F., et al., 2013. Carbon dioxide and climate impulse response functions for the computation of greenhouse gas metrics: A multimodel analysis. Atmospheric Chemistry and Physics, Vol. 13, p. 2793–2825, DOI: 10.5194/acp-13-2793-2013.
Jose, P. D., 1965. Sun's Motion and Sunspots. The Astronomical Journal, Vol. 70, n°3, p. 193-200, DOI: 10.1086/109714
Jouzel, J., et al., 1997. Validity of the Temperature Reconstruction from Water Isotopes in Ice Cores. Journal of Geophysical Research Atmospheres, Vol. 102, NO. C12, , p. 26,471-26,487, DOI: 10.1029/97JC01283
Jouzel, J., 1999. Calibrating the isotopic paleothermometer. Science, Vol. 286, Issue 5441, p. 910–911, DOI: 10.1126/science.286.5441.910
Jouzel, J., Vimeux, F., Caillon, N., Delaygue, G., Hoffmann, G., et al., 2003. Magnitude of isotope/temperature scaling for interpretation of central Antarctic ice cores. Journal of Geophysical Research, Vol. 108, Issue 4361, D12, 10 pp+Figs, doi:10.1029/2002JD002677
Jouzel, J., et al. 2007. Orbital and millennial Antarctic climate variability over the past 800,000 years. Science, Vol. 317, Issue 5839, p.793-796, DOI: 10.1126/science.1141038
Jouzel, J., 2013. A brief history of ice core science over the last 50 yr. Climate of the Past. Vol. 9., p. 2525-2547, DOI: 10.5194/cp-92525-2013
Judge, P. G., Egeland, R., and Henry, G. W., 2020. Sun-like Stars Shed Light on Solar Climate Forcing. The Astrophysical Journal, Vol.891, No.1, p. 96-102, https://doi.org/10.3847/1538-4357/ab72a9
Jungclaus, J. H. , Haak, H., Esch, M., Roeckner, E., and Marotzke, J., 2006. Will Greenland melting halt the thermohaline circulation? Geophysical Research Letters, Vol. 33, Issue 17, L17708, 5 pp., DOI: 10.1029/2006GL026815
Jursa, A. S., 1985. Handbook of Geophysics and the Space Environment. Air Force Research Laboratory, http://www.cnofs.org/Handbook_of_Geophysics_1985/pdf_menu.htm
Kaiser, J., Lamy, F., and Hebbeln, D., 2005. A 70-kyr sea surface temperature record off southern Chile (Ocean Drilling Program Site 1233). Paleoceanography, Vol. 20, PA4009, DOI: 10.1029/2004PA001146
Kalis, A. J., Merkt, J., and Wunderlich, J., 2003. Environmental changes during the Holocene climatic optimum in central Europe. Quaternary Science Reviews, Vol. 22, p. 33-79, DOI: 10.1016/S0277-3791(02)00181-6
Kallenrode, M.-B., 2006. Physik der Atmosphäre. Osnabruck, 15. Mai, 464 pp, https://repositorium.ub.uniosnabrueck.de/bitstream/urn:nbn:de:gbv:700-2017080716106/6/atmo-master.pdf, accessed and archived on July 20, 2020. Kalnay, E., et al., 1996. The NCEP/NCAR Reanalysis 40-year Project. Bulletin of the American Meteorological Society, Vol. 77, Issue 3, p. 437-472, DOI: 10.1175/1520-0477(1996)077<0437:TNYRP>2.0.CO;2
Kamath, R. and Kamath R. C., 2020. Influence of Solar Minimum on Cosmic Ray Flux, Mutations in viruses and Pandemics Like COVID19. Available at SSRN, Social Science Research Network, 8 pp., https://ssrn.com/abstract=3593151 or http://dx.doi.org/10.2139/ssrn.3593151
Kane, E. K., 1856. Arctic Explorations, Nelson & Sons., London, 170 pp.
Kanter, J., 2007. Carbon trading: Where greed is green. The New York Times, June 20, https://www.nytimes.com/2007/06/20/business/worldbusiness/20iht-money.4.6234700.html?_r=1, accessed and archived on November 2, 2020.
Karl, T. R., Diaz, H. F., and Kukla, G., 1988. Urbanization: Its Detection and Effect in the United States Climate Record. Journal of Climate, Vol. 11, p. 1099-1123, DOI: 10.1175/1520-0442(1988)001<1099:UIDAEI>2.0.CO;2 Karl, T. R., et al., 2015. Possible artifacts of data biases in the recent global surface warming hiatus. Science Vol. 348, Issue 6242, 4pp., DOI: 10.1126/science.aaa5632
Karoly, D. J., and Stott, P. A., 2006. Anthropogenic warming of central England temperature. Royal Meteorological Society, Atmospheric Science Letters, Vol. 7, Issue 4, p. 81-85, https://doi.org/10.1002/asl.136
Kasahara, A., and Washington, W.M., 1967. NCAR Global General Circulation Model of the Atmosphere. Monthly Weather Review, Vol. 95, No. 7, p. 389-402, DOI: 10.1175/1520-0493(1967)095<0389:NGGCMO>2.3.CO;2
Kasprak, A., 2019. Did UN Official Say Nations Would Vanish If Global Warming Not Reversed by 2000? snopes.com, September 20, https://www.snopes.com/fact-check/nations-vanish-global-warming/, accessed and archived on September 2, 2021.
Kasting, J. F., and Ackerman, T. P., 1986. Climatic consequences of very high carbon dioxide levels in the Earth’s early atmosphere. Science, Vol. 234, p. 1383–1386, DOI: 10.1126/science.11539665
Kasting, J. F., 1987. Runaway and Moist Greenhouse Atmospheres and the Evolution of Earth and Venus. ICARUS, Vol.74, p.472-494, http://doi.org/10.1016/0019-1035(88)90116-9
Kasting, J. F., 1993. Earth's Early Atmosphere. Science, New Series, Vol. 259, No. 5097, p. 920-926, http://www.jstor.org/stable/2880609, https://ebme.marine.rutgers.edu/HistoryEarthSystems/HistEarthSystems_Fall2008/Week1b/Kasting_Science_1993.pdf
Kaufman, A. J., and Xiao, S., 2003. High CO2 levels in the Proterozoic atmosphere estimated from analyses of individual microfossils. Nature, Vol. 425, p. 279-282, https://doi.org/10.1038/nature01902
Kaufman, D. S., et al., 2009. Recent Warming Reverses Long-Term Arctic Cooling. Science, Vol. 325, Issue 5945, p. 1236-1239, DOI: 10.1126/science.1173983
Kay, J. E., et al., 2015. The Community Earth System Model (CESM) Large Ensemble Project: A Community Resource for Studying Climate Change in the Presence of Internal Climate Variability. Bulletin of the American Meteorological Society, Vol. 96, Issue 8, p. 1333-1349, https://doi.org/10.1175/BAMS-D-13-00255.1
Keeling , C. D., et al., 1976. Atmospheric carbon dioxide variations at Mauna Loa Observatory, Hawaii. Tellus XXVIII, Vol. 6, p. 538551, https://doi.org/10.1111/j.2153-3490.1976.tb00701.x
Keeling, C. D., 1979. The Suess effect: 13Carbon-14Carbon interrelations. Environment International, Vol. 2, Issues 4-6, p.229-300, DOI:10.1016/0160-4120(79)90005-9
Keeling, C. D., et al., 2005. Atmospheric CO2 and 13CO2 exchange with the terrestrial biosphere and oceans from 1978 to 2000: observations and carbon cycle implications, in "A History of Atmospheric CO2 and its effects on Plants, Animals, and Ecosystems", Ehleringer, J.R., T. E. Cerling, M. D. Dearing (eds.), Springer Verlag, New York, p. 83-113.
Keeling, R. F., et al., 2017. Atmospheric evidence for a global secular increase in carbon isotopic discrimination of land photosynthesis. Proc. of the Natl. Acad. of Sci. of the U.S.A., Vol. 114, issue 39, p. 10361-10366 https://doi.org/10.1073/pnas.161924011
Keenan, T.F., et al. 2016. Recent pause in the growth rate of atmospheric CO 2 due to enhanced terrestrial carbon uptake. Nature communications, Vol. 7, Article number: 13428, DOI: 10.1038/ncomms13428
Keller, G., Sahni, A. and Bajpai, S., 2009. Deccan volcanism, the KT mass extinction and dinosaurs. Journal of Biosciences, Vol. 34, Issue 5, p. 709-728, DOI: 10.1007/s12038-009-0059-6
Kellert, S. H., 1993. In the Wake of Chaos: Unpredictable Order in Dynamical Systems. University of Chicago Press. p. 32. ISBN 978-0226-42976-2.
Kellogg, L. H., Turcotte, D. L., and Lokavarapu, H., 2019. On the Role of the Urey Reaction in Extracting Carbon From the Earth's Atmosphere and Adding It to the Continental Crust. Frontiers in Astronomy and Space Sciences, Vol. 6, Article 62, 8 pp., DOI: 10.3389/fspas.2019.00062
Kellogg, W. W., and Mead, M., 1980. The Atmosphere Endangered And Endangering. Castle House Publications Ltd., 154 pp., https://ia801607.us.archive.org/0/items/in.ernet.dli.2015.132143/2015.132143.The-Atmosphere-Endangered-AndEndangering.pdf
Kemp, D. B., 2016. Optimizing significance testing of astronomical forcing in cyclostratigraphy. Paleoceanography, Vol.31, p. 1516–1531, DOI: 10.1002/2016PA002963.
Kemp, L., et al., 2022. Climate Endgame: Exploring catastrophic climate change scenarios. Proc. of the Natl. Acad. of Sci. of the U.S.A., Vol. 119, No. 34, article: e2108146119, 9 pp., https://doi.org/10.1073/pnas.210814611
Kephart, J. L., et al., 2022. City-level impact of extreme temperatures and mortality in Latin America. Nature Medicine, 12 pp., https://doi.org/10.1038/s41591-022-01872-6
Kern, A.K. , Harzhauser, M., Piller, W.E., Mandic, O., and Soliman, A., 2012. Strong evidence for the influence of solar cycles on a Late Miocene lake system revealed by biotic and abiotic proxies. Palaeogeography. Palaeoclimatology. Palaeoecology.. Vol. 329330(5), p. 124–136, DOI: 10.1016/j.palaeo.2012.02.023
Kern, Z., and Leuenberger, M., 2013. Comment on "The phase relation between atmospheric carbon dioxide and global temperature" Humlum et al. [Glob. Planet. Change 100: 51-69.]: Isotopes ignored. Global and Planetary Change, Vol. 109, p. 1-2, DOI: 10.1016/j.gloplacha.2013.07.002
Kerr, R. A., 1987. Sunspot-Weather Correlation Found: A stunningly strong, correlation between the sunspot cycle and weather has been found; will it persist an what, if any, physical connection is responsible? Science 238, Issue 4826, p. 479-480, DOI: 10.1126/science.238.4826.479
Kerr, R. A., 1994. Climate Modeling's Fudge Factor Comes Under Fire. Science, Vol. 265, Issue 5178, p. 1528, DOI: 10.1126/science.265.5178.1528
Khandekar, M., and Garnett, R., 2020. Global Warming (GW) & Extreme Weather (EW) Link: Are Cold Extremes On The Rise? Earth & Environmental Science Research & Reviews, Vol. 3, Issue 1, 3 pp.
Khandekar, M., and Garnett, R., 2022. Climate Change & Cold Weather Extremes an Overlooked Issue in The Present Climate Debate. Examines in Marine Biology and Oceanography, Vol. 4, Issue 5, EIMBO. 000596, 6 pp.,DOI: 10.31031/EIMBO.2022.04.000596
Kheshgi, H S., Jain, A. K., and Wuebbles, D. J., 1996. Accounting for the missing Carbon-sink with the CO 2-fertilization effect. Climatic Change, Vol. 33, p. 31-62, https://doi.org/10.1007/BF00140512
Khilyuk, L. F., and Chilingar, G. V., 2003. Global Warming: Are We Confusing Cause and Effect?. Energy Sources, 25, p.357–370, Taylor & Francis Group, DOI: 10.1080/00908310390142389
Kholshevnikov, K., and Kuznetsov, E., 2007. Review of the works on the orbital evolution of solar system major planets. Solar System Research, Vol. 41, No. 4, p. 265–300, DOI: 10.1134/S0038094607040016 (originally published in Astronomicheskii Vestnik, 2007, Vol. 41, No. 4, pp. 291–329).
Kieft, B., et al., 2021. Phytoplankton exudates and lysates support distinct microbial consortia with specialized metabolic and ecophysiological traits. Proc. of the Natl. Acad. of Sci. of the U.S.A., Vol. 118, No. 41, Article: e2101178118, https://doi.org/10.1073/pnas.2101178118
Kiehl, J. T., Hack, J. J., Bonan, G. B., Boville, B. A., Briegleb, B. P., Williamson, D. L., & Rasch, P. J., 1996. Description of the NCAR Community Climate Model (CCM3) (No. NCAR/TN-420+STR). University Corporation for Atmospheric Research. doi:10.5065/D6FF3Q99
Kiehl, J. T., 2007. Twentieth century climate model response and climate sensitivity. Geophysical Research Letters, Vol.34, L22710. https://doi.org/10.1029/2007GL031383
Kiehl, J. T., and Shields, C. A., 2013. Sensitivity of the Palaeocene–Eocene Thermal Maximum climate to cloud properties. Philosophical Transactions of the Royal Society A, Vol. 371, Issue 2001, 22 p., https://doi.org/10.1098/rsta.2013.0093
Kiessling, W., 2001. Paleoclimatic significance of Phanerozoic reefs. Geology, Vol. 29, n°8, p. 751-754, DOI: 10.1130/0091-7613
Kilifarska, N. A., and Haigh, J. D., 2003. Solar modulation of water vapour derived from HALOE data. Proc. ISCS 2003 Symposium, 'Solar Variability as an Input to the Earth's Environment', Tatranská Lomnica, Slovakia, 23-28 June, p.339-344
King, J. I. F., 1956. Radiative Equilibrium of a Line-Absorbing Atmosphere. Astrophysical Journal, Vol. 124, p. 272-297, DOI: 10.1086/146220
King, A., and Schneider, B., 1991. The First Global Revolution. Pantheon Books, ISBN 0-679-73825-8, 259 pp.
King, A. D., van Oldenborgh, G. J., Karoly, D. J., Lewis, S. C., and Cullen, H., 2015. Attribution of the record high Central England temperature of 2014 to anthropogenic influences. Environmental Research Letters, Volume 10, Number 5, article 054002, 7pp., https://doi.org/10.1088/1748-9326/10/5/054002
King, J. et al., 2022. Deny, Deceive, Delay- Documenting and Responding to Climate Disinformation at COP26 and Beyond – COP26-Summative-Report, Institute for Strategic Dialogue, isdglobal.org, June 9, 2022, https://www.isdglobal.org/wp-content/uploads/2022/06/Summative-Report-COP26.pdf , accessed and archived on September 6, 2022.
Kininmonth, W., 2007. Unmasking An Inconvenient Truth. Center for Science and Public Policy, 58 pp., https://www.heartland.org/_template-assets/documents/publications/21278.pdf, accessed and archived on August 23, 2020.
Kirchmeier-Young, M. C., Zwiers, F. W., and Gillett, N. P., 2017. Attribution of extreme events in Arctic sea ice extent. Journal of Climate, Vol. 30, Issue 2, p. 553–571, https://doi.org/10.1175/JCLI-D-16-0412.1
Kirk, S., 2022. Why investors need not worry about climate risks. 16'25 presentation at the FT Live Moral Money Europe Summit Conference, Turning Talk Into Action to Hit ESG Targets, https://www.youtube.com/watch?v=bfNamRmje-s Kirkby, J., 2007. Cosmic Rays and Climate. Surveys in Geophysics, Vol. 28, p. 333–375, doi: 10.1007/s10712-008-9030-6
Kirkby, J., et al., 2016. Ion-induced nucleation of pure biogenic particles. Nature 533, p. 521-526, DOI: 10.1038/nature17953
Kirkham, J. D., et al., 2019. Past water flow beneath Pine Island and Thwaites glaciers, West Antarctica. The Cryosphere, Vol. 13, p. 1959–1981, https://doi.org/10.5194/tc-13-1959-2019
Kirschbaum, M. U. F., Eamus, D., Gifford, R. M., Roxburgh, S. H., and Sands, P. J., 2001. Definitions of some ecological terms commonly used in carbon accounting. In: Proceedings Net Ecosystem Exchange CRC Workshop 18-20 April, p 2-5, http://hdl.handle.net/102.100.100/202607?index=1
Kislyakova, K. G., et al., 2017a. Magma oceans and enhanced volcanism on TRAPPIST-1 planets due to induction heating. Nature Astronomy, Vol. 1, p. 878–885, https://doi.org/10.1038/s41550-017-0284-0
Kislyakova, K. G., et al., 2017b. Induction heating of planetary interiors. European Planetary Science Congress, Vol. 11, EPSC2017-973, 2 pp.
Kislyakova, K. G., et al., 2018. Effective Induction Heating around Strongly Magnetized Stars. The Astrophysical Journal, Volume 858, Number 2, 105, 7 pp., https://doi.org/10.3847/1538-4357/aabae4
Kislyakova, K. G., and Noack, L., 2020. Electromagnetic induction heating as a driver of volcanic activity on massive rocky planets. Astronomy & Astrophysics, Vol. 636, L10, 5 pp., https://doi.org/10.1051/0004-6361/202037924
Kissin, Y. V., 2015. A Simple Alternative Model for the Estimation of the Carbon Dioxide Effect on the Earth’s Energy Balance. Energy & Environment, Vol. 26, Issue 8, p. 1319-1334, DOI: 10.1260/0958-305X.26.8.1319
Kitaba, I., et al., 2017. Geological support for the Umbrella Effect as a link between geomagnetic field and climate. Nature Scientific Reports, Vol. 7, Article: 40682, 7 pp., DOI: 10.1038/srep40682
Klages, J. P., et al., 2020. Temperate rainforests near the South Pole during peak Cretaceous warmth. Nature, Vol. 580, Issue 7801, p.81-86, DOI: 10.1038/s41586-020-2148-5
Klaus, V., 2008. Blue Planet in Green Shackles - What Is Endangered: Climate or Freedom? Competitive Enterprise Institute, ISBN: 1889865-09-5, 100 pp., https://www.klaus.cz/clanky/195 and https://cei.org/studies/blue-planet-in-green-shackles/ Kleypas, J. A., 1997. Modeled estimates of global reef habitat and carbonate production since the last glacial maximum. Paleoceanography and Paleoclimatology, Vol. 12, Issue 4, p. 533-545, https://doi.org/10.1029/97PA01134
Kline, D. I., et al., 2015. Six Month In Situ High-Resolution Carbonate Chemistry and Temperature Study on a Coral Reef Flat Reveals Asynchronous pH and Temperature Anomalies. PLOS ONE, Vol. 10, n°6, e0127648, 26 pp., https://doi.org/10.1371/journal.pone.0127648
Klyashtorin, L. B., and Lyubushin, A., 2003. On the Coherence between Dynamics of the World Fuel Consumption and Global Temperature Anomaly. Energy & Environment, Vol. 14, No. 6, p. 773-782, DOI: 10.1260/095830503322793641
Klyashtorin, L. B., and Lyubushin, A., 2007. Cyclic Climate Changes and Fish Productivity. Dr. G. D. Sharp (Ed.), Government of the Russian Federation, VNIRO Publishing, Moscow, 224 p.
Knauth, L. P., 2005. Temperature and salinity history of the Precambrian ocean: implications for the course of microbial evolution. Palaeogeography, Palaeoclimatology, Palaeoecology, Vol. 219, Issues 1–2, 11 April 2005, p. 53-69, https://doi.org/10.1016/j.palaeo.2004.10.014
Knopf, A., 1948. The Geosynclinal Theory. Bulletin of the Geological Society of America, Vol. 59, N°7, p. 649-670, DOI: 10.1130/00167606(1948)59[649:TGT]2.0.CO;2
Knopf, A., 1960. Analysis of some recent geosynclinal theory. American Journal of Science, Bradley Volume, Vol. 258-1, p. 126-136.
Knudsen, M. F., Seidenkrantz, M., Jacobsen, B.H., and Kuijpers, A., 2011. Tracking the Atlantic Multidecadal Oscillation through the last 8,000 years. Nature Communications, Vol. 2, Article n°178, 8 pp., DOI: 10.1038/ncomms1186
Knutti, R., Rugenstein, M. A. A., and Hegerl, G. C., 2017. Beyond equilibrium climate sensitivity, nature geoscience, Vol. 10, p. 727736, http://climate-dynamics.org/wp-content/uploads/2016/06/knutti17a.pdf, https://www.nature.com/articles/ngeo3017
Kobashi, T., et al., 2010. Persistent multi-decadal Greenland temperature fluctuation through the last millennium. Climatic Change, Vol. 100, p. 733–756, DOI 10.1007/s10584-009-9689-9
Kobashi, T., et al., 2011. High variability of Greenland surface temperature over the past 4000 years estimated from trapped air in an ice core. Geophysical Research Letters, Vol. 38, L21501, 6 pp., DOI: 10.1029/2011gl049444
Köhler, P., Knorr, G., Buiron, D., Lourantou, A., and Chappellaz, J., 2011. Abrupt rise in atmospheric CO2 at the onset of the Bølling/Allerød: in-situ ice core data versus true atmospheric signals. Climate of the Past, Vol. 7, n°2, p. 473–486, DOI: 10.5194/cp-7-473-2011
Köhler, P., et al., 2018. Comment on “Scrutinizing the carbon cycle and CO2 residence time in the atmosphere” by H. Harde. Global and Planetary Change, Vol. 164, p. 67-71, https://doi.org/10.1016/j.gloplacha.2017.09.015
Kolbert, E., 2006. Annals of Science, The Darkening Sea, What carbon emissions are doing to the ocean. The New Yorker, November 20th, p. 66-75, https://staff.washington.edu/hodin/pdf/DarkeningSea.pdf, accessed and archived on August 13, 2020. Kolmogorov, A. N., 1940. Wienersche Spiralen und einige andere interessante Kurven im Hilbertschen Raum [On degeneration of isotropic turbulence in an incompressible viscous liquid]. Comptes Rendus (Doklady) de l'Académie des Sciences de l'URSS (N.S.), Vol. 26, p. 115-118.
Kondratyev727, K. Ya., 1969. Radiation in the Atmosphere. New York, Academic Press, 912 pp. Koonin, S. E., 2021. Unsettled: What Climate Science Tells Us, What It Doesn't, and Why It Matters. BenBella Books, 320 pp. Kopp, R. E., et al., 2009. Probabilistic assessment of sea level during the last interglacial stage. Nature, Vol. 462, Issue 7275, p. 863867, DOI: 10.1038/nature08686
Köppen, W., 1884a. Die Wärmezonen der Erde, nach der Dauer der heissen, gemässigten und kalten Zeit und nach der Wirkung der Wärme auf die organische Welt betrachtet. Meteorologische Zeitschrift, Mai-Juni, Vol. 1, p. 215-226. http://koeppengeiger.vu-wien.ac.at/pdf/Koppen_1884.pdf
Köppen, W., 1884b. The thermal zones of the Earth according to the duration of hot, moderate and cold periods and to the impact of heat on the organic world. Translated and edited by Volken E., and Brönnimann, S., Meteorologische Zeitschrift, Vol. 20, No. 3, p. 351-360, DOI: 10.1127/0941-2948/2011/105
Köppen, W., 1936. Das geographische System der Klimate [The geographic system of climates]. in: Handbuch der Klimatologie, Band I, Teil C, 44 pp., http://koeppen-geiger.vu-wien.ac.at/pdf/Koppen_1936.pdf
Koppers, A. A. P., and Sager, W W., 2014. Large-Scale and LongTerm Volcanism on Oceanic Lithosphere. Developments in Marine Geology, Volume 7, Chapter 4, p. 553-597, http://dx.doi.org/10.1016/B978-0-444-62617-2.00019-0
Kortenkamp, A. and Demeneix, B., et al. 2016. Let’s stop the manipulation of science. «Tribune» published in newspaper «Le Monde» 29 Nov. 2016, together with a hundred signatories, https://www.lemonde.fr/idees/article/2016/11/29/let-s-stopthe-manipulation-of-science_5039867_3232.html, accessed and archived on November 27, 2020.
Kossobokov, V., Le Mouel, J.-L., and Allègre, C., 2012. Spatial and Temporal Variations of Climate in Europe. Atmospheric and Climate Sciences, Vol. 2, p. 568-581, DOI: 10.4236/acs.2012.24052
Kotkin, J., 2020. Triumph Of The Woke Oligarchs. RealClear Energy, April 27, 2020,https://www.realclearenergy.org/articles/2020/04/27/triumph_of_the_woke_oligarchs_490094.html, accessed and archived on November 27, 2020.
727Can also be met in some references spelled as Kondratiev
Kottek, M., Grieser, J., Beck, C., Rudolf, B., and Rubel, F., 2006. World Map of the Köppen-Geiger climate classification updated. Meteorologische Zeitschrift, Vol. 15, No. 3, p. 259-263, http://koeppen-geiger.vu-wien.ac.at/pdf/Paper_2006.pdf
Koutsoyiannis, D. and Montanari, A., 2007. Statistical analysis of hydroclimatic time series: Uncertainty and insights. Water Resources Research, Vol. 43, Issue 5, W05429, doi:10.1029/2006WR005592
Koutsoyiannis, D., Efstratiadis, A., Mamassis, N., Christofides, A., 2008. On the Credibility of Climate Predictions. Hydrological Sciences Journal, Vol. 5, Issue 4, p. 671-684, DOI: 10.1623/hysj.53.4.671
Koutsoyiannis, D., 2008. From climate certainties to climate stochastics. Conference: IHP 2008 Capri Symposium: The Role of Hydrology in Water Resources Management, At: Capri, Italy, Conference site http://www.itia.ntua.gr/dk/, DOI: 10.13140/RG.2.2.28481.15205/1
Koutsoyiannis, D., Efstratiadis, A., Mamassis, N., and Christofides, A., 2008. On the Credibility of Climate Predictions. Hydrological Sciences Journal / Journal des Sciences Hydrologiques, Vol. 53, Issue 4, p. 671-684, DOI: 10.1623/hysj.53.4.671
Koutsoyiannis, D., Montanari, A., Lins, H. F., and Cohn, T. A., 2009. Climate, hydrology and freshwater: towards an interactive incorporation of hydrological experience into climate research – DISCUSSION of “The implications of projected climate change for freshwater resources and their management”, Hydrological Sciences Journal/Journal des Sciences Hydrologiques , Vol. 54, Issue 2, p. 394–405, DOI: 10.1623/hysj.54.2.394
Koutsoyiannis, D. 2010. HESS Opinions “A random walk on water". Hydrology and Earth System Sciences, Vol. 14, Issue 3, p. 585-601, https://doi.org/10.5194/hess-14-585-2010
Koutsoyiannis, D., 2011a. Hurst-Kolmogorov Dynamics and Uncertainty. Journal of the American Water Resources Association (JAWRA) Vol. 47, Issue 3, p. 481-495. DOI: 10.1111/j.1752-1688.2011.00543.x
Koutsoyiannis, D., 2011b. Hurst–Kolmogorov dynamics as a result of extremal entropy production. Physica A: Statistical Mechanics and its Applications, Vol. 390, Issue 8, p. 1424-1432, https://doi.org/10.1016/j.physa.2010.12.035
Koutsoyiannis, D., 2013. Hydrology and change. Hydrological Sciences Journal, Vol. 58, Issue 6, p. 1177-1197, https://doi.org/10.1080/02626667.2013.804626
Koutsoyiannis, D., 2017. Entropy Production in Stochastics. Entropy, Vol. 19, Issue 11, Article 581, 50 pp., https://doi.org/10.3390/e19110581
Koutsoyiannis, D., and Kundzewicz, Z. W., 2020. Atmospheric Temperature and CO2: Hen-or-Egg Causality? Sci, Vol. 2, 72, https://www.mdpi.com/journal/sci, DOI: 10.3390/sci2030072
Koutsoyiannis, D., 2021a. Rethinking Climate, Climate Change, and Their Relationship with Water. Water, Vol. 13, 849, 38 pp., https://doi.org/10.3390/w13060849
Koutsoyiannis, D., 2021b. Stochastics of Hydroclimatic Extremes – A Cool Look at Risk. Publisher: Kallipos, Open Academic Editions, Athens, ISBN: 978-618-85370-0-2, 333 pp., DOI: 10.57713/kallipos-1
Koutsoyiannis, D., Onof, C., Christofides, A., and Kundzewicz, Z. W., 2022a. Revisiting causality using stochastics: 1. Theory. Proc. A of the Royal Society, 478: 20210835, 21 pp., https://doi.org/10.1098/rspa.2021.0835
Koutsoyiannis , D., Onof, C., Christofides , A., and Kundzewicz, Z. W., 2022b. Revisiting causality using stochastics: 2. Applications. Proc. A of the Royal Society, 478: 20210836, 23 pp., https://doi.org/10.1098/rspa.2021.0836
Kouwenberg, L. L. R., 2004. Application of Conifer Needles in the Reconstruction of Holocene CO 2 Levels. Ph.D. Thesis, University of Utrecht, Netherlands, https://dspace.library.uu.nl/bitstream/handle/1874/243/full.pdf
Kouwenberg, L. L. R., Wagner, R., Kurschner, W., and Visscher, H., 2005. Atmospheric CO2 fluctuations during the last millennium reconstructed by stomatal frequency analysis of Tsuga heterophylla needles. Geology, Vol. 33, p. 33–36, https://doi.org/10.1130/G20941.1
Kowalski, R. A., 1988. The early years of logic programming. Communications of the ACM (Association for Computing Machinery), Vol. 31, n°1, p. 38-43, DOI: 10.1145/35043.35046, http://www.doc.ic.ac.uk/~rak/papers/the%20early%20years.pdf
Kraft et al., 2011. Disentangling the Drivers of Diversity Along Latitudinal and Elevational Gradients. Science, Vol. 333, Issue 6050, p.1755-1758, DOI: 10.1126/science.1208584
Kramm, G., and Dlugi, R., 2011. Scrutinizing the atmospheric greenhouse effect and its climatic impact, Natural Science, Vol.3, n°12, p. 971-998, http://dx.doi.org/10.4236/ns.2011.312124, http://file.scirp.org/pdf/NS20111200002_95966212.pdf
Krasovskiy, Y. P., and Stone, P. H., 1998. Destabilization of the Thermohaline Circulation by Atmospheric Transports: An Analytic Solution. Journal of Climate, Vol. 11, Issue 7, p. 1803-1811, DOI: 10.1175/1520-0442(1998)011<1803:DOTTCB>2.0.CO;2 Krauthammer, C., 2008. The Church of the Environment dogma is based on speculation. Pittsburgh Post-Gazette, May 31, 2008, https://www.post-gazette.com/opinion/2008/05/31/Charles-Krauthammer-The-Church-of-the-Environment-dogma-isbased-on-speculation/stories/200805310178, accessed and archived on November 27, 2020.
Kreiss, H.-O., 1984. Problems with different time scales. Contributions of Mathematical Analysis to the Numerical Solution of Partial Differential Equations, p. 93-105, Centre for Mathematical Analysis, The Australian National University, Canberra AUS, 1984. https://projecteuclid.org/euclid.pcma/1416337577
Křivský, L., Pejml, K., 1988. Solar activity, aurorae and c
u Československé akademie ved, n° 606, Publications of the Astronomical Institute of the Czechoslovak Academy of Sciences, n°75.
Kuhlbrodt, T., et al., 2007. On the driving processes of the Atlantic meridional overturning circulation. Reviews of Geophysics, Vol. 45, Issue 2, RG2001, DOI:10.1029/2004RG000166
Kuiper, G. P., 1938. The Empirical Mass-Luminosity Relation. Astrophysical Journal, Vol. 88, p. 472-507, DOI: 10.1086/143999
Kuiper, G. P., 1947. Carbon Dioxide on Mars, Harvard Announcement Card 851, 1947.
Kukla, G. J., and Matthews, R. K., 1972. When Will the Present Interglacial End? Science, Vol. 178, Issue 4057, p. 190-191, DOI: 10.1126/science.178.4057.190
Kukla, G. J., McManus, J. F., Rousseau, D. D., Chuine, I., 1997. How long and how stable was the last interglacial ? Quaternary Science Reviews, Vol. 16, n°6, p.605-612, https://doi.org/10.1016/S0277-3791(96)00114-X
Kukla, G. J., 2000. The Last Interglacial. Science, Vol. 287, Issue 5455, p. 987-988, DOI: 10.1126/science.287.5455.987
Kukla, G. J., et al. 2002. Last Interglacial Climates. Quaternary Research, Vol. 58, p. 2–13, DOI: 10.1006/qres.2001.2316
Kumar, K. L., 1976. S. Engineering Fluid Mechanics in SI Units. Eurasia Publishing House, Chand Technical Books, ISBN 978-93-8567648-2, 611 pp.
Kundzewicz, Z. W., et al., 2007. Freshwater Resources and their Management. In book: Climate Change 2007: Impacts, Adaptation and Vulnerability. Contribution of Working Group II to the Fourth Assessment Report of the Intergovernmental Panel on Climate Change (Chapter 3 / AR4), Publisher: Cambridge University Press, M.L. Parry and O.F. Canziani and J.P. Palutikof and P.J. van der Linden and C.E. Hanson (eds.).
Kundzewicz, Z. W., Mata, L. J., Arnell, N. W., Döll, P., Jimenez, B., Miller, K., Oki, T., Sen, Z., and Shiklomanov, I., 2008. The implications of projected climate change for freshwater resources and their management. Hydrological Sciences Journal, Vol. 53, Issue 1, p. 3–10, https://doi.org/10.1623/hysj.53.1.3
Kuo, C., Lindberg, C. and Thomson, D. J., 1990. Coherence established between atmospheric carbon dioxide and global temperature. Nature, Vol. 343, p. 709-714, https://doi.org/10.1038/343709a0
Kurzmen, G., 2020. Glacier National Park to remove all 'glaciers will be gone by 2020' signs. Kpax Missoula & Western Montana, January 6, 2020, https://www.kpax.com/news/local-news/flathead-county/glacier-national-park-to-remove-all-glaciers-willbe-gone-by-2020-signs/, accessed April and archived November 28, 2020.
Kusakabe, M., et al., 2008. Evolution of CO2 in Lakes Monoun and Nyos, Cameroon, before and during controlled degassing. Geochemical Journal, Vol. 42, p. 93-118, DOI: 10.2343/geochemj.42.93
Kusakabe, M., 2015. Evolution of CO2 Content in Lakes Nyos and Monoun, and Sub-lacustrine CO2-Recharge System at Lake Nyos as Envisaged from CO2/3He Ratios and Noble Gas Signatures. D. Rouwet et al. (eds.), Volcanic Lakes, Advances in Volcanology, Springer-Verlag, p. 427-450, DOI: 10.1007/978-3-642-36833-2_19
Kusakabe, M., 2017. Lakes Nyos and Monoun Gas Disasters (Cameroon)—Limnic Eruptions Caused by Excessive Accumulation of Magmatic CO2 in Crater Lakes. GEochemistry Monograph Series, Vol. 1, n°1, p. 1–50, DOI: 10.5047/gems.2017.00101.0001
KZ, 2011. "General Winter": Every day down to minus 30 degrees in Moscow, "General Winter": Täglich bis zu minus 30 Grad in Moskau. Kronen Zeitung, February 2, 2018, https://www.krone.at/246731, accessed and archived November 28, 2020. Labitzke, K., and van Loon, H., 1988. Associations between the 11-year solar cycle, the QBO and the atmosphere. Part I: the troposphere and stratosphere in the northern hemisphere in winter. Journal of Atmospheric and Terrestrial Physics, Vol. 50, Issue 3, p. 197-206, https://doi.org/10.1016/0021-9169(88)90068-2
Labitzke, K., and van Loon, H., 1989. Association between the 11-Year Solar Cycle, the QBO, and the Atmosphere. Part III: Aspects of the Association. Journal of Climate, Vol. 2, Issue 6, p. 554-565. DOI: 10.1175/1520-0442(1989)002<0554:ABTYSC>2.0.CO;2
Labitzke, K., and van Loon, H., 1991. Association between the 11-Year Solar Cycle and the Atmosphere. Part V: Summer. Journal of Climate, Vol. 5, p. 240-251, DOI: 10.1175/1520-0442(1992)005<0240:ABTYSC>2.0.CO;2
Labitzke, K., and van Loon, H., 1997. The signal of the 11-year sunspot cycle in the upper troposphere-lower stratosphere. Space Science Reviews, Vol. 80, p. 393–410, doi: 10.1023/A:1004907126955
Labitzke, K., 2001. The global signal of the 11-year sunspot cycle in the stratosphere: Differences between solar maxima and minima. Meteorologische Zeitschrift, Vol. 10, No. 2, p. 83-90, DOI: 10.1127/0941-2948/2001/0010-0083
Labitzke, K., 2007. Effects of the Solar Cycle on the Earth’s Atmosphere. In: Kamide Y., Chian A. (eds.) Handbook of the SolarTerrestrial Environment. Springer, Berlin, Heidelberg. https://doi.org/10.1007/978-3-540-46315-3_18
Labunets, N., 2014. Cost Benefit Analysis of Wind Power in Germany. Thesis, Charles University in Prague, Institute of Economic Studies, 88 pp.
Lachiver, M. 1991. Les Années De Misère: La famine au temps du Grand Roi, 1680–1720 (in French), Paris: Fayard, 573 pp., ISBN 9782-213-02799-9.
Laframboise, D., 2011. The Delinquent Teenager Who Was Mistaken for the World's Top Climate Expert Kindle Edition. Amazon, https://www.amazon.com/Delinquent-Teenager-Mistaken-Worlds-Climate-ebook/dp/B005UEVB8Q
Laframboise, D., 2016. PeerReview, Why Skepticism is Essential. The Global Warming Policy Foundation, 25 pp., https://www.thegwpf.org/content/uploads/2016/10/PeerReview.pdf, accessed and archived June 5, 2020.
Laken, B. A. , Kniveton, D. R., and Frogley, M. R., 2010. Cosmic rays linked to rapid mid-latitude cloud changes. Atmospheric Chemistry and Physics, Vol. 10, p. 10941–10948, DOI: 10.5194/acp-10-10941-2010
Laloyaux, P., et al., 2018. CERA‐20C: A Coupled Reanalysis of the Twentieth Century. Journal of Advances in Modeling Earth Systems, Vol. 10, Issue 5, p. 1172-1195, https://doi.org/10.1029/2018MS001273
Lam, M. M., and Tinsley, B. A., 2016. Solar wind-atmospheric electricity-cloud microphysics connections to weather and climate. Journal of Atmospheric and Solar-Terrestrial Physics, Vol. 149, p. 277–290, https://doi.org/10.1016/j.jastp.2015.10.019
Lamarche Jr, V. C., Graybill, D. A., Fritts, H. C., and Rose, M. R., 1984. Increasing Atmospheric Carbon Dioxide: Tree Ring Evidence for Growth Enhancement in Natural Vegetation. Science, Vol. 225, Issue 4666, p. 1019-1021. DOI: 10.1126/science.225.4666.1019
Lamb, H. H., 1959. Our changing climate, pas and present. Weather, Vol. 14, Issue 10, p. 299-318, https://doi.org/10.1002/j.14778696.1959.tb00533.x
Lambeck, K., and Cazenave, A., 1976. Long Term Variations in the Length of Day and Climatic Change. Geophysical Journal of the Royal Astronomical Society, Vol. 46, Issue 3, p. 555-573. https://doi.org/10.1111/j.1365-246X.1976.tb01248.x
Lambeck, K., and Cazenave, A., 1977. The Earth's Variable Rate of Rotation: A Discussion of Some Meteorological and Oceanic Causes and Consequences. Philosophical Transactions of the Royal Society of London. Series A, Vol. 284, n° 1326, p. 495-506, https://www.jstor.org/stable/74779
Lambeck K., and Bard, E., 2000. Sea-level change along the French Mediterranean coast for the past 30000 years. Earth and Planetary Science Letters, Vol. 175, p. 203-222, DOI: 10.1016/S0012-821X(99)00289-7
Lancaster, J. J., 2006. The Cosmos Myth. OSS Open Source Systems, Science, Solutions, June 7, 2006, http://ossfoundation.us/projects/environment/global-warming/myths/revelle-gore-singer-lindzen , accessed May 2020 and archived November 28, 2020.
Landais, A., et al., 2013. Two-phase change in CO2, Antarctic temperature and global climate during Termination II. Nature Geoscience, Vol. 6, p. 1062-1065. DOI: 10.1038/NGEO1985
Landscheidt, T., 2003. New Little ICE Age Instead of Global Warming? Energy and Environment, vol. 14, n°2, p.327-350. https://doi.org/10.1260/095830503765184646
Langley, S. P., 1884. Researches on solar heat and its absorption by the earth's atmosphere. A report of the Mount Whitney expedition. Professional Papers Signal Service. No. xv, Washington, 1884, p. 1-242, pls. 24.
Langley, S. P. (and Very728, F. W.), 1890. The Temperature of the Moon, Memoir of the National Academy of Sciences, Vol. IV. 9th mem. 193pp.
Langley, S. P., 1900. Sur les derniers résultats obtenus dans l'étude de la partie infra-rouge du spectre solaire. Comptes rendus de l'Académie des Sciences, CXXXI, p. 734.
Langmuir, I., 1989. Pathological Science, Transcribed and edited by Robert N. Hall, Physics Today, October, p. 36-48, http://yclept.ucdavis.edu/course/280/Langmuir.pdf, accessed and archived July 30, 2020.
Laplace, P.-S., 1775, Mémoire sur les solutions particulières des équations différentielles et sur les inégalités séculaires des planètes. Mémoires de l’Académie des Sciences de Paris, année 1772, publié en 1775, Œuvres, t. VIII, p. 325-367.
Laplace, P.-S., 1776: Recherches sur plusieurs points du système du monde. Mémoire de l'Académie Royale des Sciences, Paris, Vol. 89, p. 177–264
Laskar, J., 1989. A numerical experiment on the chaotic behaviour of the solar system. Nature, Vol 338, Issue 6212,p. 237-238, https://doi.org/10.1038/338237a0
Laskar, J., 1990. The chaotic motion of the solar system: A numerical estimate of the chaotic zones. Icarus, Vol. 88, Issue 2, p.266291, https://doi.org/10.1016/0019-1035(90)90084-M
Laskar, J., and Robutel, P., 1993. The chaotic obliquity of the planets, Nature, Vol. 361, Issue 6413, p. 608-612, DOI: 10.1038/361608a0
Laskar, J., Joutel F., and Robutel, P., 1993. Stabilization of the Earth's obliquity by the Moon. Nature, Vol. 361, p. 615-617, https://doi.org/10.1038/361615a0
Laskar, J. and Robutel, P., 2001. High Order Symplectic Integrators for Perturbed Hamiltonian Systems. Celestial Mechanics and Dynamical Astronomy, Vol. 80, pp. 39–62, DOI: 10.1023/A:1012098603882
Laskar, J., et al., 2004. Long term evolution and chaotic diffusion of the insolation quantities of Mars. Icarus, Vol. 170, Issue 2, p. 343364, https://doi.org/10.1016/j.icarus.2004.04.005
Laskar, J., and Gastineau, M., 2009. Existence of collisional trajectories of Mercury, Mars and Venus with the Earth. Nature, Vol. 459, p. 817-819, https://doi.org/10.1038/nature08096
Laskar, J., 2010. Le Système solaire est-il stable ? Séminaire Poincaré XVI (2012), p. 221-246, http://www.bourbaphy.fr/laskar.pdf
Latour, P., 2014. Atmospheric Carbon Dioxide Lags Temperature: The Proof. Principia Scientific International, June 13, 2014, https://principia-scientific.org/atmospheric-carbon-dioxide-lags-temperature-the-proof, accessed and archived July 11, 2020.
Lauer, A., and Hamilton, K., 2013. Simulating clouds with global climate models: a comparison of CMIP5 results with CMIP3 and satellite data. Journal of Climate, Vol. 26, Issue 11, p. 3823–3845, DOI: 10.1175/jcli-d-12-00451.1
LaViolette, P. A., 1985. Evidence of high cosmic dust concentrations in late Pleistocene polar ice. (20,000-14,000 years BP). Meteoritics, Vol. 20, Issue 3, p. 545-558, DOI: 10.1111/j.1945-5100.1985.tb00050.x
Lawrence, K. T., Liu, Z., and Herbert, T. D., 2006. Evolution of the Eastern Tropical Pacific Through Plio-Pleistocene Glaciation. Science, Vol. 312, Issue 5770, p. 79-83, DOI: 10.1126/science.1120395
Lawrimore, J. H., et al., 2011. An overview of the Global Historical Climatology Network monthly mean temperature data set, version 3. Journal of Geophysical Research, Vol. 116, D19121, DOI: 10.1029/2011JD016187.
Layer P. W. 2000. Argon-40/Argon-39 age of the El’gygytgyn event, Chukotka, Russia. Meteoritics & Planetary Science, Vol. 35, Issue 3, p. 591–599, https://doi.org/10.1111/j.1945-5100.2000.tb01439.x
Leamon, R. J., McIntosh, S. W., and Marsh, D. R., 2021. Termination of Solar Cycles and Correlated Tropospheric Variability. Earth and Space Science, Vol. 8, Issue 4, e2020EA001223, 18 pp., https://doi.org/10.1029/2020EA001223
Lean, J., Beer, J., and Bradley, R., 1995. Reconstruction of Solar Irradiance Since 1610: Implications for Climate Change. Geophysical Research Letters, Vol. 22, n°. 23, p. 3195-3198, DOI: 10.1029/95GL03093
Lean, J., and Rind, D. 1998. Climate forcing by changing solar radiation. Journal of Climate, Vol 11, p. 3069–3094, doi:10.1175/15200442(1998)011<3069:CFBCSR>2.0.CO;2.
728In the whole of the preceding work, both of observation and reduction, Mr. F. W. Very, of this observatory, has been so intimately associated with me that it had been my intention, as a matter of simple justice to his collaboration, to place his name on the title-page with my own ; but it as been omitted by an oversight, noticed too late for correction, I desire to make explicit acknowledgement here of the most essential indebtness the work owes to him at every stage of its progress. S. P. Langley, Director, August 31, 1889.
Lean, J. 2000. Evolution of the Sun's Spectral Irradiance Since the Maunder Minimum. Geophysical Research Letters, Vol. 27, n°. 16, p. 2425-2428, DOI: 10.1029/2000GL000043
Lean, J. L., 2018. Estimating Solar Irradiance Since 850 CE. Earth and Space Science, Vol. 5, p. 133–149. https://doi.org/10.1002/2017EA000357
Lear, C. H., et al., 2020. Geological Society of London Scientific Statement: what the geological record tells us about our present and future climate. Journal of the Geological Society, Vol. 178, jgs2020-239, 13 pp., https://doi.org/10.1144/jgs2020-239
Leatherman, S. P., 1990. Environmental Implications of Shores Protection Strategies along Open. In Titus J. G. et al. (Eds.) Changing Climate and the Coast, Vol. 1, Adaptive Responses and their Economic, Environmental, and Institutional Implications, p. 197207.
Lee, R., 1973. The "greenhouse" effect. Journal of Applied Meteorology, Vol. 12, Issue 3, p. 556-557, https://journals.ametsoc.org/jamc/article/12/3/556/349371/The-Greenhouse-Effect, DOI: 10.1175/15200450(1973)012<0556:TE>2.0.CO;2
Lee, R., 1974. "Reply to Berry". Journal of Applied Meteorology, Vol. 13, p. 605-606.
Legates, D. R., 2014. Statement to the Environment and Public Works Committee of the United States Senate. 3rd June, 25 pp, https://www.epw.senate.gov/public/_cache/files/a/a/aa8f25be-f093-47b1-bb261eb4c4a23de2/01AFD79733D77F24A71FEF9DAFCCB056.6314witnesstestimonylegates.pdf, accessed and archived August 29, 2020.
Legates, D., Soon, W., Briggs, W. M., and Monckton of Brenchley, C., 2015. Climate Consensus and 'Misinformation': A Rejoinder to Agnotology, Scientific Consensus, and the Teaching and Learning of Climate Change. Science & Education, Vol. 24, p. 299–318, DOI: 10.1007/s11191-013-9647-9
Legates, D. R., 2019. Public Hearing – Pennsylvania CO2 and Climate House Environmental Resources & Energy Committee. 28th Oct, https://www.legis.state.pa.us/WU01/LI/TR/Transcripts/2019_0135_0002_TSTMNY.pdf, accessed and archived August 29, 2020.
Le Goff, C., 2016. Approches physiologique et moléculaire de la calcification chez le corail rouge de Méditerranée Corallium rubrum. Thèse de doctorat en Sciences de la vie. Université Pierre et Marie Curie, 208 pp. Legras, B., 2017. Physique de l'atmosphere, Cours 1, Bilan Radiatif, 64 slides, L3 et diplôme de l'ENS Sciences de la Planète Terre, http://www.lmd.ens.fr/legras/Cours/L3-meteo/radiatifNN.pdf, accessed and archived November 28, 2020.
Le Guern, F., Shanklin, E., Tebor, S, 1992. Witness accounts of the catastrophic event of August 1986 at Lake Nyos (Cameroon). Journal of Volcanology and Geothermal Research, Vol. 51, Issues 1-2, p. 171-184, DOI: 10.1016/0377-0273(92)90067-N
Le Mouël, J.-L., Courtillot, V., Blanter, E., and Shnirman, M., 2008. Evidence for a solar signature in 20th-century temperature data from the USA and Europe. Comptes Rendus Geoscience, Vol. 340, Issue 7, p. 421-430, https://doi.org/10.1016/j.crte.2008.06.001
Le Mouël, J.‐L., Blanter, E., Shnirman, M., and Courtillot, V., 2010. Solar forcing of the semi‐annual variation of length‐of‐day, Geophysical Research Letters, Vol. 37, L15307, 5 pp., DOI: 10.1029/2010GL043185.
Lenaerts, A., 2013. The Role of the Principle Fraus Omnia Corrumpit in the European Union: A Possible Evolution Towards a General Principle of Law? Yearbook of European Law, Vol. 32, Issue 1, p. 460–498, https://doi.org/10.1093/yel/yet019
Lenton, T. M., 2000. Land and ocean cycle feedback effect on global warming in a simple Earth system model, Tellus, Vol. 52B, p. 1159-1188, https://doi.org/10.3402/tellusb.v52i5.17097
Leodolter, M., Brändle, N., Plant, P., 2018. Automatic Detection of Warped Patterns in Time Series: The Caterpillar Algorithm. In: Proc. 2018 IEEE International Conference on Big Knowledge (ICBK), 17-18 Nov., Singapore, 10.1109/ICBK.2018.00063
Le Quéré, C., et al., 2016. Global Carbon Budget 2016 Earth System Science Data, Vol. 8, p. 605–649, DOI: 10.5194/essd-8-605-2016
Le Quéré, C., et al., 2017. Global Carbon Budget 2017 Earth System Science Data Discussion, p. 1–79, doi:10.5194/essd-2017-123
Le Quéré, C., et al., 2018. Global Carbon Budget 2017 Earth System Science Data, Vol. 10, p. 405-448, DOI: 10.5194/essd-10-4052018.
Le Quéré, C., et al., 2021. Fossil CO2 emissions in the post-COVID-19 era. Nature Climate Change, Vol. 11, p. 197–199, https://doi.org/10.1038/s41558-021-01001-0
Leroux, M. 1993. The Mobile Polar High: a new concept explaining present mechanisms of meridional air-mass and energy exchanges and global propagation of paleoclimatic changes. Global and Planetary Change, Vol. 7, Issues 1-3, p. 69-93, https://doi.org/10.1016/0921-8181(93)90041-L, https://hacene-arezki.fr/marcel-leroux/ Leroux, M., 2005. Global Warming - Myth or Reality? The Erring Ways of Climatology. Springer-Verlag, ISBN 3-540-23909-X, Praxis Publishing Ltd, Chichester, UK, 509 pp.
Le Roy, M., Deline P., Carcaillet, J., Schimmelpfennig, I., Ermini, M., 2017. 2022. 10Be exposure dating of the timing of Neoglacial glacier advances in the Ecrins-Pelvoux massif, southern French Alps. Quaternary Science Reviews, Vol. 178, p. 118-138, https://doi.org/10.1016/j.quascirev.2017.10.010
Le Roy Ladurie E., 1967. Times of Feast, Times of Famine: A History of Climate Since the Year 1000. Farrar Straus & Giroux; Reissue edition (1 Oct. 1988), ISBN-13: 978-0374521226, 438 pp.
Le Roy Ladurie E., 1967. Histoire du climat depuis l’an mil, Paris, Flammarion, 31 fig., 379 pp.
Le Roy Ladurie E., 2004. Histoire humaine et comparée du climat. Tome 1. Canicules et glaciers XIIIe–XVIIIe siècles. Fayard, Paris, 746p.
Le Roy Ladurie E., 2006. Histoire humaine et comparée du climat. Tome 2. Disettes et révolutions 1740-1860. Fayard, Paris, 616 p.
Le Roy Ladurie E., 2009. Histoire humaine et comparée du climat. Tome 3. Le réchauffement de 1860 à nos jours. Avec le concours de G. Séchet. Fayard, Paris, 462 p.
Le Roy Ladurie E., Rousseau D., 2009. Impact du climat sur la mortalité en France, de 1680 à l'époque actuelle. La Météorologie, n°64, Février, http://hdl.handle.net/2042/23633, https://doi.org/10.4267/2042/23633
Le Roy Ladurie E., Rousseau D., and Vasak A., 2011. Les fluctuations du climat de l’an mil à aujourd’hui. Fayard, Paris, 324 p.
Le Roy Ladurie, E., Rousseau, D., and Javelle, J.-P., 2017. Sur l’histoire du climat en France depuis le XIVe siècle. météo et climat, Société météorologique de France, https://meteoetclimat.fr/wp-content/uploads/2017/07/Histoire-du-Climat-web.pdf, accessed and archived August 14, 2020.
Lesage, C, 2022. Orages en Corse: Météo-France répond à la polémique et se défend. August 19, https://www.bfmtv.com/meteo/orages-en-corse-meteo-france-repond-a-la-polemique-et-se-defend_AN202208190289.html, accessed and archived August 20, 2022.
Létard, V., Flandre, H., and Lepeltier, S., 2004. Rapport d'Information du Sénat N°195. La France et les Français face à la canicule : les leçons d’une crise, 391 pp, https://www.senat.fr/rap/r03-195/r03-1951.pdf
Levenspiel, O., 2006. Atmospheric Pressure at the Time of Dinosaurs. Chemical Industry and Chemical Engineering Quarterly, Vol. 12, Issue 2, DOI: 10.2298/CICEQ0602116L
Levenspiel, O., Fitzgerald, T. J., and Pettit, D., 2000. Earth’s atmosphere before the age of dinosaurs Chemical Innovation, Vol. 30, No. 12, p. 50-55.
Levin, G. V., and Straat, P. A., 1976. Labeled Release - An Experiment in Radiorespirometry. Origins of Life, Vol. 7, p. 293-311.
Levin, G. V., 1997. The Viking Labeled Release Experiment and Life on Mars, Instruments, Methods, and Missions for the Investigation of Extraterrestrial Microorganisms. SPIE Proceedings, Instruments, Methods and Missions for the Investigation of Extraterrestrial Microorganisms, San Diego, CA, 29 July-1 August, Vol. 3111, p. 146-161.
Levin, G. V., and Straat, P. A., 2016. The Case for Extant Life on Mars and Its Possible Detection by the Viking Labeled Release Experiment. Astrobiology. Vol. 16, Issue 10, p. 798–810, doi: 10.1089/ast.2015.1464
Levrard, B., 2005. Cycles de Milankovitch et variations climatiques : dernières nouvelles. Institut de Mécanique Céleste, Observatoire de Paris, https://planet-terre.ens-lyon.fr/article/milankovitch-2005.xml, accessed and archived July 12, 2020.
Levy, M., et al., 2013. Physical pathways for carbon transfers between the surface mixed layer and the ocean interior. Global Biogeochemical Cycles, Vol. 27, p. 1001-1012, DOI: 10.1002/gbc.20092
Lewis, H., 2010. Resignation letter from the American Physical Society after 67 Years of Membership. 6 October 2010, https://www.andrewcusack.com/2010/harold-lewis/ or https://wattsupwiththat.com/2010/10/16/hal-lewis-my-resignationfrom-the-american-physical-society/
Lewis, M., Jr., 2007. Al Gore’s Science Fiction A Skeptic’s Guide to An Inconvenient Truth. Competitive Enterprise Institute Congressional Briefing Paper, 154 pp., http://cei.org/sites/default/files/Marlo Lewis, Jr - Al Gore's Science Fiction A Skeptic's Guide to An Inconvenient Truth.pdf, accessed and archived November 5, 2020.
Lewis, N., and Curry, J., 2018. The impact of recent forcing and ocean heat uptake data on estimates of climate sensitivity. Journal of Climate, Vol. 31, n°15, p. 6051-6071, https://doi.org/10.1175/JCLI-D-17-0667.1
Lewis, N., 2021. Compensation between cloud feedback + ECS and aerosol-cloud forcing in CMIP6 models. March 5, 2021, Climate Etc., https://judithcurry.com/2021/03/05/compensation-between-cloud-feedback-ecs-and-aerosol-cloud-forcing-in-cmip6models/
Leymarie, P., 1969. Contribution aux méthodes d'acquisition, de représentation et de traitement de l'information en géologie. Thèse de doctorat Sciences naturelles [sous la direction de M. H. de la Roche], 19 Décembre, Faculté des sciences de nancy, 217 pp. Leymarie, P., 1970. Contribution aux méthodes d'acquisition, de représentation et de traitement de l'information en géologie. Sciences de la terre: Mémoires, Fondation scientifique de la géologie et de ses applications, n°18, 169 pp. Leymarie, P., Isnard, P., and Beaucourt (de) F., 1975. Le traitement automatique des données géochimiques. Méthodes utilisées au Centre de Recherches Pétrographiques et Géochimiques, Sciences de la terre: Série "Informatique géologique", n°6, ISSN 0335-9255, Fondation scientifique de la géologie et de ses applications (ed.), 69 pp. Leymarie, P., Matheron, G., and Royer, J.-J., 1980. Géologie Mathématique et Informatique Géologique, Sciences de la terre: Série "Informatique géologique", n°14, ISSN 0335-9255, Fondation scientifique de la géologie et de ses applications (ed.), 217pp. Leymarie, P., Royer, J.-J., and Isnard, P., 1981. La mobilité de l'uranium lors de l'altération des granites. Comptes rendus de l'Académie des sciences. Série II, Mécanique, physique, chimie, sciences de l'univers, sciences de la terre, Vol. 292, p. 199-202. Leymarie, P., 1983. Geochemical data processing in Western Europe. Handbook of exploration Geochemistry, Govett G. J. S. (ed), Vol.2, Edited by R. J. Howarth, Elsevier, ISBN 0-444-42038-x, p. 361-368.
Leymarie, P., and Frossard, D., 1983. A method for the transformation of factors in factor analysis. Computers & Geosciences, Vol. 9, Issue 2, p. 255-267, https://doi.org/10.1016/0098-3004(83)90051-1
Leymarie, P., and Poyet, P., 1983. Mise au point de méthodes de discrimination des anomalies de géochimie des eaux sous couverture pour servir à la prospection de l'uranium. Bibliothèque de l'Ecole des Mines de Paris, CTAMN-83-R-30, 15 pp., https://www.academia.edu/30128519, DOI: 10.13140/2.1.3130.7526
Leymarie, P., 1989. Lithogeochemical exploration for uranium in leucogranites. Journal of Geochemical Exploration, Vol. 34, Issue 2, p. 147-156, https://doi.org/10.1016/0375-6742(89)90097-6
Leyrit, H., Zylberman, W., Lutz, P., Jaillard, A., and Lavina, P., 2016. Characterization of Phreatomagmatic Deposits from the Eruption of the Pavin Maar (France). In book: Lake Pavin, p. 105-128, DOI: 10.1007/978-3-319-39961-4_6
Li, T.-Y., and Yorke, J. A., 1975. Period Three Implies Chaos. The American Mathematical Monthly, Vol. 82, No. 10, p. 985-992, https://doi.org/10.2307/2318254
Li, Y.-H., Takahashi, T., Broecker, W. S., 1969. Degree of saturation of CaCO 3 in the Oceans. Journal of Geophysical Research Atmospheres, Vol. 74, p. 5507-5525, DOI: 10.1029/JC074i023p05507
Licciulli, C., et al., 2019. A full Stokes ice-flow model to assist the interpretation of millennial-scale ice cores at the high-Alpine drilling site Colle Gnifetti, Swiss/Italian Alps. Journal of Glaciology, 14 pp., DOI: 10.1017/jog.2019.82
Lide, D. R., 2005. CRC Handbook of Chemistry and Physics, Internet Version 2005, <http://www.hbcpnetbase.com>, CRC Press, Boca Raton, FL, http://webdelprofesor.ula.ve/ciencias/isolda/libros/handbook.pdf
Lilensten, J., Dudok de Wit, T., and Matthes, K., 2020. Earth’s climate response to a changing Sun, Cost & edp science, ISBN: 978-27598-1733-7, 345 pp., DOI: 10.1051/978-2-7598-1733-7, https://www.edp-open.org/images/stories/books/fulldl/Earths_climate_response_to_a_changing_Sun.pdf
Limburg, M., 2014. New Systematic Errors in Anomalies of Global Mean Temperature Time-Series. Energy & Environment, Vol. 25, No. 1, p. 105-122, DOI: 10.1260/0958-305X.25.1.105
Lin, Y., et al., 2021. A reconciled solution of Meltwater Pulse 1A sources using sea-level fingerprinting. Nature Communications, Vol. 12, Article number: 2015, https://doi.org/10.1038/s41467-021-21990-y
Lindzen, R. S., and Holton, J. R., 1968. A theory of the quasi-biennial oscillation. Journal of the Atmospheric Sciences, Vol. 25, Issue 6, p. 1095-1107, DOI: 10.1175/1520-0469(1968)025<1095:ATOTQB>2.0.CO;2
Lindzen, R. S., 1990. Some coolness concerning global warming. Bulletin American Meteorological Society, Vol. 71, n°3, 288-299, DOI: 10.1175/1520-0477(1990)071<0288:SCCGW>2.0.CO;2
Lindzen, R. S., 1997. Can increasing carbon dioxide cause climate change? Proc. of the Natl. Acad. of Sci. of the U.S.A., Vol. 94, p.8335–8342, August 1997, paper presented at colloquium held November 13–15, 1995, at the National Academy of Sciences, Irvine, CA, https://doi.org/10.1073/pnas.94.16.8335, https://www.pnas.org/content/pnas/94/16/8335.full.pdf
Lindzen, R. S., Chou, M.-D. and Hou, A. Y., 2001. Does the Earth Have an Adaptive Infrared Iris? Bulletin of the American Meteorological Society, Vol. 82, n°3, p. 417-432, DOI: 10.1175/1520-0477(2001)082<0417:DTEHAA>2.3.CO;2
Lindzen, R., and Choi, Y.-S., 2009. On the determination of climate feedbacks from ERBE data. Geophysical Research Letters, Vol. 36, Issue 16, DOI: 10.1029/2009GL039628
Lindzen, R., and Choi, Y.-S., 2010. On the observational determination of climate sensitivity and its implications. Asia-Pacific Journal of the Atmospheric Sciences, Vol. 47, Issue 4, p. 377-390, DOI: 10.1007/s13143-011-0023-x
Lindzen, R. S., 2012. Climate Science: Is it currently designed to answer questions? Euresis (Associazone per la promozione e la diffusione della cultura e del lavoro scientifico) and the Templeton Foundation on Creativity and Creative Inspiration in Mathematics, Science, and Engineering: Developing a Vision for the Future. The meeting was held in San Marino from 29-31 August 2008, 36 pp.
Lindzen, R. S., 2013. Science in the public square: Global Climate Alarmism and Historical Precedents. Journal of American Physicians and Surgeons, Vol. 18, Number 3, Fall issue, p. 70-73, https://www.jpands.org/vol18no3/lindzen.pdf
Lindzen, R., 2016. GLOBAL WARMING and the irrelevance of science. The Global Warming Policy Foundation, GWPF Essay 4, 21 pp., https://www.thegwpf.org/content/uploads/2016/04/Lindzen.pdf, accessed and archived on November 20, 2020
Lindzen, R. S., 2017. Straight Talk about Climate Change. Academic Questions, A Publication of the National Association of Scholars, ISSN 0895-4852, 17 pp., DOI: 10.1007/s12129-017-9669-x
Lindzen, R., 2019. On Climate Sensitivity. CO2 Coalition: Climate Issues in Depth Series, December, https://friendsofscience.org/index.php?id=2493, http://co2coalition.org/wp-content/uploads/2019/12/Lindzen_On-ClimateSensitivity.pdf, accessed and archived on November 26, 2020.
Lisiecki, L. E., and Raymo, M. E., 2005. A Pliocene-Pleistocene stack of 57 globally distributed benthic δ 18O records. Paleoceanography, Vol. 20, Issue 1, PA1003, 17 pp., https://doi.org/10.1029/2004PA001071
Liu, K.-b., Shen, C., and Louie, K.-s, 2001. A 1,000-Year History of Typhoon Landfalls in Guangdong, Southern China, Reconstructed from Chinese Historical Documentary Records. Annals of the Association of American Geographers, Vol. 91, Issue 3, p. 453–464, https://doi.org/10.1111/0004-5608.00253
Liu, X. D., Shi, Z., 2009. Effect of precession on the Asian summer monsoon evolution: A systematic review. Chinese Science Bulletin, 54 (20): 3720–3730, DOI: 10.1007/s11434-009-0540-5
Liu, Y, et al., 2009. Annual temperatures during the last 2485 years in the Mid-Eastern Tibetan Plateau inferred from tree rings. Science in China Series D Earth Sciences, Vol. 52, n°3, p. 348-359, DOI: 10.1007/s11430-009-0025-z
Liu, Y, et al., 2011. Amplitudes, rates, periodicities and causes of temperature variations in the past 2485 years and future trends over the central-eastern Tibetan Plateau. Chinese Science Bulletin. Vol. 56, n°28-29, p. 2986-2994, DOI: 10.1007/s11434-0114713-7, https://link.springer.com/content/pdf/10.1007/s11434-011-4713-7.pdf
Liu, J., et al., 2022. Mortality burden attributable to high and low ambient temperatures in China and its provinces: Results from the Global Burden of Disease Study 2019. The Lancet Regional Health - Western Pacific, Vol. 24, article 100493, 11 pp., https://doi.org/10.1016/j.lanwpc.2022.100493
Ljung, L., and Glad, T., 1994. Modeling of Dynamic Systems. Prentice Hall Information and System Sciences Series, ISBN 0-13-5970970, 361 pp.
Ljungqvist, F. C., Krusic, P. J., Brattström, G., and Sundqvist, H. S., 2012. Northern Hemisphere temperature patterns in the last 12 centuries. Climate of the Past, Vol. 8, p. 227–249, DOI: 10.5194/cp-8-227-2012
Lloyd, E. A., 2012. The debates about satellite MSU data and climate models: the role of `simple' empiricism. Studies in History and Philosophy of Science, Vol.43, Issue 2, p. 390-401, http://dx.doi.org/10.1016/j.shpsa.2012.02.001
Lockwood, G. W., and Skiff, B. A., 1990. Some insights on solar variability from precision stellar astronomical photometry. In: Conference on the Climate Impact of Solar Variability, August 1, p. 8-15, Lowell Observatory; Flagstaff, AZ, United States, https://ntrs.nasa.gov/search.jsp?R=19910003145
Lockwood, G. W., Skiff, B. A., Baliunas, S. L., and Radick, R. R., 1992. Long-term solar brightness changes estimated from a survey of sun-like stars. Nature, Vol. 360, Issue 6405, p. 653–655, DOI: 10.1038/360653a0.
Lockwood, G. W., Skiff, B. A., and Radick, R. R., 1997. The Photometric Variability of Sun‐like Stars: Observations and Results, 1984–1995. The Astrophysical Journal, Vol. 485, Issue 2, p. 789-811, DOI: 10.1086/304453
Lockwood, M., 2006. What do cosmogenic isotopes tell us about past solar forcing of climate? Space Science Reviews, Vol. 125, p. 95–109, DOI: 10.1007/s11214-006-9049-2
Lockwood, M., and Ball, W. T., 2020. Placing limits on long-term variations in quiet-Sun irradiance and their contribution to total solar irradiance and solar radiative forcing of climate. Proceedings of The Royal Society A Mathematical Physical and Engineering Sciences, Vol. 476, Issue 2238, Article 20200077, DOI: 10.1098/rspa.2020.0077
Lohmann, G., Zhang, X., and Knorr, G., 2016. Abrupt climate change experiments: the role of freshwater, ice sheets and deglacial warming for the Atlantic Meridional Overturning Circulation. Polarforschung, Vol. 85, n°2, p. 161-170, DOI: 10.2312/polfor.2016.013
Lohmann, U., and Gasparini, B., 2017. A cirrus cloud climate dial? Science, Vol. 357, Issue 6348, p. 248-249, DOI: 10.1126/science.aan3325
Lomborg, B., 2007. Cool It: The Skeptical Environmentalist's Guide to Global Warming 729 Knopf Publishing Group, ISBN: 978-0-30726692-7, 272 pp.
Lomborg, B., 2020a. False Alarm: How Climate Change Panic Costs Us Trillions, Hurts the Poor, and Fails to Fix the Planet. ISBN-13 : 978-1541647466, Basic Books, Hachette Book Group, 1290 Avenue of the Americas, New York, NY 10104, www.basicbooks.com, 320 pp.
Lomborg, B., 2020b. Welfare in the 21st century: Increasing development, reducing inequality, the impact of climate change, and the cost of climate policies. Technological Forecasting and Social Change, Vol. 156, 119981, 35 pp., DOI: 10.1016/j.techfore.2020.119981
Lomborg, 2022. How The Climate Elite Spread Misery. The Wall Street Journal, July 21, https://www.wsj.com/articles/how-theclimate-elite-spread-misery-heat-wave-global-warming-energy-adapted-temperatures-deaths-environment-11658437091 and also https://climatechangedispatch.com/lomborg-how-the-climate-elite-spread-misery/, accessed and archived July 24, 2022.
Longhurst, A., 2015. Doubt and Certainty in Climate Science, e-book, March 2012 – September2015, 236 pp. https://curryja.files.wordpress.com/2015/09/longhurst-final.pdf
https://www.academia.edu/35571845/DOUBT_AND_CERTAINTY_IN_CLIMATE_SCIENCE_https_curryja.files.wordpress.com_ 2015_09_longhurst-print.pdf, accessed and archived October 27, 2020.
Longpré, M.-A., Stix, J., Burkert, C., Hansteen, T., and Kutterolf, S., 2014. Sulfur budget and global climate impact of the A.D. 1835 eruption of Cosigüina volcano, Nicaragua. Geophysical Research Letters, Vol. 41, Issue 19, p. 6667-6675. https://doi.org/10.1002/2014GL061205
Looney, B., 2020. bp Statistical Review of World Energy 2020 - 69th edition, 68 pp., https://www.bp.com/content/dam/bp/businesssites/en/global/corporate/pdfs/energy-economics/statistical-review/bp-stats-review-2020-full-report.pdf, accessed and archived October 31, 2020.
Loose, B., et al., 2018. Evidence of an active volcanic heat source beneath the Pine Island Glacier. Nature Communications, Vol. 9, Article number: 2431, 9 pp., https://doi.org/10.1038/s41467-018-04421-3
López-Pérez, A., 2017. Revisiting the Cenozoic History and the Origin of the Eastern Pacific Coral Fauna. In: book Coral Reefs of the Eastern Tropical Pacific: Persistence and Loss in a Dynamic Environment, P.W. Glynn et al. (eds.), Springer Science+Business Media Dordrecht, p.39-57, DOI: 10.1007/978-94-017-7499-4_2
Lord, N. S., Ridgwell, A., Thorne, M. C., and Lunt, D. J., 2016. An impulse response function for the long tail of excess atmospheric CO 2 in an Earth system model. Global Biogeochemical Cycles, Vol. 30 , p. 2–17, DOI: 10.1002/2014GB005074.
Lorenz, E. N., 1963a. The Predictability of Hydrodynamic Flow. Transactions of the New York Academy of Sciences, Series II, Vol. 25, No. 4, p. 409-432, https://doi.org/10.1111/j.2164-0947.1963.tb01464.x
Lorenz, E. N., 1963b. Deterministic nonperiodic flow Journal of the Atmospheric Sciences, Vol. 20, Issue 2, p. 130-141, DOI: 10.1175/1520-0469(1963)020<0130:DNF>2.0.CO;2
Lorenz, E. N., 1965: A study of the predictability of a 28-variable atmospheric model. Tellus, Vol. 17, Issue 3, p. 321-333, https://doi.org/10.1111/j.2153-3490.1965.tb01424.x
Lorenz, E. N., 1967. The Nature and Theory of the General Circulation of the Atmosphere. World Meteorological Organization, 159 pp., http://users.uoa.gr/~pjioannou/historical/Lorenz-1967.pdf
Lorenz, E. N. 1975. Climatic predictability. In The Physical Basis of Climate and Climate Modelling. report of the International Study Conference in Stockholm, 29 July - 10 August 1974, organised by WMO and ICSU and supported by UNEP, WMO GARP Publication Series No 16, World Meteorological Organisation: Geneva.
Lorenz, E. N., 1993. The essence of chaos. University College London Press, ISBN: 1-85728-454-2 PB, 229 pp.
Lorenz, V., and Zimanowski, B. 2008. Volcanology of the West Eifel Maars and its relevance to the understanding of kimberlite pipes. Physical Volcanological Laboratory, University of Würzburg, Germany, 9th International Kimberlite Conference, Frankfurt, Germany, 11-16 August , 85 pp., available at https://www.researchgate.net/
729A groundbreaking book that transforms the debate about global warming by offering a fresh perspective based on human needs as well as environmental concerns. Rather than starting with the most radical procedures, Lomborg argues that we should first focus our resources on more immediate concerns, such as fighting malaria and HIV/AIDS and assuring and maintaining a safe, fresh water supply-which can be addressed at a fraction of the cost and save millions of lives within our lifetime. He asks why the debate over climate change has stifled rational dialogue and killed meaningful dissent. https://www.lomborg.com/
Lorius, C., 1963. Le deutérium, possibilités d'application aux problèmes de recherche concernant la neige, le névé et la glace dans l'Antarctique. Thèse de Doctorat ès Sciences Physiques, spécialité: Sciences de la Terre, Géochimie, Faculté des sciences de Paris, https://tel.archives-ouvertes.fr/tel-00926566/document
Lowe, D. J., and Pittari, A., 2014. An ashy septingentenarian: the Kaharoa tephra turns 700. Geoscience Society of New Zealand Newsletter 11, https://pdfs.semanticscholar.org/b04b/17d77160d80febb5eb029bf9b60cd42c5c18.pdf
Lovelock, J. E., 1972. Gaia as seen through the atmosphere - Letter to the Editors. Atmospheric Environment, Vol. 6, p. 579-580, DOI: 10.1016/0004-6981(72)90076-5
Lovelock, J. E., and Margulis, L., 1974. Atmospheric homeostasis by and for the biosphere: the Gaia hypothesis. Tellus XXVI, 1–2 Series A., p. 2–10, https://doi.org/10.3402/tellusa.v26i1-2.9731
Lovelock, J. E., 1979. Gaia: A New Look at Life on Earth. Oxford University Press, ISBN 0-19-286218-9, 148 pp.
Lovelock, J. E., 2006. The Revenge of Gaia. Penguin Books, ISBN 978-0-141-02597-1, 22 pp.
Lovelock, J. E., 2014. A Rough Ride to the Future. The Overlook Press, Peter Mayer Publishers, Inc., New York, NY, ISBN: 978-1-46831160-0, 174 pp.
Lu, Z., 2009. Analysis of stationary and non-stationary long memory processes: estimation, applications and forecast. Thèse de Doctorat de l'École normale supérieure de Cachan, spécialité: Mathematiques, 181 pp.
Lucht, W., et al., 2002. Climatic control of the high-latitude vegetation greening trend and Pinatubo effect. Science, Vol. 296, Issue 5573, p. 1687-1689, doi: 10.1126/science.1071828
Lüdecke, H.-J., Link, R., Ewert, F.-K., 2011. How Natural is the Recent Centennial Warming? An Analysis of 2249 Surface Temperature Records. International Journal of Modern Physics C, Vol. 22, Issue 10, p. 1139-1159, https://www.worldscientific.com/doi/abs/10.1142/S0129183111016798, https://doi.org/10.1142/S0129183111016798
Lüdecke, H.-J. , Weiss, C.-O., and Hempelmann, A., 2015. Paleoclimate forcing by the solar De Vries/Suess cycle. Climate of the Past Discussions, Vol. 11, n°1, p. 279-305, DOI: 10.5194/cpd-11-279-2015
Lüdecke, H.-J., and Weiss, C.-O., 2017. Harmonic Analysis of Worldwide Temperature Proxies for 2000 Years. The Open Atmospheric Science Journal, Vol. 14, p. 44-53, https://benthamopen.com/FULLTEXT/TOASCJ-11-44, DOI: 10.2174/1874282301711010044
Luo, D., and Cha, J., 2012. The North Atlantic Oscillation and the North Atlantic Jet Variability: Precursors to NAO Regimes and Transitions. Journal of the Atmospheric Sciences, Vol. 69, Issue 12, p. 3763-3787, https://doi.org/10.1175/JAS-D-12-098.1
Lupi, M., et al., 2010. The Askja volcano eruption in 1875 - where did all the water come from? Journal of Volcanology and Geothermal Research, Vol. 203, p. 146–157, DOI: 10.1016/j.jvolgeores.2011.04.009
Lupo, A., and Kininmonth, W., 2013. Global Climate Models and Their Limitations. In: The NIPCC Report on Scientific Consensus, Climate Change Reconsidered II, Published for the Nongovernmental International Panel on Climate Change (NIPCC) by The Heartland Institute, https://www.heartland.org/_template-assets/documents/CCR/CCR-II/Chapter-1-Models.pdf, 148 pp., accessed and archived on November 27, 2020.
Luterbacher, J., et al., 2002a. Reconstruction of Sea Level Pressure fields over the Eastern North Atlantic and Europe back to 1500. Climate Dynamics, Vol. 18, Issue 7, p. 545-561, DOI: 10.1007/s00382-001-0196-6
Luterbacher, J., et al., 2002b. Extending North Atlantic oscillation reconstructions back to 1500. Atmospheric Science Letters, Vol. 2, Issue 1-4, p. 114–124, https://doi.org/10.1006/asle.2002.0047
Luterbacher, J., Dietrich, D., Xoplaki, E., Grosjean, M., and Wanner, H., 2004. European seasonal and annual temperature variability, trends, and extremes since 1500. Science, Vol. 303, Issue 5663, p. 1499-1503, doi: 10.1126/science.1093877.
Luterbacher, J., et al., 2016. European summer temperatures since Roman times. Environmental Research Letters, Vol.11, 12 pp., DOI: 10.1088/1748-9326/11/2/024001
Lyle, M., et al. 2008. Pacific Ocean and Cenozoic evolution of climate. Reviews of Geophysics, Vol. 46, Issue 2, Paper n°2005RG000190, RG2002, 47 pp., https://doi.org/10.1029/2005RG000190
Lyman, J. M., et al., 2010. Robust warming of the global upper ocean. Nature, Vol. 465, Issue 7296, p. 334-337, DOI: 10.1038/nature09043
Lynch, P., 2008a. The origins of computer weather prediction and climate modeling. Journal of Computational Physics, Vol. 227, Issue 7, p. 3431-3444, DOI: 10.1016/j.jcp.2007.02.034
Lynch, P., 2008b. The ENIAC Forecasts - A Recreation. Bulletin of the American Meteorological Society, January, 11 pp, https://maths.ucd.ie/~plynch/Publications/BAMS-ENIAC.pdf
Lynch, P., 2014. The Emergence of Numerical Weather Prediction: Richardson's Dream. MR3244181 Paperback edition, Cambridge, ISBN: 978-1-107-41483-9, xii+279 pp, https://maths.ucd.ie/~plynch/Dream/ Lyot, B., 1929. Recherches sur la polarisation de la lumière des planètes et de quelques substances terrestres. Thèse Faculté des sciences de Paris et Annales de l'Observatoire de Paris, Section de Meudon, Vol VIII, No. 1, 161 pp. Lynn, J., 2016. The AR6 process: How the IPCC produces reports. IPCC Head of Communications, Octo 14, 2016, Bangkok, https://www.slideshare.net/ipcc-media/the-ar6-process-how-the-ipcc-produces-reports Ma, L., and Vaquero, J. M., 2020. New evidence of the Suess/de Vries cycle existing in historical naked-eye observations of sunspots. Open Astronomy, Vol. 29, p. 28-31, DOI: 10.1515/astro-2020-0004 Macdonald, F.M., Swanson-Hysell, N.L., Park, Y., Lisiecki, L., and Jagoutz, O., 2019. Arccontinent collisions in the tropics set Earth’s climate state. Science, Vol. 364, Issue 6436, p. 181-184, https://www.science.org/doi/10.1126/science.aav5300 Macias, D., Stips, A., Garcia-Gorriz, E., 2014. Application of the Singular Spectrum Analysis Technique to Study the Recent Hiatus on the Global Surface Temperature Record. PLoS ONE, Vol. 9, Issue 9, e107222, 7 pp., https://doi.org/10.1371/journal.pone.0107222
Mackay, C., 1841. Memoirs of Extraordinary Popular Delusions and the Madness of Crowds. In three volumes: "National Delusions", "Peculiar Follies", and "Philosophical Delusions", Vol. 1, 646 pp., 2nd edition in 1952 available here: https://www.trendfollowing.com/whitepaper/mackay_extraordinary_popular_delusions.pdf
Mackey, K. R. M., Morris, J. J. , Morel, F. M. M., and Kranz, S. A., 2015. Response of photosynthesis to ocean acidification. Oceanography, Vol. 28, n°2, p. 74–91, http://dx.doi.org/10.5670/oceanog.2015.33.
MacIntosh, C., 2022. The “Net Zero” Agenda Has Devastating Consequences. Doug Casey's International Man, https://internationalman.com/articles/the-net-zero-agenda-has-devastating-consequences-heres-what-you-need-to-know/ accessed and archived on September 5, 2022.
Mackintosh, A. N., et al., 2017. Regional cooling caused recent New Zealand glacier advances in a period of global warming. Nature Communications, Vol. 8, Article: 14202, 13 pp., DOI: 10.1038/ncomms14202
MacRae, A. M. R., 2019. The Next Great Extinction Event Will Not be Global Warming – It Will Be Global Cooling. Tropical Hot Spot Research, August, https://thsresearch.wordpress.com/2019/09/05/the-next-great-extinction-event-will-not-be-globalwarming-it-will-be-global-cooling/, accessed and archived October 27, 2020.
Maddala, G.S., and Kim, I.-M., 1998. Unit Roots, Cointegration and Structural Change, Cambridge University Press, ISBN 978-0-52158782-2, 505 pp., https://danielmorochoruiz.files.wordpress.com/2015/09/g-s-maddala-in-moo-kim-unit-rootscointegration-and-structural-change-themes-in-modern-econometrics-1998.pdf
Madec, G., and the NEMO team, 2015. NEMO (Nucleus for European Modelling of the Ocean) ocean engine v3.6, Note du Pôle de modélisation, Institut Pierre-Simon Laplace (IPSL), ISSN No 1288-1619, 401 pp, https://epic.awi.de/id/eprint/39698/1/NEMO_book_v6039.pdf
Magomedov, E., 2021. Roland Breeur: Lies—Imposture—Stupidity. Continental Philosophy Review, Vol. 54, Issue 1, 113-117, https://doi.org/10.1007/s11007-020-09519-4
Mahaney, W. C., et al., 2018. Reconnaissance of the Hannibalic Route in the Upper Po Valley, Italy: Correlation with Biostratigraphic Historical Archaeological Evidence in the Upper Guil Valley, France. Archaeometry, 17 pp., https://doi.org/10.1111/arcm.12405
Maher, N., McGregor, S. England, M. H. and Gupta, A. S., 2015. Effects of volcanism on tropical variability. Geophysical Research Letters, Vol. 42, p. 6024–6033, DOI: 10.1002/2015GL064751.
Maher, N., Milinski, S., Suarez-Gutierrez, L., et al., 2019. The Max Planck Institute Grand Ensemble: Enabling the Exploration of Climate System Variability. Journal of Advances in Modeling Earth Systems, Vol. 11, Issue 7., p. 2050-2069, https://doi.org/10.1029/2019MS001639
Maher, N., et al., 2019. The Max Planck Institute Grand Ensemble: Enabling the Exploration of Climate System Variability. Journal of Advances in Modeling Earth Systems, Vol 11, Issue 7, p. 2050-2069, https://doi.org/10.1029/2019MS001639
Maher, N., Lehner, F., and Marotzke, J., 2020. Quantifying the role of internal variability in the temperature we expect to observe in the coming decades. Environmental Research Letters, Vol. 15, n°5, 054014, https://doi.org/10.1088/1748-9326/ab7d02
Maher, N., Milinski, S., and Ludwig, R., 2021. Large ensemble climate model simulations: introduction, overview, and future prospects for utilising multiple types of large ensemble. Earth System Dynamics, Vol. 12, Issue 2, p. 401–418, 2021, https://doi.org/10.5194/esd-12-401-2021
Mahfouf, J.-F., and Borrel, J., 1995. L'impact climatique des éruptions volcaniques. La Météorologie, 8 ème série, n° 10, p. 10-27, https://doi.org/10.4267/2042/51959
Maier-Reimer, E., and Hasselmann, K., 1987. Transport and storage of CO2 in the ocean – an inorganic ocean-circulation carbon cycle model. Climate Dynamics, Vol. 2, p. 63–90, https://doi.org/10.1007/BF01054491
Maier-Reimer, E., Mikolajewicz, U., and Winguth, A., 1996. Future ocean uptake of CO 2: interaction between ocean circulation and biology. Climate Dynamics, Vol 12, p. 711-721, https://doi.org/10.1007/s003820050138
Malatesta, A. T., and Zarlenga, F., 1988. Evidence of Middle Pleistocene marine transgressions along the Mediterranean Coast. Palaeogeography Palaeoclimatology Palaeoecology, Vol. 68, Issues 2-4, p. 311-315, DOI: 10.1016/0031-0182(88)90048-X
Malherbe, J.-M., 2010. Introduction à la physique du Soleil. École thématique. 2010, pp.137. ffcel00682269. https://cel.archivesouvertes.fr/cel-00682269/document
Malhotra, R., 1998. Orbital Resonances and Chaos in the Solar System. Solar system Formation and Evolution, ASP Conference Series, Vol. 149, D. Lazzaro et al., eds., p. 37-63, https://www.lpl.arizona.edu/~renu/malhotra_preprints/rio97.pdf
Malhotra, R., Holman, M., and Ito, T., 2001. Chaos and stability of the solar system, Proc. of the Natl. Acad. of Sci. of the U.S.A., Vol. 98, n°22, p. 12342-12343, https://doi.org/10.1073/pnas.231384098
Malhotra, R., 2021. New results on orbital resonances. https://arxiv.org/abs/2111.09289, accessed and archived on August 6, 2022. Maliniemi, V., 2016. Observations of Solar Wind Related Climate Effects in the Northern Hemisphere Winter. Thesis, Report Series in Physical Sciences, Report n°105, University of Oulu, 64 pp., https://pdfs.semanticscholar.org/608f/2c7c8f9a666d53eab144356257b02d7015ca.pdf
Maliniemi, V., Asikainen, T., Salminen, A., and Mursula, K., 2019. Assessing North Atlantic winter climate response to geomagnetic activity and solar irradiance variability. Quarterly Journal of the Royal Meteorological Society, Vol.145, Issue 725, p.3780–3789, https://doi.org/10.1002/qj.3657
Manabe, S. and Möller, F., 1961. On the radiative equilibrium and heat balance of the atmosphere. Monthly Weather Review, Vol.89, Issue 12, p. 503-532, DOI: 10.1175/1520-0493, ftp://ftp.library.noaa.gov/docs.lib/htdocs/rescue/mwr/089/mwr-089-12-0503.pdf
Manabe, S. and Strickler, R. F., 1964. Thermal Equilibrium of the Atmosphere with a Convective Adjustment Journal of the Atmospheric Sciences, Vol. 21, Issue 4, p. 361-385, https://doi.org/10.1175/1520-0469(1964)021<0361:TEOTAW>2.0.CO;2
Manabe, S., and Wetherald, R. T., 1967. Thermal Equilibrium of the Atmosphere with a Given Distribution of Relative Humidity. Journal of the Atmospheric Sciences, Vol. 24, n°3, pp 241-259, DOI: 10.1175/1520-0469(1967)024<0241:TEOTAW>2.0.CO;2
Manabe, S., 1969a. Climate and the ocean circulation, I, The atmospheric circulation and the hydrology of the Earth's surface. Monthly Weather Review, vol. 97, No. 11, p. 739-774, DOI: 10.1175/1520-0493(1969)09760;0739:catoc62;2.3.co;2
Manabe, S., 1969b. Climate and the ocean circulation, II, The atmospheric circulation and the Effect of Heat Transfer by Ocean Currents. Monthly Weather Review, vol. 97, No. 11, p. 775-805, DOI: 10.1175/1520-0493(1969)097<0739:CATOC>2.3.CO;2
Manabe, S., 1969c. Climate and the ocean circulation, III, The Ocean Model. Monthly Weather Review, vol. 97, No. 11, p. 806-827, DOI: 10.1175/1520-0493(1969)097<0806:CATOC>2.3.CO;2
Manabe, S., and Bryan, K., 1969. Climate calculations with a combined ocean-atmosphere model. Journal of the Atmospheric Sciences, Vol. 26, Issue 4, p. 786-789, https://doi.org/10.1175/1520-0469(1969)026<0786:CCWACO>2.0.CO;2
Manabe, S., Smagorinsky, J., Holloway Jr., J. L., and Stone, H. M., 1970. Simulated climatology of a general circulation model with a hydrologic cycle. Monthly Weather Review, Vol. 98, No. 3, p. 175-212, DOI: 10.1175/15200493(1970)098<0175:SCOAGC>2.3.CO;2
Manabe, S., and Stouffer, R. J., 1980. Sensitivity of a Global Climate Model to an Increase of CO 2 Concentration in the Atmosphere. Journal of Geophysical Research, Vol. 85, No. C10, p. 5529-554, https://doi.org/10.1029/JC085iC10p05529
Mandelbrot, B. B., Wallis, J. R. 1969a. Computer experiments with Fractional Gaussian noises: Part 1. Water Resources Research, Vol.5, Issue 1, p. 228-241, https://doi.org/10.1029/WR005i001p00228
Mandelbrot, B. B., Wallis, J. R. 1969b. Computer experiments with Fractional Gaussian noises: Part 2. Water Resources Research, Vol. 5, Issue 1, p. 242-259, https://doi.org/10.1029/WR005i001p00242
Mandelbrot, B. B., Wallis, J. R. 1969c. Computer experiments with Fractional Gaussian noises: Part 3. Water Resources Research, Vol. 5, Issue 1, p. 260-267, https://doi.org/10.1029/WR005i001p00260
Mandelbrot, B. B., and Wallis, J. R., 1969d. Global dependence in geophysical records (Some long‐run properties of geophysical records). Water Resources Research, Vol. 5, Issue 2, p. 321-340, https://doi.org/10.1029/WR005i002p00321, https://users.math.yale.edu/mandelbrot/web_pdfs/056geophysicalRecords.pdf
Mandelbrot, B.B., Hudson, R.L., 2004. The (mis)Behaviour of Markets: A Fractal View of Risk, Ruin, and Reward, 2nd ed., Profile Books, London, UK, 2008, eISBN : 978-0-465-00468-3, 352 pp.
Manley, G., 1974. Central England temperatures: monthly means 1659 to 1973. Quaterly Journal of the Royal Meteorological Society, Vol. 100, Issue 425, p. 389-405, https://doi.org/10.1002/qj.49710042511
Mann, A., 2019. To improve weather and climate models, researchers are chasing atmospheric gravity waves. Proc. of the Natl. Acad. of Sci. of the U.S.A., Core Concepts, Vol. 116, n°39, p. 19218-19221, https://doi.org/10.1073/pnas.1912426116
Mann, M. E., Bradley, R. S., and Hughes, M. K., 1998. Global-scale temperature patterns and climate forcing over the past six centuries. Nature, Vol. 392, Issue 6678, p. 779–787, DOI: 10.1038/33859
Mann, M. E., Bradley, R. S., and Hughes, M. K., 1999. Northern Hemisphere Temperatures During the Past Millennium: Inferences, Uncertainties, and Limitations. Geophysical Research Letters, Vol. 26, Issue 6, p. 759-762, https://doi.org/10.1029/1999GL900070
Mann, M. E., 2002. Medieval Climatic Optimum. in Encyclopedia of Global Environmental Change, Volume 1, The Earth system: physical and chemical dimensions of global environmental change, John Wiley & Sons, ISBN 0-471-97796-9, p. 514–516
Mann, M. E., 2002. Little Ice Age. In: Encyclopedia of Global Environmental Change, Munn T, ed., Volume 1, The Earth system: physical and chemical dimensions of global environmental change, John Wiley & Sons, ISBN 0-471-97796-9, p. 504-509. http://www.meteo.psu.edu/holocene/public_html/shared/articles/littleiceage.pdf
Mao, W.L., Koh, C.A., and Sloan, E.D., 2007. Clathrate hydrates under pressure. Physics Today, Vol. 60, Issue 10, p. 42-47, https://doi.org/10.1063/1.2800096
Marañόn, E., et al., 2016. Coccolithophore calcification is independent of carbonate chemistry in the tropical ocean. Limnology and Oceanography, Vol. 61, Issue 4, p. 1345-1357, DOI: 10.1002/lno.10295
Marchand, M., et al., 2012. Dynamical amplification of the stratospheric solar response simulated with the Chemistry-Climate Model LMDz-Reprobus. Journal of Atmospheric and Solar-Terrestrial Physics, Vol. 75-76, p. 147–160, DOI: 10.1016/j.jastp.2011.11.008
Marchitto, T. M., Muscheler, R., Ortiz, J. D., Carriquiry, J. D., and van Geen, A., 2010. Dynamical Response of the Tropical Pacific Ocean to Solar Forcing During the Early Holocene. Science, vol. 330, p. 1378-1381, DOI: 10.1126/science.1194887
Marcott, S., Shakun, J. D., Clark, P. U., and Mix, A. C., 2013. A Reconstruction of Regional and Global Temperature for the Past 11,300 Years. Science, Vol. 339, Issue 6124, p. 1198-1201, DOI: 10.1126/science.1228026 and Supplementary Materials https://science.sciencemag.org/content/suppl/2013/03/07/339.6124.1198.DC1
Mardling, R., 2008. Resonance, Chaos and Stability: The Three-Body Problem in Astrophysics. Part of the Lecture Notes in Physics book series (LNP,volume 760), The Cambridge N-Body Lectures pp 59–96, DOI: 10.1007/978-1-4020-8431-7_3
Margaritelli, G., et al., 2020. Persistent warm Mediterranean surface waters during the Roman period. Scientific Reports, Vol. 10, Article n°10431, 10 pp., https://doi.org/10.1038/s41598-020-67281-2
Marinov, I., Sarmiento, J. L., 2004. The Role of the Oceans in the Global Carbon Cycle: An Overview. In: The Ocean Carbon Cycle and Climate. NATO Science Series (Series IV: Earth and Environmental Sciences), Follows M., Oguz T. (eds.), Vol 40., p. 251-295, Springer, Dordrecht, https://doi.org/10.1007/978-1-4020-2087-2_8
Markonis, Y., and Koutsoyiannis, D., 2013. Climatic Variability Over Time Scales Spanning Nine Orders of Magnitude: Connecting Milankovitch Cycles with Hurst–Kolmogorov Dynamics. Surveys in Geophysics, Vol. 34, Issue 2, https://doi.org/10.1007/s10712-012-9208-9
Markovsky, A. G., 2016. Liberal Bolshevism: America Did Not Defeat Communism, She Adopted It. Dog Ear Publishing, LLC, ISBN-13: 978-1457548529, 318 pp.
Marmol, E., and Mager, L., 2019. "Fake News": The Trojan Horse for Silencing Alternative News and Reestablishing Corporate News Dominance. Chapter 8, In book: Censored 2020: Through the looking glass: The top censored stories and media analysis of 2018-2019, Publisher: Seven Stories Press, p.221-253.
Marquer, L., et al., 2014. Holocene changes in vegetation composition in northern Europe: why quantitative pollen-based vegetation reconstructions matter. Quaternary Science Reviews, Vol. 90, p. 199-216, http://dx.doi.org/10.1016/j.quascirev.2014.02.013
Marquer, L., 2017. Quantifying the effects of land use and climate on Holocene vegetation in Europe. Quaternary Science Reviews, Vol. 171, p. 20-37, http://dx.doi.org/10.1016/j.quascirev.2017.07.001
Marsh, N., and Svensmark, H., 2000. Cosmic rays, clouds, and climate. Space Science Reviews, Vol. 94, p. 215–230, DOI: 10.1023/A:1026723423896
Marsh, N., and Svensmark, H., 2003. Galactic cosmic ray and El Nino–Southern Oscillation trends in International Satellite Cloud Climatology Project D2 low-cloud properties. Journal of Geophysical Research, Vol. 108, n° D6, 4195, DOI: 10.1029/2001JD001264
Marshall, J., Hill, C., Perelman, L., and Adcroft, A., 1997. Hydrostatic, quasi-hydrostatic, and nonhydrostatic ocean modeling. Journal of Geophysical Research, Oceans, Vol. 102, n°C3, p. 5733-5752, https://doi.org/10.1029/96JC02776
Marshall, J. and Speer, K., 2012. Closure of the meridional overturning circulation through Southern Ocean upwelling. Nature Geoscience. Vol. 5, n°3, p. 171–180, DOI: 10.1038/ngeo1391, http://oceans.mit.edu/JohnMarshall/wpcontent/uploads/2013/08/Closure-of-the-meridional-overturning_134.pdf
Martínez-Botí, M. A., et al., 2015. Boron isotope evidence for oceanic carbon dioxide leakage during the last deglaciation. Nature, Vol. 518, Issue 7538, p. 219-222, DOI: 10.1038/nature14155
Marvel, K., G.A. Schmidt, R.L. Miller, and L. Nazarenko, 2016. Implications for climate sensitivity from the response to individual forcings. Nature Clim. Change, 6, no°4, p. 386-389, DOI: 10.1038/nclimate2888
Mascart, J., 1925. Notes sur la variabilité des climats. Lyon, M. Audin et Cie, Rue Davout, n°3, 383 pp., OCR scanned, https://gallica.bnf.fr/ark:/12148/bpt6k3117971.texteImage#, accessed and archived February 24, 2021.
Maslin, C., Seidov, D., and Lowe, J. 2001. Synthesis of the Nature and Causes of Rapid Climate Transitions During the Quaternary. Geophysical Monograph Series, 126, p. 9-52, DOI: 10.1029/GM126p0009
Maslin, M. A., and Ridgwell, A.J. 2005. Mid-Pleistocene revolution and the 'eccentricity myth'. In: Early-Middle Pleistocene transitions: The land-ocean evidence, Head, M. J., and Gibbard, P. L., (eds.), Geological Society, London, Special Publications, 247, p. 19-34, DOI: 10.1144/GSL.SP.2005.247.01.02
Maslowski, W, Kinney, J. C., Higgins, M., and Roberts, A., 2013. The Future of Arctic Sea Ice. Annual Review of Earth and Planetary Sciences , Vol . 40, p. 625-654, DOI: 10.1146/annurev-earth-042711-105345
Massé, G., Rowland, S. J. , Sicre, M.-A., Jacob, J., Jansen, E. , and Belt, S. T., 2008. Abrupt climate changes for Iceland during the last millennium: Evidence from high resolution sea ice reconstructions, Earth and Planetary Science Letters, Vol. 269, Issue 3-4, p. 565–569, DOI: 10.1016/j.epsl.2008.03.017
Massen, F., and Beck, E.G., 2011. Accurate Estimation of CO2 Background Level from Near Ground Measurements at Non-Mixed Environments. In book: The Economic, Social and Political Elements of Climate ChangeEdition: Climate Change Management, Chapter: 31: Accurate estimation of CO2 background level from near ground measurements at non mixed environments, Publisher: SpringerEditors: Walter Leal Filho, DOI: 10.1007/978-3-642-14776-0
Matkin, J., 2017. Why do so many people think climate change is a liberal conspiracy?, 181 pp.
Matoza, R. S., et al., 2022. Atmospheric waves and global seismoacoustic observations of the January 2022 Hunga eruption, Tonga. Science, https://www.science.org/doi/pdf/10.1126/science.abo7063
Matsumura, S., Yamazaki, K., and Suzuki, K., 2021. Slow-down in summer warming over Greenland in the past decade linked to central Pacific El Niño. Communications Earth & Environment, Vol 2, Article number 257, 8 pp., https://doi.org/10.1038/s43247-021-00329-x
Matthews, J. B. R., 2013. Comparing historical and modern methods of sea surface temperature measurement – Part 1: Review of methods, field comparisons and dataset adjustments. Ocean Science, Vol. 9, p. 683–694, www.ocean-sci.net/9/683/2013/, DOI: 10.5194/os-9-683-2013
Matthews, J. B. R. and Matthews, J. B., 2013. Comparing historical and modern methods of sea surface temperature measurement –Part 2: Field comparison in the central tropical Pacific. Ocean Science, Vol. 9, p. 695–711, https://doi.org/10.5194/os-9-6952013
Matthiä, D., Meier, M. M., and Reitz, G., 2013. Numerical calculation of the radiation exposure from galactic cosmic rays at aviation altitudes with the PANDOCA core model? Space Weather, AGU, Vol. 12, 11 pp., doi:10.1002/2013SW001022.
Maurin, J.-C., 2018. Evolutions récentes du CO2 atmosphérique (3/4). Science, climat et énergie, November 12, 2018, https://www.science-climat-energie.be/2018/11/12/evolutions-recentes-du-co2-atmospherique-3-4/, accessed and archived December 11, 2020.
Maurin, J.-C., 2019a. La croissance du CO2 dans l’atmosphère est-elle exclusivement anthropique? (1/3), Carbone 14 et Effet Suess. Science, climat et énergie, June 13, 2019, https://www.science-climat-energie.be/2019/06/13/la-croissance-du-co2-danslatmosphere-est-elle-exclusivement-anthropique-carbone-14-et-effet-suess-1-2/, accessed and archived December 11, 2020.
Maurin, J.-C., 2019b. La croissance du CO2 dans l’atmosphère est-elle exclusivement anthropique? (2/3), Carbone 14 et effet Bombe. Science, climat et énergie, July 12, 2019, http://www.science-climat-energie.be/2019/07/12/la-croissance-du-co2-danslatmosphere-est-elle-exclusivement-anthropique-2-3/, accessed and archived December 11, 2020.
Maurin, J.-C., 2019c. La croissance du CO2 dans l’atmosphère est-elle exclusivement anthropique? (3/3), Effet Bombe et Modèles du GIEC. Science, climat et énergie, July 19, 2019, http://www.science-climat-energie.be/2019/07/19/la-croissance-du-co2dans-latmosphere-est-elle-exclusivement-anthropique-3-3/, accessed and archived December 11, 2020.
Mauritsen, T., and Stevens, B., 2015. Missing iris effect as a possible cause of muted hydrological change and high climate sensitivity in models. Nature Geoscience, Vol. 8, n°5, 6 pp., DOI: 10.1038/NGEO2414
Maxwell, J. C., 1872. Theory of Heat, Third Edition, Longmans, Green, and Co., London, 313 pp, https://www3.nd.edu/~powers/ame.20231/maxwell1872.pdf, accessed and archived August 4, 2022.
Maxwell, J. C., 1873. Molecules. Nature, 8, p. 437-441.
May, A., 2015. Comparing early 20th Century warming to late 20th Century warming. August 25, 2015, https://andymaypetrophysicist.com/comparing-early-20th-century-warming-to-late-20th-century-warming/, accessed and archived September 10, 2022.
May, A., 2017. A Holocene Temperature Reconstruction Part 4: The global reconstruction. WUWT, June 9, 2017, https://wattsupwiththat.com/2017/06/09/a-holocene-temperature-reconstruction-part-4-the-global-reconstruction/, accessed and archived July 10, 2020.
May, A., and Vinós, J., 2017. The Bray (Hallstatt) Cycle. WUWT, August 8, 2017, https://wattsupwiththat.com/2017/08/08/theeffects-of-the-bray-climate-and-solar-cycle/, accessed and archived July 15, 2020.
May, A., 2018. CLIMATE CATASTROPHE! Science or Science Fiction? American Freedom Publications LLC, ISBN: 9781642554427, 308pp.
May, A., 2020a. Politics and Climate Change: a History. American Freedom Publications LLC, ISBN-13 : 978-1636252629, 346 pp. May, A., 2020b. Global Cooling will kill us all! andymaypetrophysicist.com, November 4, 2020, https://andymaypetrophysicist.com/2020/11/04/global-cooling-will-kill-us-all/, accessed and archived July 2, 2022.
Mayer, F., 1964. Untersuchungen uber Ausmass und Folgen der Klima- und Gletscherschwankungen seit dem Beginn der postglazialen Warmezeit [Studies on the extent and consequences of climate and glacier fluctuations since the beginning of the post-glacial warm period]. Zeitschrift fur Geomorphologie. Neue Folge Vol. 8, n°3, p. 257–285.
Mayewski, P. A., et al., 1993. Greenland ice core 'signal' characteristics - An expanded view of climate change. Journal of Geophysical Research Atmospheres, Vol. 981, Issue D7, p. 12839-12847, DOI: 10.1029/93JD01085
Mayewski, P. A., et al., 2004. Holocene climate variability. Quaternary Research, Vol. 62, Issue 3, p. 243-255, https://doi.org/10.1016/j.yqres.2004.07.001
Mazzarella, A., and Scafetta, N., 2011. Evidences for a quasi 60-year North Atlantic Oscillation since 1700 and its meaning for global climate change. Theoretical and Applied Climatology, Vol. 107, n°3, p. 599-609, DOI: 10.1007/s00704-011-0499-4
Mazzarella, A. 2013. Time-integrated North Atlantic Oscillation as a proxy for climatic change. Natural Science, Vol. 5, n°1A, p. 149155, DOI: 10.4236/ns.2013.51A023
Mazzarella, A., and Scafetta, N., 2018. The Little Ice Age was 1.0–1.5 °C cooler than current warm period according to LOD and NAO. Climate Dynamics, Springer, DOI: 10.1007/s00382-018-4122-6
McCarthy, G. D., et al., 2015. Ocean impact on decadal Atlantic climate variability revealed by sea-level observations. Nature, Vol. 521, Issue 7553, p. 508-510, DOI: 10.1038/nature14491
McCarthy, J., 2019. She's Seen Coral Reefs Turn to Graveyards- Now She's Fighting to Save the Oceans. Global Citizen, June 6, 2019, https://www.globalcitizen.org/en/content/seychelles-ocean-blue-economy/, accessed and archived November 28, 2020. McCracken, K.G., Dreschhoff, G.A., Smart, D.F., and Shea, M. A., 2001. Solar cosmic ray events for the period 1561-1994:2. The Gleissberg periodicity. Journal of Geophysical Research, Vol. 106, n° A10, p.21,599-21,606, DOI: 10.1029/2000JA000238
McElwain, J.C., 1998. Do fossil plants reflect palaeoatmospheric CO2 concentration in the geological past? Philosophical Transactions of the Royal Society of London B, Vol. 353, n°1365, p. 83-96, https://www.jstor.org/stable/56578
McElwain, J.C., Mayle, F.E., Beerling, D.J., 2002. Stomatal evidence for a decline in atmospheric CO2 concentration during the Younger Dryas stadial: a comparison with Antarctic ice core records. Journal of Quaternary Science, Vol. 17, p. 21-29, https://doi.org/10.1002/jqs.664
McFarlane, A., 2018. The 1970s Global Cooling Consensus was not a Myth. WUWT, November 19, 2018, https://wattsupwiththat.com/2018/11/19/the-1970s-global-cooling-consensus-was-not-a-myth, accessed April and archived November 28, 2020.
McGee, D., and deMenocal, P. B., 2017. Climatic Changes and Cultural Responses During the African Humid Period Recorded in MultiProxy Data. Oxford Research Encyclopedia of Climate Science, ISBN 9780190228620, DOI: 10.1093/acrefore/9780190228620.013.529.
McGrath, M., 2021. Climate change: IPCC report is 'code red for humanity'. bbc.com, August 9, 2021, https://www.bbc.com/news/science-environment-58130705, accessed and archived September 5, 2022.
McIntyre, S. and McKitrick, R., 2003. Corrections to the Mann et. al. (1998) Proxy Data Base and Northern Hemispheric Average Temperature Series. Energy & Environment, Vol. 14, Issue 6, https://doi.org/10.1260/095830503322793632
McIntyre, S. and McKitrick, R., 2005a. Hockey sticks, principal components, and spurious significance. Geophysical Research Letters, Vol. 32, Issue 3, L03710, 5 pp., https://doi.org/10.1029/2004GL021750
McIntyre, S., and McKitrick, R., 2005b. The Hockey Stick Debate: Lessons in Disclosure and Due Diligence. The Washington Roundtable on Science and Public Policy, Sept 7, The George Marshall Institute, 35 pp.
McIntyre, S., 2006a. NAS Panel Excerpts: #1 PCs. Climate Audit, June 28, 2006, https://climateaudit.org/2006/06/28/nas-panelexcerpts-1-pcs/, accessed and archived November 28, 2020.
McIntyre, S., 2006b. NAS Panel #2: Bristlecones. Climate Audit, June 29, 2006, https://climateaudit.org/2006/06/29/nas-panel-2bristlecones/
McIntyre, S., 2009a. Auditing Temperature Reconstructions of the Past 1000 Years. Proc. of the Conference World Federation of Scientists, Erice, Sicily, August 20, 2008, DOI: 10.1142/9789814289139_0007, https://www.researchgate.net/publication/253200074_Auditing_Temperature_Reconstructions_of_the_Past_1000_Years
McIntyre, S., 2009b. Yamal and the Divergence Problem. https://climateaudit.org/2009/10/07/yamal-and-the-divergence-problem/ McIntyre, S., 2009c. The Impact of Yamal on the Spaghetti Graph. https://climateaudit.org/2009/09/29/the-impact-of-yamal-on-thespaghetti-graph/
McIntyre, S. and McKitrick, R., 2009. Proxy inconsistency and other problems in millennial paleoclimate reconstructions. Proc. of the Natl. Acad. of Sci. of the U.S.A., vol. 106, n°6, p. E10, DOI: 10.1073/pnas.0812509106
McIntyre, S., 2010. Climategate: A Battlefield Perspective, Annotated Notes for Presentation to Heartland Conference, Chicago, 21pp., http://www.climateaudit.info/pdf/mcintyre-heartland_2010.pdf
McIntyre, S., 2011. Keith’s Science Trick, Mike’s Nature Trick and Phil’s Combo. March, 29, 2011, https://climateaudit.org/2011/03/29/keiths-science-trick-mikes-nature-trick-and-phils-combo/, accessed and archived January 27, 2021.
McIntyre, S. and McKitrick, R., 2011. Discussion of: A statistical analysis of multiple temperature proxies: Are reconstructions of surface temperatures over the last 1000 years reliable? The Annals of Applied Statistics, Vol. 5, n°1, p. 56-60, DOI: 10.1214/10-AOAS398L
McIntyre, S., 2013. CRU Abandons Yamal Superstick. Climate Audit, June 28, 2013, https://climateaudit.org/2013/06/28/cruabandons-yamal-superstick/, accessed and archived November 28, 2020.
McKinley, G. A., Fay, A. R., Lovenduski, N. S., and Pilcher, D. J., 2017. Natural variability and anthropogenic trends in the ocean carbon sink. Annual Review of Marine Science, Vol. 9, p. 125–150, 10.1146/annurev-marine-010816-060529
McKitrick, R., 2010. A Critical Review of Global Surface Temperature Data Products, August 5, 2010, 75 pp., Available at SSRN: https://ssrn.com/abstract=1653928 or http://dx.doi.org/10.2139/ssrn.1653928
McKitrick, R., 2011. What is wrong with the IPCC? Proposals for a radical Reform. The Global Warming Policy Foundation, 45 pp., ISBN: 978-0-9566875-4-8, https://www.thegwpf.org/images/stories/gwpf-reports/mckitrick-ipcc_reforms.pdf, accessed and archived July 7, 2020.
McKitrick, R., and Christy, J., 2018. A Test of the Tropical 200‐ to 300‐hPa Warming Rate in Climate Models. Earth and Space Science, Vol. 5, Issue 9, p. 529-536, https://doi.org/10.1029/2018EA000401
McKitrick, R., and Christy, J., 2020. Pervasive Warming Bias in CMIP6 Tropospheric Layers. Earth and Space Science, Vol. 7, Issue 9, DOI: 10.1029/2020EA001281
McKitrick, R., 2022. Checking for model consistency in optimal fngerprinting: a comment. Climate Dynamics, Vol. 58, p. 405–411, https://doi.org/10.1007/s00382-021-05913-7
McLean, J. D., De Freitas, C. R., and Carter, R. M., 2009. Influence of the Southern Oscillation on tropospheric temperature. Journal of Geophysical Research Atmospheres, Vol. 114, Issue D14, D14104, 8 pp., DOI: 10.1029/2008JD011637
Mdidech, J., 2018. Du Moyen Atlas aux dunes de Merzouga, l’exceptionnel hiver sous le froid et la neige. Edition n°5209, https://leconomiste.com/article/1024085-du-moyen-atlas-aux-dunes-de-merzouga-l-exceptionnel-hiver-sous-le-froid-et-laneige, accessed and archived October 14, 2020.
Meadows, D. H., Meadows, D. L., Randers, J., and Behrens III, W. W., 1972. The Limits to Growth. Potomac Associates – Universe Books, ISBN 0-87663-165-0, 205 pp.
Mears, C., and Wentz, F. J., 2017. A Satellite-Derived Lower-Tropospheric Atmospheric Temperature Dataset Using an Optimized Adjustment for Diurnal Effects. Journal of Climate, Vol. 30, p. 7695-7718, http://doi.org/10.1175/JCLID-16-0768.s1
Meehl, G. A., Boer, G. J., Covey, C., Latif, M., and Stouffer, R. J., 1997. Intercomparison makes for a better climate model. Eos, Transactions American Geophysical Union, Vol. 78, Issue 41, p. 445–451, https://doi.org/10.1029/97EO00276
Meehl, G. A., Boer, G. J., Covey, C., Latif, M., and Stouffer, R. J., 2000. The Coupled Model Intercomparison Project (CMIP). Bulletin of the American Meteorological Society, Vol. 81, Issue 2, p. 313-318, DOI: 10.1175/1520-0477(2000)081<0313:TCMIPC>2.3.CO;2
Meehl, G. A., et al., 2004. Combinations of Natural and Anthropogenic Forcings in Twentieth-Century Climate. Journal of Climate, Vol. 17, p. 3721-3727, DOI: 10.1175/1520-0442(2004)017<3721:CONAAF>2.0.CO;2
Meehl, G. A., Covey, C., Taylor, K. E., et al., 2007. THE WCRP CMIP3 Multimodel Dataset: A New Era in Climate Change Research. Bulletin of the American Meteorological Society, Vol. 88, Issue 9, p. 1383–1394, https://doi.org/10.1175/BAMS-88-9-1383
Meehl, G. A., Teng, H., Arblaster, J. M., 2014. Climate model simulations of the observed early-2000s hiatus of global warming. Nature Climate Change, Vol 4, Issue 10, p. 898-902, DOI: 10.1038/nclimate2357
Mehrbach, C., et al., 1973. Measurement of the apparent dissociation constants of carbonic acid in seawater at atmospheric pressure. Limnology and Oceanography, Vol. 18, p. 897-907, https://aslopubs.onlinelibrary.wiley.com/doi/pdf/10.4319/lo.1973.18.6.0897
Mekhaldi, F., et al., 2015. Multiradionuclide evidence for the solar origin of the cosmic-ray events of AD 774/5 and 993/4. Nature Communications, Vol. 6, Article number: 8611, 8 pp., DOI: 10.1038/ncomms9611
Melillo, J. M., McGuire, A. D., Kicklighter, D. W. et al., 1993. Global climate-change and terrestrial net primary production. Nature, Vol. 363, Issue 6426, p. 234-240, https://doi.org/10.1038/363234a0
Mellin, C., et al. 2019. Spatial resilience of the Great Barrier Reef under cumulative disturbance impacts. Global Change Biology, p. 115, DOI: 10.1111/gcb.14625
Menne, M. J., Durre, I., Vose, R. S., Gleason, B., E., and Houston, T. M., 2012. An Overview of the Global Historical Climatology Network-Daily Database. Journal of Atmospheric and Oceanic Technology, Vol. 29, Issue 7, p. 897-910, DOI: 10.1175/JTECH-D11-00103.1
Mercado, L. M., et al., 2009. Impact of changes in diffuse radiation on the global land carbon sink. Nature, Vol. 458, Issue 7241, p. 1014-1017, DOI: 10.1038/nature07949
Messier, C., 1793. Observations sur les grandes chaleurs, etc. Mémoire de l'Institut de France, t. IV, p. 501 et suivantes.
Meyer, H. H. J., 1891. Across East African glaciers. An Account of the First Ascent of Kilimanjaro . Translated from the German by E.H.S. Calder. London and Liverpool: George Philip & Son, 404 pp.
Miallier, D., et al., 2010. The ultimate summit eruption of Puy de Dôme volcano (Chaine des Puys, French Massif Central) about 10,700 years ago. Comptes Rendus Geosciences, Vol. 342, p. 847-854, DOI: 10.1016/j.crte.2010.09.004
Miallier, D., Pilleyre, T., Sanzelle, S., Boivin, P., and Lanos, P., 2012. Revised chronology of the youngest volcanoes of the chaîne des puys (french Massif central). Quaternaire, Vol. 23, n°4, p. 282-290, DOI: 10.4000/quaternaire.6367
Miatello, A., 2012. The Famous Wood's Experiment Fully Explained. Principia Scientific, https://principia-scientific.org/the-famouswood-s-experiment-fully-explained/, accessed and archived June 13, 2020.
Michaels, P. J., 2011. Peer Review and “Pal Review” in Climate Science. June 16, 2011, https://www.cato.org/commentary/peerreview-pal-review-climate-science, accessed and archived June 26, 2022.
Michaels, P. J., and Wojick, D. E., 2016. Climate modeling dominates climate science. Cato Institute, Cato at Liberty, May 13, 2016, http://www.cato.org/blog/climate-modeling-dominates-climate-science, accessed and archived November 28, 2020.
Michalik, M.-L., 2022. Aurait-on pu mieux anticiper les violents orages en Corse ? Le Figaro, August 19, https://www.lefigaro.fr/meteo/aurait-on-pu-mieux-anticiper-les-violents-orages-en-corse-20220819, accessed and archived August 21, 2022.
Michtchenko, T. A., Ferraz-Mello, S., 2001. Modeling the 5 : 2 Mean-Motion Resonance in the Jupiter–Saturn Planetary System. Icarus, Vol. 149, Issue 2, p. 357-374, https://doi.org/10.1006/icar.2000.6539
Middleton, D., and May, A., 2021. Rebuttal to Geological Society of London Scientific Statement on Climate Change. Jan 13, https://wattsupwiththat.com/2021/01/13/may-middleton-rebuttal-to-geological-society-of-london-scientific-statement-onclimate-change/, accessed and archived August 10, 2022.
Miettinen, A., et al., 2015. Exceptional ocean surface conditions on the SE Greenland shelf during the Medieval Climate Anomaly. Paleoceanography and Paleoclimatology. Vol. 30, Issue 12, p. 1657–1674, DOI: 10.1002/2015PA002849
Migliorini, F., Michel, P., Morbidelli, A., Nesvorny, D., Zappala, V.,, 1998. Origin of Multikilometer Earth- and Mars-Crossing Asteroids: A Quantitative Simulation. Science, Vol. 281, Issue 5385, p. 2022-2024, DOI: 10.1126/science.281.5385.2022
Migoń, P., and Goudie, A. S., 2012. Pre-Quaternary geomorphological history and geoheritage of Britain Quaestiones Geographicae, Vol 31, n°1, p. 67-79, DOI: 10.2478/v10117-012-0004-x
Mikhail, S., and Sverjensky, D.A., 2014. Nitrogen speciation in upper mantle fluids and the origin of Earth’s nitrogen-rich atmosphere. Nature Geoscience, vol. 7, p. 816-819, DOI: 10.1038/NGEO2271
Mikkelsen, T. B., 2017. Ice Sheets & Ice Cores. Data Analysis & Stochastic Modeling. PhD Thesis, University of Copenhagen, Faculty of Science, https://www.nbi.ku.dk/english/theses/phd-theses/troels-boegeholm-mikkelsen/PhD-Thesis-Mikkelsen.pdf
Mikkelsen, T. B., Grinsted, A., and Ditlevsen, P., 2018. Influence of temperature fluctuations on equilibrium ice sheet volume. The Cryosphere, Vol. 12, p. 39–47, plus supplement, https://doi.org/10.5194/tc-12-39-2018
Milankovitch, M.M., 1941. Kanon der Erdbestrahlung und seine Anwendung auf das Eiszeitenproblem. Académie Royale Serbe, Editions Speciales, Tome CXXXIII, Section des Sciences Mathématiques et Naturelles, Tome 33, Belgrade, 633 pp, http://elibrary.matf.bg.ac.rs/bitstream/handle/123456789/702/MilutinMilankovicKanonDerErdbestrahlung.pdf
Milanovic, T., 2010. no-feedback climate sensitivity. http://www.pensee-unique.fr/milanovic.pdf, accessed and archived July 10, 2020.
Miles, M. W., Andresen, C. S., and Dylmer, D. V., 2020. Evidence for extreme export of Arctic sea ice leading the abrupt onset of the Little Ice Age. Science Advances, Vol. 6, no. 38, eaba4320, DOI: 10.1126/sciadv.aba4320
Millar, R. J., et al. 2017. Emission budgets and pathways consistent with limiting warming to 1.5° C. Nature Geoscience, Vol. 10, p. 741-747, https://doi.org/10.1038/ngeo3031, https://chaamjamal.files.wordpress.com/2019/08/2017carbon-budget-paperpdf.pdf
Millar, R. J., Nicholls, Z. R., Friedlingstein, P., and Allen, M. R., 2017. A modified impulse-response representation of the global nearsurface air temperature and atmospheric concentration response to carbon dioxide emissions. Atmospheric Chemistry and Physics, Vol. 17, p. 7213–7228, https://doi.org/10.5194/acp-17-7213-2017
Miller, G. H., et al., 2012. Abrupt onset of the Little Ice Age triggered by volcanism and sustained by sea-ice/ocean feedbacks. Geophysical Research Letters, Vol. 39, L02708, 5 pp., DOI: 10.1029/2011GL050168
Miller, K. G., et al., 2020. Cenozoic sea-level and cryospheric evolution from deep-sea geochemical and continental margin records. Science Advances, American Association for the Advancement of Science, Vol. 6, eaaz1346, 15 pp., https://www.science.org/doi/10.1126/sciadv.aaz1346
Millero, F. J., 2007. The Marine Inorganic Carbon Cycle. Chemical Reviews, Vol. 107, No. 2, p. 308–341, https://doi.org/10.1021/cr0503557
Milman, O., 2017. A third of the world now faces deadly heatwaves as result of climate change. Mon 19 Jun 2017 16.00, https://www.theguardian.com/environment/2017/jun/19/a-third-of-the-world-now-faces-deadly-heatwaves-as-result-ofclimate-change, accessed and archived July 11, 2020.
Milne, G. A., Long, A. J., and Bassett, S. E., 2005. Modelling Holocene relative sea-level observations from the Caribbean and South America. Quaternary Science Reviews, Vol. 24, Issues 10–11, p. 1183-1202, https://doi.org/10.1016/j.quascirev.2004.10.005
Mirandola A., and Lorenzini E. 2016. Energy, environment and climate: From the past to the future, International Journal of Heat and Technology, Vol. 34, p. 159-164, DOI: 10.18280/ijht.340201
Misios, S., et al., 2019. Slowdown of the Walker circulation at solar cycle maximum. Proc. of the Natl. Acad. of Sci. of the U.S.A., Vol. 116, n°15, p. 7186-7191, https://doi.org/10.1073/pnas.1815060116
Miskolczi, F. M., 1989. High Resolution Atmospheric Radiative Transfer Code (HARTCODE) Version No. 01, August, Instituto per lo Studio delle Metodologie, Geofisiche Ambientali, IMGA-CNR, DOI: 10.13140/RG.2.1.2319.6240
Miskolczi, F. M., and Mlynczak, M. G., 2004. The greenhouse effect and the spectral decomposition of the clear-sky terrestrial radiation. IDŐJÁRÁS, Quarterly Journal of the Hungarian Meteorological Service, Vol. 108, No. 4, p. 209-251.
Miskolczi, F. M., 2007. Greenhouse effect in semi-transparent planetary atmospheres. IDŐJÁRÁS, Quarterly Journal of the Hungarian Meteorological Service, Vol. 111, No. 1, January–March 2007, pp. 1–40, http://owww.met.hu/idojaras/IDOJARAS_vol111_No1_01.pdf
Miskolczi, F. M., 2010. The Stable Stationary Value of the Earth's Global Average Atmospheric Planck-Weighted Greenhouse-Gas Optical Thickness. Energy & Environment, Vol. 21, n°4, p. 243-262, DOI: 10.1260/0958-305X.21.4.243
Miskolczi, F. M., 2014. The Greenhouse Effect and the Infrared Radiative Structure of the Earth's Atmosphere. Development in Earth Science, Vol. 2, p. 31-52, http://seipub.org/des/Download.aspx?ID=21810
Mistry et al., 2022. Comparison of weather station and climate reanalysis data for modelling temperature-related mortality. Scientific Reports, Vol. 12, Article: 5178, 14 pp., https://doi.org/10.1038/s41598-022-09049-4
Mitchell, W., et al., 2012. South Pacific Sea Level and Climate Monitoring Project: Sea Level Data Summary Report, July 2010 to June 2011. National Tidal Centre Australian Bureau of Meteorology, http://www.bom.gov.au/pacificsealevel/index.shtml, http://www.bom.gov.au/ntc/IDO60102/IDO60102.2011_1.pdf, accessed and archived November 28, 2020.
Miyake, F., et al., 2017. Large 14C excursion in 5480 BC indicates an abnormal sun in the mid-Holocene. Proc. of the Natl. Acad. of Sci. of the U.S.A., Earth, Atmospheric, and Planetary Sciences, Vol. 114, n°5, p. 881-884, https://doi.org/10.1073/pnas.1613144114
Miyake, F., et al., 2021. A Single-Year Cosmic Ray Event at 5410 BCE Registered in 14C of Tree Rings. Geophysical Research Letters, Vol. 48, Issue 11, e2021GL093419, https://doi.org/10.1029/2021GL093419
Moberg, A., Sonechkin, D. M., Holmgren, K., Datsenko, N. M., and Karlén, W., 2005. Highly variable Northern Hemisphere temperatures reconstructed from low- and high-resolution proxy data. Nature, Vol. 433, Issue 7026, p. 613-617, DOI: 10.1038/nature03265
Moiseev, V. G., Khartanovich, V. I., and Zubova, A., 2017. The Upper Paleolithic man from Markina Gora: Morphology vs. genetics? Herald of the Russian Academy of Sciences, Vol. 87, n°2, p. 165-171, DOI: 10.1134/S1019331617010099
Molnár, P. K., et al., 2020. Fasting season length sets temporal limits for global polar bear persistence. Nature Climate Change, Vol.10, p. 732–738, https://doi.org/10.1038/s41558-020-0818-9
Monahan, W. G., 1993. Year of Sorrows: The great famine of 1709 in Lyon. Ohio State University Press, Columbus, ISBN 978-0-81420608-9, 246 pp.
Monceyron, J.-L., and Poyet, P., 1997. Méthodes et outils d'intégration des données techniques: exemple d'applications au contrôle du règlement de construction. Cahiers du CSTB, Livraison 379, Cahier 2951, 93 pp, pdf file is available at https://www.academia.edu/30162456 and https://www.researchgate.net/
Monckton of Brenchley, C., 2007. 35 Inconvenient Truths, The errors in Al Gore's movie. SPPI, Science & Public Policy Institute, 21pp., http://ben-israel.rutgers.edu/711/monckton-response-to-gore-errors.pdf, accessed and archived July 5, 2020.
Monckton of Brenchley, C. W., 2013. Written evidence submitted (IPCC0005). 12 pp., https://www.parliament.uk/documents/commons-committees/energy-and-climate-change/Christopher-walter-viscountmonckton-of-brenchley-(IPC0005).pdf, accessed and archived July 5, 2020.
Monckton of Brenchley, C. W., Soon W. W.-H., Legates, D. R., and Briggs, W. M., 2015a. Why models run hot: results from an irreducibly simple model. Science Bulletin, Vol. 60, Issue 1, p. 122–135, DOI:10.1007/s11434-014-0699-2
Monckton of Brenchley, C., Soon, W W.-H., Legates, D. R., and Briggs, W. M., 2015b. Keeping it simple: the value of an irreducibly simple climate model. Science Bulletin, Vol. 60, p. 1378–1390, DOI 10.1007/s11434-015-0856-2
Monckton of Brenchley, C., 2020a. Naomi Seibt, the anti-Greta, needs your financial support now. Clintel.org, May 21, 2020, https://clintel.org/naomi-seibt-the-anti-greta-needs-your-financial-support-now/, accessed and archived November 28, 2020.
Monckton of Brenchley, C., 2020b. German officials threaten Naomi Seibt with prison for ‘denialism’. Clintel.org, May 22, 2020,https://clintel.org/german-officials-threaten-naomi-seibt-with-prison-for-denialism/, accessed and archived November 28, 2020.
Monckton of Brenchley, C., 2020c. Professor Nils-Axel Mörner, 1938-2020. WUWT, October 19, 2020, https://wattsupwiththat.com/2020/10/19/professor-nils-axel-morner-1938-2020/, accessed and archived October 21, 2020.
Monckton of Brenchley, 2021. HadCRUT5 shows 14% more global warming since 1850 than HadCRUT4. https://wattsupwiththat.com/2021/02/21/hadcrut5-shows-14-more-global-warming-since-1850-than-hadcrut4/, accessed and archived Auguest 8, 2022.
Monnett, C., and Gleason, J. S., 2006. Observations of mortality associated with extended open-water swimming by polar bears in the Alaskan Beaufort Sea. Polar Biology, Vol. 29, Issue 8, p. 681-687, DOI: 10.1007/s00300-005-0105-2
Monnin, E., et al., 2001. Atmospheric CO2 concentrations over the last glacial termination. Science, Vol. 291, Issue 5501, p. 112–114, DOI: 10.1126/science.291.5501.112
Montford, A. W., 2010. The Hockey Stick Illusion. Stacey International, ISBN 978-1-906768-35-5, 482 pp
Montaggioni, L., and Braithwaite, C. J. R., 2009. Quaternary Coral Reef Systems: History, Development Processes and Controlling Factors. Developments in Marine Geology, Vol 5., Elsevier, H. Chamley (Ed.), ISBN 0080932762, 9780080932767, 550 pp.
Montague, 2018. Dr Fred Singer's controversial use of an aging academic's work on climate science. Ecologist, September 4, 2018, https://theecologist.org/2018/sep/04/dr-fred-singers-controversial-use-aging-academics-work-climate-science, accessed and archived November 28, 2020.
Moons, M., Morbidelli, A., Migliorini, F., 1998. Dynamical Structure of the 2/1 Commensurability with Jupiter and the Origin of the Resonant Asteroids. Icarus, Vol. 135, Issue 2, p. 458-468, https://doi.org/10.1006/icar.1998.5963
Moore, P. A., 2010. Confessions of a Greenpeace Dropout: The Making of a Sensible Environmentalist. Revised 2013, Published by Beatty Street Publishing Inc., ISBN-13 : 978-0986480829, 408 pp.
Moore, P., 2014. Natural Resource Adaptation: Protecting ecosystems and economies. Statement Before the Senate Environment and Public Works Committee, Subcommittee on Oversight, February 25, 2014, 3 pp. + Annexes, i.e. Chapter 21 of Moore (2010), in: https://www.govinfo.gov/content/pkg/CHRG-113shrg97585/pdf/CHRG-113shrg97585.pdf, accessed and archived July 30, 2020.
Moore, P., 2015. Should We Celebrate Carbon Dioxide? 2015 Annual Global Warming Policy Foundation Lecture. Institution of Mechanical Engineers, London, October 15, 2015, https://www.thegwpf.org/patrick-moore-should-we-celebrate-carbondioxide/, accessed and archived November 28, 2020.
Moore, P., 2016. The Positive Impact of Human CO2 on the Survival of Life on Earth. Winnipeg, MB: Frontier Centre for Public Policy, 24 pp., https://fcpp.org/wp-content/uploads/2016/06/Moore-Positive-Impact-of-Human-CO2-Emissions.pdf, accessed and archived August 27, 2020.
Mora, C., 2017. Global risk of deadly heat. Nature Climate Change, Vol. 7, 8 pp., DOI: 10.1038/nclimate3322.
Moranne, J.M., 2020. Climate Physics, Forget the «Greenhouse Effect» and return to the Fundamentals. 72 p https://laphysiqueduclimat.fr/wp-content/uploads/2020/01/Physique-du-climat_D_en.pdf, accessed and archived April 28, 2020.
Morano, M., 2008a. Part Two: Don’t Panic Over Predictions of Climate Doom- Get the Facts on James Hansen. U.S. Senate Committee on Environment and Public Works. June 23, 2008, https://www.epw.senate.gov/public/index.cfm/press-releasesall?ID=b6aebcd0-802a-23ad-4790-b64d9e2d684e, accessed and archived November 30, 2020.
Morano, M., 2008b. Climate Skeptics Reveal ‘Horror Stories’ of Scientific Suppression. NYC Climate Conference Further Debunks ‘Consensus’ Claims. March 6, 2008, https://www.epw.senate.gov/public/index.cfm/press-releases-all?ID=865dbe39-802a23ad-4949-ee9098538277, accessed and archived November 30, 2020.
Morano, M., 2010. More Than 1000 International Scientists Dissent Over Man-Made Global Warming Claims. Climate Depot, CFACT, https://www.cfact.org/pdf/2010_Senate_Minority_Report.pdf, accessed and archived September 4, 2020.
Morano, M., 2018a. The Politically Incorrect Guide to Climate Change, Regnery Publishing, ISBN-13: 978-1621576761, 200 pp. Morano, 2018b. Al Gore under fire for claiming icy storm is ‘exactly what we should expect from climate crisis’. January 8, 2018, https://www.climatedepot.com/2018/01/08/al-gore-under-fire-for-claiming-icy-storm-is-exactly-what-we-should-expectfrom-climate-crisis/, accessed and archived November 30, 2020.
Morbidelli, A., Bottke Jr., W. F., Froeschlé, Ch., and Michel, P., 2002. Origin and Evolution of Near-Earth Objects. Asteroids III, W. F. Bottke Jr., A. Cellino, P. Paolicchi, and R. P. Binzel (eds), University of Arizona Press, Tucson, p.409-422.
Morbidelli, A., 2011. Modern Celestial Mechanics - Aspects of Solar System Dynamics., 355 pp., https://wwwn.oca.eu/morby/celmech.pdf, accessed and archived August 9, 2022.
Morel, P., and Talagrand, O., 1974. Dynamic approach to meteorological data assimilation. Tellus, Vol. 26, Issue 3, p. 334-344, https://doi.org/10.1111/j.2153-3490.1974.tb01611.x
Morel, P., 2009. Réchauffement planétaire et science du climat», conférence au Bureau des Longitudes, 7 octobre 2009, in French, https://www.canalacademie.com/emissions/col584.mp3, accessed November 30, 2020.
Morel, P., 2013. Regard historique sur la recherche climatique, entre observations et modèles, Entretien par Le Treut, H. and Charles, L.. Pollution Atmosphérique - Numéro Spécial - Juin 2013, p. 9-22, accessed and archived June 4, 2020.
Moreno-Chamarro, E., Zanchettin, D., Lohmann, K., Luterbacher, J., Jungclaus, J. H., 2017. Winter amplification of the European Little Ice Age cooling by the subpolar gyre. Scientific Reports, 7:9981, 8 pp., DOI: 10.1038/s41598-017-07969-0
Morhange, C., Laborel, J., and Hesnard, A., 2001. Changes of relative sea level during the past 5000 years in the ancient harbor of Marseilles, Southern France. Palaeogeography, Palaeoclimatology, Palaeoecology, Vol. 166, p. 319-329, https://doi.org/10.1016/S0031-0182(00)00215-7
Morice, C. P., Kennedy, J. J., Rayner, N., and Jones, P. D., 2012. Quantifying uncertainties in global and regional temperature change using an ensemble of observational estimates: the HadCRUT4 data set. Journal of Geophysical Research, Vol. 117, 22 pp., D08101, DOI: 10.1029/2011JD017187
Mörner, N.-A., 2010-2011. The Great Sea-Level Humbug; There Is No Alarming Sea Level Rise! 21st Century Science & Technology, p.12-22, https://www.climategate.nl/wp-content/uploads/2011/05/morner.pdf
Mörner, N.-A., 2012. Sea Level is Not Rising. SPPI Reprint Series, Science and Public Policy Institute, 27 pp., http://scienceandpublicpolicy.org/images/stories/papers/reprint/sea_level_not_rising.pdf, accessed and archived October 21, 2020.
Mörner, N.-A., et al. 2013. Pattern in solar variability, their planetary origin and terrestrial Impact A Special Issue of Pattern Recognition in Physics, Copernicus Publications, 12 papers, DOI: 10.5194/prp-1-203-2013 https://www.researchgate.net/publication/337007364_Solar_Variability_Planetary_Origin_and_Terrestrial_Impact__A_Special_Issue_of_Pattern_Recognition_in_Physics_2013/link/5dbff05a299bf1a47b11d8e5/download
Mörner, N.-A., 2017. Sea Level Manipulation. International Journal of Engineering Science Invention, Vol. 6, Issue 8, p. 48-51, ISSN (Online): 2319-6734, ISSN (Print): 2319-6726, DOI: 10.13140/RGI.2.2.28591.12963
Mörner, N.-A., et al., 2018. Basic Science of a Changing Climate: How processes in the Sun, Atmosphere and Ocean affect Weather and Climate. Porto Climate Conference 2018, September 7 and 8, at Porto University, 94 pp., https://www.portoconference2018.org/uploads/1/1/7/3/117342822/porto_conference_volume_2018_revised.pdf, accessed and archived August 8, 2020.
Mörner, N.-A., Solheim, J.-E., Humlum, O. and Falk-Petersen, S., 2020. Changes in Barents Sea ice Edge Positions in the Last 440 years: A Review of Possible Driving Forces. International Journal of Astronomy and Astrophysics, Vol. 10, p. 97-164, https://doi.org/10.4236/ijaa.2020.102008
Mote, P., and Kaser, G., 2007. The Shrinking Glaciers of Kilimanjaro: Can Global Warming Be Blamed? American Scientist, Vol. 95, n°4, p. 318-325, DOI: 10.1511/2007.66.318
Mouchon, F., 2019., Réchauffement climatique : pourquoi il faut craindre les pires scénarios. September 21, 2019, https://www.leparisien.fr/environnement/rechauffement-climatique-pourquoi-il-faut-craindre-les-pires-scenarios-21-092019-8157093.php, accessed and archived November 30, 2020.
Mouginot, J., et al., 2019. Forty-six years of Greenland Ice Sheet mass balance from 1972 to 2018. Proc. of the Natl. Acad. of Sci. of the U.S.A., Vol. 116, n°19, p. 9239-9244, https://doi.org/10.1073/pnas.1904242116
Mudelsee, M., 2001. The phase relations among atmospheric CO2 content, temperature and global ice volume over the past 420 ka. Quaternary Science Reviews, Vol. 20, Issue 4, p. 583–589, https://doi.org/10.1016/S0277-3791(00)00167-0
Muench, S., and Lohmann, U., 2020. Developing a Cloud Scheme with Prognostic Cloud Fraction and Two Moment Microphysics for ECHAM‐HAM. Journal of Advances in Modeling Earth Systems, Vol. 12, Issue 8, e2019MS001824, 37 pp., https://doi.org/10.1029/2019MS001824
Mulcahy, S., 2021. Many Texans have died because of the winter storm. February 19, 2021, https://www.texastribune.org/2021/02/19/texas-power-outage-winter-storm-deaths/, accessed and archived February 23, 2021.
Mulholland, P., and Wilde, S. P. R., 2019. An Analysis of the Earth's Energy Budget. 14 pp., DOI: 10.13140/RG.2.2.12021.93927
Mullan, A. B., Stuart, S. J., Hadfield, M. G., and Smith, M. J., 2010. Report on the Review of NIWA’s ‘Seven-Station’ Temperature Series, NIWA Information Series No. 78, 175 p., ISSN 1174-264X, https://niwa.co.nz/sites/niwa.co.nz/files/import/attachments/Report-on-the-Review-of-NIWAas-Seven-StationTemperature-Series_v3.pdf, accessed and archived November 11, 2020.
Mullan, B., Salinger, M. J. Salinger, Renwick, J. A., and Wratt, D., 2018. Comment on “A Reanalysis of Long-Term Surface Air Temperature Trends in New Zealand”. Environmental Modeling and Assessment, Vol. 23, p. 249-262, DOI: 10.1007/s10666018-9606-6
Muller, R. A., 2004. Global Warming Bombshell: A prime piece of evidence linking human activity to climate change turns out to be an artifact of poor mathematics. 3 pp., accessed and archived November 30, 2020. http://www.scmsa.eu/archives/ART_2004_Muller_bombshell.pdf
Müller, P., and von Storch, H., 2008. Computer Models. In: Computer Modelling in Atmospheric and Oceanic Sciences: Building Knowledge, Müller, P. K., Ed, Springer-Verlag, ISBN 978-3-540-20353-7, 304 pp., DOI 10.1007/978-3-662-06381-1
Mulvaney, R., Wolff, E. W., and Oates, K., 1988. Sulphuric acid at grain goundaries in Antarctic ice. Nature, Vol. 331, p.247-249. Muñoz, I., Milà i Canals, L., Fernández-Alba, A. R., 2010. Life cycle assessment of the average Spanish diet including human excretion. The International Journal of Life Cycle Assessment, Vol. 15, Issue 8, p. 794-805, DOI: 10.1007/s11367-010-0188-z
Munshi, J., 2015. Responsiveness of Atmospheric CO2 to Anthropogenic Emissions : A Note. SSRN Electronic Journal, DOI: 10.2139/ssrn.2642639
Munshi, J., 2016a. Spurious Correlations in Time Series Data: A Note. SSRN Electronic Journal, 10 pp., DOI: 10.2139/ssrn.2827927, https://www.researchgate.net/publication/306376553_Spurious_Correlations_in_Time_Series_Data_A_Note
Munshi, J., 2016b. Responsiveness of Atmospheric CO2 to Fossil Fuel Emissions: Part 2. SSRN Electronic Journal, DOI: 10.2139/ssrn.2862438, https://www.researchgate.net/publication/309585704_Responsiveness_of_Atmospheric_CO2_to_Fossil_Fuel_Emissions_Pa rt_2
Muscheler, R., et al., 2007. Solar activity during the last 1000 yr inferred from radionuclide records Quaternary Science Reviews, Vol. 26, p. 82–97, DOI: 10.1016/j.quascirev.2006.07.012
Muscheler, R., et al., 2020. Testing and improving the IntCal20 calibration curve with independent records. Radiocarbon, Vol. 62, Issue 4, p. 1079-1094, DOI: 10.1017/RDC.2020.54
Myhre, G., Highwood, E. J., Shine, K. P., and Stordal, F., 1998. New estimates of radiative forcing due to well mixed greenhouse gases. Geophysical Research Letters, Vol. 25, n°14, p. 2715-2718, https://doi.org/10.1029/98GL01908
Myhre, G., et al., 2013: Anthropogenic and Natural Radiative Forcing. Chapter 8, In: Climate Change 2013: The Physical Science Basis. Contribution of Working Group I to the Fifth Assessment Report of the Intergovernmental Panel on Climate Change. Cambridge University Press, p. 569-740.
Mysak, L. A., 2010. Glacial inceptions: Past and future. Atmosphere-Ocean, Vol. 46, Issue 3, p. 317-341, DOI:10.3137/ao.460303
Nafeez, A., 2013. US Navy predicts summer ice free Arctic by 2016. The Guardian, Mon 9 Dec 2013, https://www.theguardian.com/environment/earth-insight/2013/dec/09/us-navy-arctic-sea-ice-2016-melt, accessed and archived June 27, 2022.
Nahle, N., 2007. Cycles of Global Climate Change. Biology Cabinet Journal Online. Article no. 295. http://www.biocab.org/Carbon_Dioxide_Geological_Timescale.html , accessed and archived August 27, 2020.
Nahle, N. S., 2011. Determination of Mean Free Path of Quantum/Waves and Total Emissivity of the Carbon Dioxide Considering the Molecular Cross Section. April 10, 2011. Biology Cabinet Online, Academic Resources. Monterrey, N. L., 9 pp.,
http://www.biocab.org/Reviewed_Total_Emissivity_of_the_Carbon_Dioxide_and_Mean_Free_Path.pdf, accessed and archived December 12, 2020.
Nairn, I. A., Shane, P. R., Cole, J. W., Leonard, G. J., Self, S., & Pearson, N., 2004. Rhyolite magma processes of the ~AD 1315 Kaharoa eruption episode, Tarawera volcano, New Zealand. Journal of Volcanology and Geothermal Research, Vol. 131, Issue 3-4, p. 265-294, DOI: 10.1016/S0377-0273(03)00381-0
Naish, T., and Kamp, P. J. J., 1995. Pliocene-Pleistocene marine cyclothems, Wanganui Basin, New Zealand: a lithostratigraphic framework. New Zealand Journal of Geology and Geophysics, Vol. 38, p. 223-243, https://hdl.handle.net/10289/4700
Nakamura, M., P. H. Stone, and J. Marotzke, 1994. Destabilization of the thermohaline circulation by atmospheric eddy transports. Journal of Climate Climate, Vol. 7, Issue 12, p. 1870–1882, DOI: 10.1175/1520-0442(1994)007<1870:DOTTCB>2.0.CO;2
Nakamura, M., 1994. Characteristics of potential vorticity mixing by breaking Rossby waves in the vicinity of a jet. Thesis (Doctor of Science in Meteorology), Massachusetts Institute of Technology, Dept. of Earth, Atmospheric, and Planetary Sciences, Cambridge, Massachusetts, U.S.A., 248 pp., https://dspace.mit.edu/handle/1721.1/11730
Nakamura, M., Enomoto, T., and Yamane, S., 2005. A simulation study of the 2003 heatwave in Europe. Journal of the Earth Simulator, Vol. 2, p. 55–69.
Nakamura, M., 2013. Greenland Sea Surface Temperature Change and Accompanying Changes in the Northern Hemispheric Climate. Journal of Climate, Vol. 26, Issue 21, p. 8576-8596, https://doi.org/10.1175/JCLI-D-12-00435.1
Nakamura, M., 2018. Confessions of a climate scientist The global warming hypothesis is an unproven hypothesis. in Japanese, 126 pp., Kindle, Edition, https://www.amazon.com/kikoukagakushanokokuhaku-chikyuuonndannkahamikennshounokasetsuJapanese-Nakamura-Mototaka-ebook/dp/B07FKHF7T2 with excerpts translated: https://c-c-netzwerk.ch/images/ccnblog_articles/717/Confessions-Nakamura.pdf or http://www.lavoisier.com.au/articles/climate-policy/science-andpolicy/Nakamura-september.pdf
Nakićenović, N., et al., 2000. Special Report on Emissions Scenarios (SRES). A Special Report of Working Group III of the Intergovernmental Panel on Climate Change, IPCC, Cambridge University Press, 608 pp., https://www.ipcc.ch/site/assets/uploads/2018/03/emissions_scenarios-1.pdf
NASEM, 2019. National Academies of Sciences, Engineering, and Medicine 2019. Finding Hazardous Asteroids Using Infrared and Visible Wavelength Telescopes. Washington, DC: The National Academies Press, ISBN 978-0-309-49398-7, 70 pp., https://doi.org/10.17226/25476
Nauer, P. A., Hutley, L. B., and Arndt, S. K., 2018. Termite mounds mitigate half of termite methane emissions. Proc. of the Natl. Acad. of Sci. of the U.S.A., Vol. 115, Issue 52, p. 13306-13311, https://doi.org/10.1073/pnas.1809790115
NBC, 2017. The Author’s Manual; A manual released by the National Book Council with useful information for authors on issues of copyright, publishing and the market. National Book Council, Central Public Library, Malta, EU, ISBN 978-99957-916-2-9, 26pp., https://ktieb.org.mt/wp-content/uploads/2017/12/KNK-authors-manual-EN-2017_23-dec-final.pdf, accessed and archived November 30, 2020.
Neale, R. B., et al., 2012. Description of the NCAR Community Atmosphere Model (CAM 5.0). NCAR Technical Note, NCAR/TN486+STR, 274 pp.
Neff, U., Burns, S.J., Mangini, A., Mudelsee, M., Fleitmann, D. and Matter, A.: 2001, Strong coherence between solar variability and the monsoon in Oman between 9 and 6 kyr ago. Nature, Vol. 411, Issue 6835, p. 290-293, DOI: 10.1038/35077048
Neftel, A., et al., 1982. Ice core sample measurements give atmospheric CO 2 content during the past 40,000 years. Nature, Vol. 295, Issue 5846, p. 220-223, DOI: 10.1038/295220a0
Neftel, A., Oeshger, H., Staffelbach, T., and Stauffer, B., 1988. CO2 record in the Byrd ice core 50,000 - 5,000 years BP. Nature, Vol. 331, Issue 6157, p. 609-611, DOI: 10.1038/331609a0
Nerini, F. F., Fawcett, T., Parag, Y., Ekins, P., 2021. Personal carbon allowances revisited. Nature Sustainability, Vol. 4, p. 1025–1031, https://doi.org/10.1038/s41893-021-00756-w
Néron de Surgy, O., and Laskar, J., 1997. On the long term evolution of the spin of the Earth. Astronomy and Astrophysics, Vol. 318, p. 975-989
Newman, M., 2012a. Against the wind. The Spectator, January 21, 2012, accessed and archived November 30, 2020. https://web.archive.org/web/20120430193820/http://www.spectator.co.uk/australia/7589188/against-the-wind.thtml Newman, M., 2012b. Losing their religion as evidence cools off. The Weekend Australian, November 5, 2020, https://archive.fo/W7GmS#selection-1715.0-1715.43, accessed and archived November 30, 2020. Nichols, H., 1972. Book Reviews "Times of Feast, Times of Famine. A History of Climate since the Year 1000". Emmanuel le Roy Ladurie. Translated from the French by Barbara Bray. Doubleday, Garden City, N.Y., 1971. xxiv, 426 pp. + plates. Science, Vol.177, Issue 4053, pp. 982-983 DOI: 10.1126/science.177.4053.982-a Nicholson, C., et al., 2006. Santa Barbara Basin Study Extends Global Climate Record. Eos Transactions, American Geophysical Union, vol. 87, n°21, p. 205-212, https://doi.org/10.1029/2006EO210001
Nicolussi, K., Kaufmann, M., Patzelt, G., van der Plicht, J., and Turner, A., 2005. Holocene tree-line variability in the Kauner Valley, Central Eastern Alps, indicated by dendrochronological analysis of living trees and subfossil logs. Vegetation History and Archaeobotany, Vol. 14, p. 221–234, DOI: 10.1007/s00334-005-0013-y
Nienhuis, J. H., Törnqvist, T. E., Jankowski, K. L., Fernandes, A. J., Keogh, M. E., 2017. A New Subsidence Map for Coastal Louisiana. GSA Today, Vol. 27, DOI: 10.1130/GSATG337GW.1
Nikolov, N., and Zeller, K., 2016. Erratum to: On the average temperature of airless spherical bodies and the magnitude of Earth’s atmospheric thermal effect. SpringerPlus, Vol. 5, Article 2085, Erratum to: SpringerPlus (2014) 3:723 DOI 10.1186/2193-18013-723
Nikolov, N., and Zeller, K., 2017. New Insights on the Physical Nature of the Atmospheric Greenhouse Effect Deduced from an Empirical Planetary Temperature Model. Environment Pollution and Climate Change, Vol. 1, Issue 2, 112, 22 pp., doi:10.4172/2573-458X.1000112
NOAA, 2013. Monthly mean CO2 concentration at Mauna Loa, HI. National Oceanographic and Atmospheric Administration, ftp://ftp.cmdl.noaa.gov/ccg/co2/trends/co2_mm_mlo.txt, accessed and archived November 30, 2020. nos, 2016. Director of the energy institute made a lot of money from wind turbines. January 23, 2016. https://nos.nl/artikel/2082194-directeur-energie-instituut-verdiende-flink-aan-windmolens.html, accessed and archived on February 12, 2021.
Nova, J., 2009. The Skeptics Handbook. http://joannenova.com.au/global-warming-2/, accessed and archived August 10, 2020. Nova, J., 2011. You don't need a PhD to spot outrageously bad science. SPPI Original Paper, June 29, 2011, 21 pp., http://scienceandpublicpolicy.org/images/stories/papers/originals/you_dont_need_to_be_a_scientist.pdf, accessed and archived on August 14, 2020.
Nova, J., 2012. The Skeptics Handbook II. 20 pp., http://joannenova.com.au/global-warming-2/, accessed and archived August 10, 2020.
Nova, J., 2015. Spot the Vested Interest: The $1.5 Trillion Climate Change Industry. http://joannenova.com.au/2015/07/spot-thevested-interest-the-1-5-trillion-climate-change-industry/, accessed and archived November 5, 2020.
Nowaczyk, N. R., Arz, H. W., Frank, U., Kind, J. , and Plessen, B., 2012. Dynamics of the Laschamp geomagnetic excursion from Black Sea sediments. Earth and Planetary Science Letters, Vol. 351–352, p. 54–69, http://dx.doi.org/10.1016/j.epsl.2012.06.050
NRC, 2011. National Research Council 2011. Understanding Earth's Deep Past: Lessons for Our Climate Future. Washington, DC: The National Academies Press, 208 pp., https://doi.org/10.17226/13111
NSTC, 2018. National Near Earth Object Preparedness Strategy and- Action Plan. A Report by the Interagency Working Group for Detecting and Mitigating the Impact of Earth-Bound Near-Earth Objects of the NATIONAL SCIENCE & TECHNOLOGY COUNCIL, 18 pp., https://www.whitehouse.gov/wp-content/uploads/2018/06/National-Near-Earth-Object-Preparedness-Strategy-andAction-Plan-23-pages-1MB.pdf, accessed and archived September 17, 2020.
Nuccitelli, D., 2012. Attacks on climate science by former NASA staff shouldn't be taken seriously. April 12, 2012, https://www.theguardian.com/environment/2012/apr/12/attacks-climate-science-nasa-staff, accessed and archived November 30, 2020.
Nussbaumer, S. U., Zumbühl, H. J., and Steiner, D., 2007. Fluctuations of the ‘Mer de Glace’ AD 1500-2000 an interdisciplinary approach using new historical data and neural network simulations. Zeitschrift für Gletscherkunde und Glazialgeologie, 40, Universitätsverlag Wagner, 183 pp.
Nussbaumer, S. U., et al., 2011. Alpine climate during the Holocene: a comparison between records of glaciers, lake sediments and solar activity. Journal of Quaternary Science, Vol. 26, n°7, p. 703-713, DOI: 10.1002/jqs.1495
O'Brien, S. R., et al., 1995. Complexity of Holocene Climate as Reconstructed from a Greenland Ice Core. Science, Vol. 270, Issue, 5244, p. 1962-1964, DOI: 10.1126/science.270.5244.1962
O'Brien, C. L., et al., 2020. The enigma of Oligocene climate and global surface temperature evolution. Proc. of the Natl. Acad. of Sci. of the U.S.A., Vol. 117, Issue 41, p. 25302-25309, https://doi.org/10.1073/pnas.2003914117
Obryk, M. K., et al., 2020. Climate From the McMurdo Dry Valleys, Antarctica, 1986–2017: Surface Air Temperature Trends and Redefined Summer Season. Journal of Geophysical Research Atmospheres, Vol. 125, Issue 13, e2019JD032180, https://doi.org/10.1029/2019JD032180
O'Connell, E., et al., 2015. The scientific legacy of Harold Edwin Hurst (1880–1978). Hydrological Sciences Journal/Journal des Sciences Hydrologiques, Vol. 61, issue 9, DOI: 10.1080/02626667.2015.1125998
OECD-G20, 2015. Climate Fund Inventory. Organisation for Economic Co-operation and Development (the OECD) for the G20 Climate Finance Study Group, 10 pp., https://www.oecd.org/environment/cc/Climate-Fund-Inventory-Background-report-OECD.pdf, accessed and archived November 5, 2020.
Oeschger, H. B., Stauffer, B., Finkel, R., Langway Jr., C. C., 1985. Variations of the CO2 Concentration of Occluded Air and of Anions and Dust in Polar Ice Cores. In: Geophysical Monograph Series, E.T. Sundquist W.S. Broecker (Eds), The Carbon Cycle and Atmospheric CO2: Natural Variations Archean to Present, Volume 32, p. 132-132, https://doi.org/10.1029/GM032p0132
Oeschger, H., 1995. Z. JAWOROWSKI: Ancient Atmosphere - Validity of Ice Records ESPR 1 (3) 161-171 (1994). Environmental Science and Pollution Research, Vol. 2 (1) pp. 60-61, (retrieved thanks to a web archive 29th July, 2020), https://web.archive.org/web/20070927024724/http://www.scientificjournals.com/sj/espr/Pdf/aId/7394
Ogurtsov, M. G., Nagovitsyn, Y. A., Kocharov, G. E., and Jungner, H., 2002. Long-period cycles of the Sun’s activity recorded in direct solar data and proxies. Solar Physics, Vol. 211, p. 371–394, https://doi.org/10.1023/A:1022411209257
Ohfuchi, W., et al., 2004. 10-km Mesh Meso-scale Resolving Simulations of the Global Atmosphere on the Earth Simulator –Preliminary Outcomes of AFES (AGCM for the Earth Simulator). Journal of the Earth Simulator, Vol. 1, p. 8–34, https://www.jamstec.go.jp/ceist/j/publication/journal/jes_vol.1/pdf/JES1-3.1-Ohfuchi.pdf
Oklahoma Climatological Survey, 2005. Earth's Energy Budget. http://okfirst.mesonet.org/train/meteorology/EnergyBudget.html, accessed and archived March 3, 2021.
Ollila, A., 2017a. Semi Empirical Model of Global Warming Including Cosmic Forces, Greenhouse Gases, and Volcanic Eruptions. Physical Science International Journal, Vol. 15, Issue 2, p. 1-14, DOI: 10.9734/PSIJ/2017/34187
Ollila, A., 2017b. Warming Effect Reanalysis of Greenhouse Gases and Clouds. Physical Science International Journal , Vol. 13, Issue 2, p. 1-13, Article no.PSIJ.30781, DOI: 10.9734/PSIJ/2017/30781
Ollila, A., 2019. Challenging the Greenhouse Effect Specification and the Climate Sensitivity of the IPCC. Physical Science International Journal, Vol. 22, n°2, p. 1-19, https://doi.org/10.9734/psij/2019/v22i230127
Ollila, A., 2020. The Pause End and Major Temperature Impacts during Super El Niños are Due to Shortwave Radiation Anomalies. Physical Science International Journal, Vol. 24, n°, p. 1-20, Article no.PSIJ.55149, ISSN: 2348-0130, DOI: 10.9734/PSIJ/2020/v24i230174
Olsen, P. E., and Whiteside, J. H, 2008. Pre-Quaternary Milankovitch Cycles and Climate Variability. In: Encyclopedia of Paleoclimatology and Ancient Environments, Gornitz, F. (ed.), ISBN: 978-1-4020-4551-6, p. 826-835.
O'Neill, B., 2020. Covid-19: a glimpse of the dystopia greens want us to live in. https://www.spiked-online.com/2020/03/25/covid19-a-glimpse-of-the-dystopia-greens-want-us-to-live-in/, accessed and archived July 11, 2020.
O'Neill, B., 2021. Climate Derangement Syndrome. spiked-online.com, November 5, 2021, https://www.spikedonline.com/2021/11/05/climate-derangement-syndrome/, accessed and archived September 5, 2022.
O'Neill, B., 2022. A people’s revolt against eco-tyranny- From the Netherlands to Sri Lanka, people have had enough of the elite’s green hysteria. https://www.spiked-online.com/2022/07/06/a-peoples-revolt-against-eco-tyranny/, accessed and archived July 8, 2022.
Onians, C., 2000. Snowfalls are now just a thing of the past. The independant, Monday 15 September 2014, originally at http://www.independent.co.uk/environment/snowfalls-are-now-just-a-thing-of-the-past-724017.html but canceled since! archived at https://wattsupwiththat.com/wp-content/uploads/2015/11/snowfalls-are-now-just-a-thing-of-the-past-theindependent.pdf, accessed and archived October 14, 2020.
Open Society Institute, 2007. Soros Foundations network Report 2006. Building Open Societies, 156 pp. https://www.opensocietyfoundations.org/uploads/cbdbf3ce-5497-4a41-adbc-7160c825817e/a_complete_3.pdf accessed and archived June 5, 2020.
Öpik, E. J., 1972. Planetary tides and sunspots. Irish Astronomical Journal, Special Issue, Vol. 10, p. 298-301, https://adsabs.harvard.edu/full/1972IrAJS..10....1L
Oppenheimer, C., et al., 2018. The Eldgjá eruption: timing, long-range impacts and influence on the Christianisation of Iceland. Climatic Change, Vol. 147, 13 p. 369-381, DOI: 10.1007/s10584-018-2171-9 d'Orbigny, A., 1840. Paléontologie Française, Terrains crétacés, tome 1: Céphalopodes, [Description des Mollusques et Rayonnés Fossiles, 6 tomes (1853-1860)], Librairie Victor Masson, Paris, 662 p. + 148 pls.
Oreskes, N., 2005. Beyond the Ivory Tower: The Scientific Consensus on Climate Change. Science, Vol. 306, Issue 5702, p. 1686, DOI: 10.1126/science.1103618 excerpts from the George Sarton Memorial Lecture, “Consensus in science: How do we know we're not wrong,” presented at the AAAS meeting on 13 February 2004, accessed and archived October 13, 2020. https://www.researchgate.net/publication/8150290_Beyond_the_Ivory_Tower_The_Scientific_Consensus_on_Climate_Cha nge Orwell, G., (i.e. Blair, E. A.) 1949. Nineteen Eighty-Four: A Novel, often published as 1984, a dystopian novel. Originally published by Secker & Warburg, 328 pp.
Osprey, S., et al., 2009. Sudden stratospheric warmings seen in MINOS deep undergroundmuon data. Geophysical Research Letters, Vol. 36, Issue 5, L05809, 6 pp., https://doi.org/10.1029/2008GL036359
Ovchinnikov, I. V., and Di Ventra, M., 2019. Chaos or Order?. Modern Physics Letters B, Vol. 33, 1950287, https://doi.org/10.1142/S0217984919502877
Owens, M. J., Usoskin, I., and Lockwood, M., 2012. Heliospheric modulation of galactic cosmic rays during grand solar minima: Past and future variations. Geophysical Research Letters, Vol. 39, Issue 19, L19102, 5 pp., https://doi.org/10.1029/2012GL053151
Owens, M. J., et al., 2017. The Maunder minimum and the Little Ice Age: an update from recent reconstructions and climate simulations. Journal of Space Weather Space Climate, Article A33, 10 pp., https://doi.org/10.1051/swsc/2017034
Padmore, T., 1978. Scenario for disaster. The Vancouver Sun, Mon, March 13, 1978, https://junkscience.com/wpcontent/uploads/2020/12/The_Vancouver_Sun_Mon__Mar_13__1978_.pdf, accessed and archived on April 5, 2021. Pagani, M., Zachos, J. C., Freeman, K. H., Tipple, B., Boharty, S., 2005. Marked decline in atmospheric carbon dioxide concentrations during the Paleogene. Science, Vol. 309, Issue 5734, p.600-603, DOI: 10.1126/science.1110063
Pagaran, J., Weber, M., DeLand, M. T., Floyd, L. E., and Burrows, J. P., 2011. Solar Spectral Irradiance Variations in 240 – 1600 nm During the Recent Solar Cycles 21-23. Solar Physics, Vol. 272, p. 159–188, DOI : 10.1007/s11207-011-9808-4
Painter, T. H., et al. 2013. End of the Little Ice Age in the Alps forced by industrial black carbon. Proc. of the Natl. Acad. of Sci. of the U.S.A., Vol. 110, n°38, p. 15216-15221, https://doi.org/10.1073/pnas.1302570110
Palitzsch, S., 1911. Ueber Die Messung Der Wasserstoffionenkonzentration Des Meerwassers. ICES Journal of Marine Science, Vol. s1, Issue 60, p. 3–27, https://doi.org/10.1093/icesjms/s1.60.3, https://zenodo.org/record/2431728/files/article.pdf?download=1
Pallé, E., Goode, P.R., Montañés-Rodriguez, P., and Koonin, S.E., 2004a. Changes in Earth’s reflectance over the past two decades. Science, Vol. 304, p.1299-1301, DOI: 10.1126/science.1094070
Pallé, E., Butler, C.J., and O’Brien, K., 2004b. The possible connection between ionization in the atmosphere by cosmic rays and low level clouds. Journal of Atmospheric and Solar-Terrestrial Physics, Vol. 66, p. 1779-1790, DOI: 10.1016/j.jastp.2004.07.041
Palem, K. V., 2005. Energy Aware Computing through Probabilistic Switching: A Study of Limits. IEEE Transactions on Computers Vol.54, Issue 9, p. 1123–1137, doi:10.1109/TC.2005.145
Palmer, B., 2009. 7 Billion Carbon Sinks, How much does breathing contribute to climate change? Slate, August 13, 2009, https://slate.com/news-and-politics/2009/08/are-you-heating-the-planet-when-you-breathe.html, accessed and archived on October 20, 2020.
Palmer, T. N., and Webster, P.J., 1993. Towards a unified approach to climate and weather prediction. Proceedings of 1st Demetra Conference on Climate Change held at Chianciano Terme, Italy. Published by the European Commission, 429 pp.
Palmer, T. N., et al. 2008. Towards the Probabilistic Earth-System Model. https://arxiv.org/pdf/0812.1074
Palmer, T. N., 2012. Towards the probabilistic Earth-system simulator: a vision for the future of climate and weather prediction. Quarterly Journal of the Royal Meteorological Society, Vol. 138, Issue 665, Part B, p. 841-861, https://doi.org/10.1002/qj.1923
Palmer, T., 2018. The ECMWF ensemble prediction system: Looking back (more than) 25 years and projecting forward 25 years. Quarterly Journal of the Royal Meteorological Society, Vol. 145, Issue S1, Special Issue: Special Supplement on 25 Years of Ensemble Forecasting, p. 12-24, https://doi.org/10.1002/qj.3383
Palmer, T., and Stevens, B., 2019. The scientific challenge of understanding and estimating climate change. Proc. of the Natl. Acad. of Sci. of the U.S.A., Vol. 116, n°49, p.24390-24395, https://doi.org/10.1073/pnas.1906691116
Paltridge, G., Farquhar, G. D., and Cuntz, M., 2007. Maximum entropy production, cloud feedback, and climate change. Geophysical Research Letters, Vol. 34, Issue 14, L14708, 6 pp., DOI: 10.1029/2007GL029925
Paltridge, G., Arking, A., and Pook, M., 2009. Trends in middle- and upper-level tropospheric humidity from NCEP reanalysis data. Theoretical and Applied Climatology, Vol. 98, n°3, p. 351-359, DOI: 10.1007/s00704-009-0117-x
Pancost, R.D., Freeman, K.H., Herrmann, A.D., Patzkowsky, M.E., Ainsaar, L., and Martma, T., 2013, Reconstructing Late Ordovician carbon cycle variations. Geochimica et Cosmochimica Acta, Vol. 105, p. 433–454, https://doi.org/10.1016/j.gca.2012.11.033
Pangburn, D., 2015. Global Warming Made Simple. http://lowaltitudeclouds.blogspot.com/, accessed and archived on December 10, 2020.
Pangburn, D., 2018. Climate Change Drivers. http://globalclimatedrivers2.blogspot.com/, accessed and archived on December 10, 2020.
Pangburn, D., 2020. Water vapor vs CO2 for planet warming. DOI: 10.13140/RG.2.2.17727.87205, https://watervaporandwarming.blogspot.com/2019/11/abstract-during-time-periodwhen-water.html, accessed and archived on December 10, 2020.
Panyushkina, I. P., Leavitt, S., and Mode, W. N., 2017. A 1400-Year Bølling-Allerød Tree-Ring Record from the U.S. Great Lakes Region. Tree-Ring Research, Vol. 73(2), p. 102-112, DOI: 10.3959/1536-1098-73.2.102
Park, J., 2009. A re-evaluation of the coherence between global-average atmospheric CO 2 and temperatures at interannual time scales. Geophysical Research Letters, 36, L22704, 5 pp., DOI: 10.1029/2009GL040975
Parker, E. N., 1958. Dynamics of the Interplanetary Gas and Magnetic Fields. Astrophysical Journal, vol. 128, p.664-676, DOI: 10.1086/146579
Parker, D. E., Legg, T. P., and Folland, C. K., 1992. A New Daily Central England Temperature Series, 1772-1991. International Journal of Climatology, Vol. 12, p. 317-342, https://doi.org/10.1002/joc.3370120402
Parker, D. E., Jones, P., Peterson, T. C., and Kennedy, J., 2009. Comment on ‘‘Unresolved issues with the assessment of multidecadal global land surface temperature trends’’ by Roger A. Pielke Sr. et al., Journal of Geophysical Research, Vol. 114, D05104, 4pp., DOI: 10.1029/2008JD010450
Parkinson, C. L., 2019. A 40-y record reveals gradual Antarctic sea ice increases followed by decreases at rates far exceeding the rates seen in the Arctic. Proc. of the Natl. Acad. of Sci. of the U.S.A., Vol. 116, Issue 29, p. 1441414423,https://doi.org/10.1073/pnas.1906556116
Parrenin, F., et al., 2007. The EDC3 chronology for the EPICA Dome C ice core. Climate of the Past, Vol. 3, p. 485-497, https://doi.org/10.5194/cp-3-485-2007
Parry, D., 2020. 'Staggering’ rise in climate emergencies in last 20 years, new disaster research shows. UN News, October 12, 2020, https://news.un.org/en/story/2020/10/1075142, accessed and archived on December 1, 2020.
Passow, U., and Carlson, C. A., 2012. The biological pump in a high CO2 world. Marine Ecology Progress Series, Vol. 470, p. 249-271, DOI: 10.3354/meps09985
Pearce, F., 2013. Carbon emissions helping to make Earth greener. New Scientist, Vol. 218, Issue 2920, p. 14, https://doi.org/10.1016/S0262-4079(13)61407-4, summary here: https://www.newscientist.com/article/mg21829204-400carbon-emissions-helping-to-make-earth-greener/
Pearson, P. N., and Palmer, M. R., 2000. Atmospheric carbon dioxide over the past 60 million years. Nature, Vol. 406, p. 695-699, DOI: 10.1038/35021000
Pearson, P. N., Foster, G. L., and Wade, B. S., 2009. Atmospheric carbon dioxide through the Eocene–Oligocene climate transition. Nature, Vol. 461, Issue 7267, p. 1110-1113, DOI: 10.1038/nature08447
Peden, J. A., 2009. The Middlebury Community Network, Editorial: The Great Global Warming Hoax? The Middlebury Community Network, January, 17, 2009, http://www.middlebury.net/op-ed/global-warming-01.html, accessed and archived on June 12, 2020.
Peitgen, H.-O. , Jürgens, H., Saupe, D., 2004. Chaos and Fractals, Springer, eBook ISBN: 0-387-21823-8, Print ISBN: 0-387-20229-3, 864 pp.
Peng, G., Matthews, J. L., Wang, M., Vose, R. and Sun, L., 2020. What Do Global Climate Models Tell Us about Future Arctic Sea Ice Coverage Changes? Climate, Vol. 8, Issue 1, 15 pp., https://doi.org/10.3390/cli8010015
Pentin, E., 2021. Pontifical Academy of Science Emails Document Vatican Hostility to Climate Change Skepticism. National Catholic Register, January 5, 2021, https://www.ncregister.com/blog/april-2015-conference, accessed and archived on January 15, 2021.
Peristykh, A. N., and Damon, P. E., 2003. Persistence of the Gleissberg 88‐year solar cycle over the last 12,000 years: Evidence from ∼ cosmogenic isotopes. Journal of Geophysical Research, Vol. 108, Issue A1, p. SSH 1-1-SSH 1-15, https://doi.org/10.1029/2002JA009390
Perna, D., Barucci, M. A., and Fulchignoni, M., 2013. The near-Earth objects and their potential threat to our planet. Astronomy and Astrophysics Review, Vol. 21, Article n°65, DOI: 10.1007/s00159-013-0065-4
Perry, C. A., 2007. Evidence for a physical linkage between galactic cosmic rays and regional climate time series. Advances in Space Research, Vol. 40, Issue 3, p. 353-364, DOI: 10.1016/j.asr.2007.02.079
Perry, M. J., 2019a. 50 years of failed doomsday, eco-pocalyptic predictions; the so-called ‘experts’ are 0-50. The American Enterprise Institute, Spetember 21, 2019, https://www.aei.org/carpe-diem/50-years-of-failed-doomsday-eco-pocalyptic-predictionsthe-so-called-experts-are-0-50/, accessed and archived on November 5, 2020.
Perry, M. J., 2019b. Michael Crichton explains why there is ‘no such thing as consensus science’ The American Enterprise Institute, December 15, 2019, https://www.aei.org/carpe-diem/michael-crichton-explains-why-there-is-no-such-thing-as-consensusscience/, accessed and archived on November 25, 2020.
Petersen, A. M., Vincent, E. M., and LeRoy Westerling, A., 2019. Discrepancy in scientific authority and media visibility of climate change scientists and contrarians. Nature Communications, Vol. 10, Article n°3502, 14 pp., https://doi.org/10.1038/s41467019-09959-4
Peterson, J. T., Komhyr, W. D., Harris, T. B., and Waterman, L. S., 1982. Atmospheric carbon dioxide measurements at Barrow, Alaska, 1973–1979. Tellus, Vol. 34, Issue 2, p. 166-175, DOI: 10.1111/j.2153-3490.1982.tb01804.x
Peterson, T. C., and Vose, R. S., 1997. An Overview of the Global Historical Climatology Network Temperature Database. Bulletin of the American Meteorological Society, Vol. 78, n°12, p. 2837-2849, DOI: 10.1175/15200477(1997)078<2837:AOOTGH>2.0.CO;2
Petit, J. R., Jouzel, J., Raynaud, D., Barkov, N. I., Barnola, J.-M., et al. 1999. Climate and atmospheric history of the past 420’000 years from the Vostok ice core, Antarctica, Nature, Vol. 399, p. 429-436, DOI: 10.1038/20859
Petit, J. R., et al., 2001. Vostok Ice Core Data for 420,000 Years. IGBP PAGES/World Data Center for Paleoclimatology Data Contribution Series #2001-076. NOAA/NGDC Paleoclimatology Program, Boulder , CO, USA
Petrone, P., 2019. The Herculaneum victims of the 79 AD Vesuvius eruption: a review. Journal of Anthropological Sciences, Vol. 97, p. 69-89, DOI: 10.4436/jass.97008
Pettit, E., and Nicholson, S. B., 1924. Radiation Measures on the Planet Mars. Publications of the Astronomical Society of the Pacific, Vol. 36, p. 269-272.
Pettit, E., and Nicholson, S. B., 1955. Temperatures on the Bright and Dark Sides of Venus. Publications of the Astronomical Society of the Pacific, 67(398), p. 293-303, DOI: 10.1086/126823
Pfister, C., 2016. The "Black Swan" of 1540: Aspects of a European Megadrought. In book: Climatic Change in Europe, Chapter: 9, Publisher: BrillEditors: Klaus Leggewie, Franz Mauelshagen, DOI: 10.1163/9789004356825_007
Phillips, N. A., 1956. The general circulation of the atmosphere: A numerical experiment. Quarterly Journal of the Royal Meteorological Society, Vol. 82, Issue 352, p. 123-164, https://doi.org/10.1002/qj.49708235202
Pielke Sr., R., 1995. My 1995 Resignation Letter From The IPCC. September 30, 2011, https://pielkeclimatesci.wordpress.com/2011/09/30/my-1995-resignation-letter-from-the-ipcc/, accessed and archived on July 28, 2022.
Pielke Sr., R. A., 1998. Climate prediction as an initial value problem. Bulletin of the American Meteorological Society, Vol.79, n°12, p.2743-2746. http://pielkeclimatesci.wordpress.com/files/2009/10/r-210.pdf
Pielke Sr., R. A., Liston, G. E., Eastman, J. L., Lu, L., and Coughenour, M., 1999. Seasonal weather prediction as an initial value problem. Journal of Geophysical Research Atmospheres, Vol. 104, Issue D16, p. 19463-19479, DOI: 10.1029/1999JD900231
Pielke Sr., R. A., et al., 2007a. Unresolved issues with the assessment of multidecadal global land surface temperature trends. Journal of Geophysical Research, Vol. 112, D24S08, 26 pp., DOI: 10.1029/2006JD008229.
Pielke Sr., R. A., et al., 2007b. Satellite-based Model Parameterization of Diabatic Heating. Eos, Vol. 88, No. 8, p. 96-97, https://doi.org/10.1029/2007EO080003
Pielke Sr., R. A., 2008. TRMM (Tropical Rainfall Measuring Mission) Data Set Potential in Climate Controversy By Joanne Simpson, private citizen. February 27, 2008, https://pielkeclimatesci.wordpress.com/2008/02/27/trmm-tropical-rainfall-measuringmission-data-set-potential-in-climate-controversy-by-joanne-simpson-private-citizen/, accessed and archived on December 2, 2020.
Pielke Jr., R., 2017. Hearing on Climate Science: Assumptions, Policy Implications, and the Scientific Method. Testimony to the Committee on Science, Space and Technology of the U.S. House of Representatives, March 29, 24 pp., https://republicansscience.house.gov/sites/republicans.science.house.gov/files/documents/HHRG-115-SY-WState-RPielke-20170329.pdf, accessed and archived on June 30, 2020.
Pielke Jr., R., and Ritchie, J., 2021a. How Climate Scenarios Lost Touch With Reality. Issues in Science and Technologies, National Academies of Sciences, Engineering, and Medecine, Arizona State University, Vol. XXXVII, NO. 4, Summer 2021, p. 75-83, https://issues.org/climate-change-scenarios-lost-touch-reality-pielke-ritchie/
Pielke Jr., R., and Ritchie, J., 2021b. Distorting the view of our climate future: The misuse and abuse of climate pathways and scenarios. Energy Research & Social Science, Vol. 72, Article 101890, https://doi.org/10.1016/j.erss.2020.101890
Pierrehumbert, R. T., 2010. Principles of Planetary Climate, Cambridge University Press, ISBN 978-0-521-86556-2 Hardback, 635 pp.DOI: 10.1017/CBO9780511780783
Pierrehumbert, R. T., 2011. Infrared radiation and planetary temperature. Physics Today, January, p 33-38, https://geosci.uchicago.edu/~rtp1/papers/PhysTodayRT2011.pdf, accessed and archived on July 27, 2022. Pira, K., 2019. The Dutch nitrogen crisis. Acid News, n°4, Dec. 2019, https://www.airclim.org/sites/default/files/acidnews_pdf/an0419.pdf, accessed and archived on July 26, 2022.
Plass, G. N., 1956. The Carbon Dioxide Theory of Climatic Change. Tellus, Volume VIII, Issue 2, p. 117-286, https://doi.org/10.1111/j.2153-3490.1956.tb01206.x
Platzman, G. W., 1979. The ENIAC computations of 1950 – gateway to numerical weather prediction. Bulletin of the American Meteorological Society, Vol. 60, Issue 4, p. 302–312, https://doi.org/10.1175/1520-0477(1979)060<0302:TECOTN>2.0.CO;2 Plimer, I., 2009. Heaven and Earth: Global Warming – The Missing Science. Connor Court Publishing, 504 pp., ISBN 0-7043-7166-9 Plimer, I., 2017. Climate Change Delusion and the Great Electricity Rip-off. ISBN-13 : 978-1925501629, 450 pp., https://www.amazon.co.uk/Climate-Change-Delusion-Electricity-Rip-off/dp/1925501620
Plimer, I., 2019. 97% Of Scientists Agree On Nothing. The Australian, Jan. 17, https://www.thegwpf.com/ian-plimer-97-of-scientistsagree-on-nothing/, accessed and archived on November 5, 2020.
PMEL, 2015. Quality of pH Measurements in the NODC Data Archives. PMEL Carbon Program, NOAA, https://www.pmel.noaa.gov/co2/story/Quality+of+pH+Measurements+in+the+NODC+Data+Archives, accessed and archived on August 30, 2020.
Poels, M., 2016. We don’t understand climate, it's very complicated and we're only at the beginning. The Uncertainty Has Settled, Interview with Freeman Dyson, Starting 1'10, https://www.marijnpoels.com/single-post/2019/03/05/we-don-t-understandclimate-its-very-complicated-and-were-only-at-the-beginning-to-unders, https://www.youtube.com/watch?v=GuoxLggqI_g [amazingly the quote of Manabe made by Dyson has been cut off but remains in the transcript of the interview by Poels].
Poincaré, H., 1890. Sur le problème des trois corps et les équations de la dynamique. Acta mathematica, Vol. 13, p. 1-270.
Pol, K. et al. 2010. New MIS 19 EPICA Dome C high resolution deuterium data: Hints for a problematic preservation of climate variability at sub-millennial scale in the “oldest ice”. Earth and Planetary Science Letters, Vol. 298, p. 95-103, DOI: 10.1016/j.epsl.2010.07.030
Poli, P., and Shapiro, N. M., 2022. Rapid Characterization of Large Volcanic Eruptions: Measuring the Impulse of the Hunga Tonga Ha’apai Explosion From Teleseismic Waves. Geophysical Research Letters, Vol. 49, Issue 8, https://doi.org/10.1029/2022GL098123
Pollack, J. B., and Yung, Y., 1980. Origin and Evolution of Planetary Atmospheres. Annual Review of Earth and Planetary Sciences, Vol.8, DOI: 10.1146/annurev.ea.08.050180.002233
Pollowitz, G., 2010. R.I.P.: Al Gore’s Chicago Climate Exchange Has Died. nationalreview, November 7, 2010 –https://www.nationalreview.com/planet-gore/rip-al-gores-chicago-climate-exchange-has-died-greg-pollowitz/, accessed and archived on July 11, 2022.
Polyakov, I. V., et al., 2003. Variability and Trends of Air Temperature and Pressure in the Maritime Arctic, 1875–2000. Journal of Climate, Vol. 16, Issue 12, p. 2067-2077, https://doi.org/10.1175/1520-0442(2003)016<2067:VATOAT>2.0.CO;2
Popper, K., 1959. The Logic of Scientific Discovery. London and New York Routledge [Logik der Forschung first published 1935 by Verlag von Julius Springer, Vienna, Austria], 513 pp., http://strangebeautiful.com/other-texts/popper-logic-scientificdiscovery.pdf
Populartechnology, 2014. 1350+ Peer-Reviewed Papers Supporting Skeptic Arguments Against ACC/AGW Alarmism. February, 12, http://www.populartechnology.net/2009/10/peer-reviewed-papers-supporting.html
Porter, S. E., Mosley‐Thompson, E., and Thompson, L. G., 2019. Ice Core δ18O Record Linked to Western Arctic Sea Ice Variability. Journal of Geophysical Research Atmospheres, Vol. 124, Issue 20, p. 10784-10801, https://doi.org/10.1029/2019JD031023
Postma, J. E., 2012. A Discussion on the Absence of a Measurable Greenhouse Effect. Principia Scientific International, 84 pp.,October, 22, 2012, http://principia-scientific.org/publications/Absence_Measureable_Greenhouse_Effect.pdf, accessed and archived on December 1, 2020.
Pötter, B., 2010. Ottmar Edenhofer im Interview - Klimaschutz als Entwicklungshilfe. Stuttgarter Zeitung, 17th Sept. 2010, https://www.stuttgarter-zeitung.de/inhalt.ottmar-edenhofer-im-interview-klimaschutz-als-entwicklungshilfe.1054c903-f7a54d98-884e-ff284fdb21f4.html, accessed and archived on June 21, 2022.
Poulos, D., 2016. Documentation of the solar activity variations and it's influence on climate. Global Journal of Physics, Vol. 4, n°1, p. 276-280.
Poulos, D., 2020. What Is Solar Wind? International Journal of Science and Engineering Investigations, Vol. 9, Issue 101, Paper ID: 910120-04, pp. 27-28, http://www.ijsei.com/papers/ijsei910120-04.pdf
Poyet, P. 1982. Géologie Planétaire. Comptes Rendus des Séminaires à l'Observatoire de Nice, At Observatoire de Nice, France, Vol.2, n°1. 535-V-1-V8, DOI: 10.13140/2.1.3326.0166
Poyet, P., and Leymarie, P., 1983. Litho-geochemistry and relationships with potential Uranium mineralizations. Proc. Fifth Meeting on Uranium Exploration Methods and Techniques, European Commission, 24th November, Brussels, Belgium, 4 pp., https://www.academia.edu/30128548, DOI: 10.13140/2.1.4293.4401
Poyet, P. 1985. Apport de la planétologie à la connaissance de la croûte terrestre primitive. Bulletin de la Societe Geologique de France, 1(1):5, DOI: 10.13140/2.1.3367.7443
Poyet, P., 1985. Sélection des anomalies de géochimie des eaux liées à d'éventuelles minéralisations uranifères. Développement d'un logiciel de traitement des données géochimiques. Report number: CEA-ARMINES n° MC-14.738, Bibliothèque de l'Ecole des Mines de Paris. CTAMN/85/R/05, DOI: 10.13140/2.1.1901.3760
Poyet, P., 1986. Méthodes de Discrimination des Anomalies Géochimiques Multi-élémentaires Significatives - Un Système d'Aide à la Décision en Prospection Uranifère, Thesis for: Doctorat d'Etat ès Sciences, D.Sc., “Sciences de la planète et de l'Univers” [Earth and Universe Sciences], INRIA/Université de Nice, Advisor: Pierre Leymarie, magna cum laude 730, DOI: 10.13140/2.1.3781.9847, https://www.theses.fr/031473717
Poyet, P., 1987. La structure de contrôle dans les systèmes experts de simulation. Proc. 6ème Congrès Reconnaissance des Formes et Intelligence Artificielle de l'Association Française de Cybernétique Economique et Technique, Antibes, France, 16-20
730Mention très honorable avec les félicitations du jury.
November, Editions Dunod Informatique, ISBN 2-04-013480-8, Vol. 2, p. 723-738, https://www.academia.edu/30164279, DOI: 10.13140/2.1.3257.6969
Poyet, P., Haren, P., and De La Cruz, P., 1987. Un système expert de simulation navale. Proc. 6ème Congrès Reconnaissance des Formes et Intelligence Artificielle de l'Association Française de Cybernétique Economique et Technique, Antibes, France, 1620 November, Editions Dunod Informatique, ISBN 2-04-013475-1, Vol 1, p. 587-592, https://www.academia.edu/30164536, DOI: 10.13140/2.1.1160.5446
Poyet, P., and De La Cruz, P., 1988. Une Nouvelle Classe de Simulateurs Destinée aux Aides Tactiques et aux Systèmes d'Armes. Proc. Eigth International Workshop: Expert System & Their Applications, Avignon (France), Vol. Specialized Conferences, ISBN 2906899-07-0, p. 89-99, DOI: 10.13140/2.1.3650.9121
Poyet, P., and Detay, M., 1988a. Hydroexpert : aide à l'implantation d'ouvrages d'hydraulique villageoise. Proc. Eigth International Workshop: Expert System & Their Applications, Avignon (France), Vol. 2, May 30 - June 3, ISBN 2-906899-07-0, p. 397-410, https://www.academia.edu/30015266, DOI: 10.13140/2.1.4699.4889
Poyet, P., and Detay, M., 1988b. L'Avènement d'une Génération de Systèmes Experts de Terrain. Proc. of Sahel Forum on the Stateof-the-Art of Hydrology and Hydrogeology in the Arid and Semi Arid Areas of Africa, Ouagadougou, Burkina Faso, Edited by Misganaw Demissie and Glenn E. Stout, International Water Resources Association, Illinois, ISBN 0-923227-05-9, p. 800-811, https://www.academia.edu/30159582, DOI: 10.13140/2.1.4912.4809
Poyet, P., and Detay, M., 1988c. Un système expert d’aide à l’implantation de forages en hydraulique villageoise. Rapport de Recherche de l’Institut National de Recherche en Informatique et en Automatique, n°936, Décembre, 38 p., ISSN 0249-6399. DOI: 10.13140/RG.2.1.2078.0488/1
Poyet, P., and Haren, P., 1988. Artificial Intelligence Modelling of Complex Systems. Chapter in peer-reviewed book: Modeling Techniques and Tools for Computer Performance Evaluation, p. 265-290, Plenum publishing corporation, Ramon Puigjaner and Dominique Potier (eds.), DOI: 10.1007/978-1-4613-0533-0_18
Poyet, 1988. Réalisation d'un Prototype de Simulateur Expert d'Aide au Commandement de Sous-Marins. Technical Report, ILOG S.A., 174 pp., https://www.academia.edu/30128543, DOI: 10.13140/2.1.2856.7685
Poyet, P., and Delcambre, B., 1989. NOE: Expert System on Technical Inspection of Waterproofing on Flat Roofs. IABSE Colloquium, Expert Systems in Civil Engineering, Bergamo, Published by the International Association for Bridge and Structural Engineering, ISBN 3-85748-058-0, Vol 58, p. 175-187, http://dx.doi.org/10.5169/seals-44905
Poyet, P., and Detay, M., 1989a. HYDROLAB: an example of a new generation of compact expert systems. Computers & Geosciences, Vol. 15, n°3, p.255-267, DOI: 10.1016/0098-3004(89)90039-3
Poyet, P., and Detay, M., 1989b. HYDROLAB: Un système expert de poche en hydraulique villageoise. Technique et Science Informatiques, Vol. 8, n°2, p. 157-167.
Poyet, P., and Detay, M., 1989c. Enjeux Sociaux et Industriels de l'Intelligence Artificielle en Hydraulique Villageoise. Proc. Première Conférence et Exposition Européenne sur les Techniques et les Applications de l'Intelligence Artificielle en milieu Industriel, Paris, Editions Scientifiques et Techniques Hermes, ISBN 2-86601-171-6, Vol. 2, p.621-652, https://www.academia.edu/30159769, DOI: 10.13140/2.1.3601.7604
Poyet, P., De la Cruz, P., Miléo, T., Loiseau, J.-N., 1989. Récentes Études en Matière de Simulations Tactiques Intelligentes. Proc. Ninth International Workshop: Expert System & Their Applications, Avignon (France), May 29-June 2, Vol. Specialized Conferences A.I. and Defense, ISBN 2-906899-24-0, p. 149-181, https://www.academia.edu/30160735, DOI: 10.13140/2.1.4126.0482
Poyet, P., 1990. Integrated access to information systems. Applied Artificial Intelligence, Vol. 4, n°3, p. 179-238, DOI: 10.1080/08839519008927949
Poyet, P., and Delcambre, B., 1990. Noé: Vers une Base de Connaissances Multi-Services en Étanchéité de Toitures Terrasses. Proc. EuropIA 90, Deuxième Conf. Européenne sur les Applications de l'Intelligence Artificielle et de la Robotique en Architecture et Génie Civil, Liège, Belgique, ISBN 2-86601-229-1, Vol. 1, p. 228-235, https://www.academia.edu/30128106, DOI: 10.13140/2.1.1851.2000
Poyet, P., and Detay, M., 1990. Compact expert system for water resources assessment in Africa. Proc. of the 28th International Geological Congress, selected papers on Hydrogeology, Washington, D.C., USA, July 9-19 1989, Vol.1, p.417-430, Simpson E. S. and Sharp, Jr., J. M., (eds.), Verlag Heinz Heise, ISBN 3-922705-60-X, DOI: 10.13140/2.1.3339.6166
Poyet, P., Dubois, A.M., and Delcambre, B., 1990. Artificial Intelligence Software Engineering in Building Engineering. ComputerAided Civil and Infrastructure Engineering, Vol. 5, n°3, p. 167-205, DOI: 10.1111/j.1467-8667.1990.tb00376.x
Poyet, P., 1991. Introduction to the special issue "Artificial Intelligence and Construction: Research in Europe". Computer-Aided Civil and Infrastructure Engineering, Vol. 6, Issue 4, p. 263-265, DOI: 10.1111/j.1467-8667.1991.tb00257.x
Poyet, P., 1992. Computer-Aided Decision Techniques for Hydrogeochemical Uranium Exploration. In peer-reviewed book: Use of Microcomputers in Geology, Chapter 3, p. 25-71, ISBN 978-1-4899-2337-0, Plenum Publishing Corporation - Springer Science, Hans-Kürzl and Daniel F. Merriam (eds.), DOI: 10.1007/978-1-4899-2335-6_3
Poyet, P., and Detay, M., 1992. Artificial Intelligence Tools and Techniques for Water-Resources Assessment in Africa. In peerreviewed book: Use of Microcomputers in Geology, Chapter 7, p.119-159, ISBN 978-1-4899-2337-0, Plenum Publishing Corporation - Springer Science, Hans-Kürzl and Daniel F. Merriam (eds.), DOI: 10.1007/978-1-4899-2335-6_7
Poyet, P., Brisson, E., and Debras, P., 1992. Computer assisted anti-seismic design - the detached houses case study. Building and Environment, Vol. 27, Issue 4, p. 483-492, DOI: 10.1016/0360-1323(92)90046-R
Poyet, P., 1993. Évolution des pratiques informatiques dans le secteur de la construction. Cahiers du CSTB, Livraison 340, Cahier 2660, 31 pp, ISSN 008-9850, pdf file is available at https://www.academia.edu/30128521 and https://www.researchgate.net/
Poyet, P., 1994. Concurrent Large Scale Engineering Solutions: product models and software architectures ISO 10303 STEP / TC184 / SC4 WG3 Meeting, Automation systems and integration — Product data representation and exchange, 16-21 Oct. 1994, Greenville, S.C., USA, 26 pp., https://www.academia.edu/30128536, DOI: 10.13140/2.1.1538.8165
Poyet, P., Dubois, A.-M., 1995. Software Environments for Integrated Construction. In peer-reviewed book: Integrated Construction Information, Chapter: 13, Publisher: E & FN Spon an imprint of Chapman & Hall, Boundary Row, London SE1 8HN, Peter Brandon and Martin Betts (eds.), p. 211-227, DOI: 10.13140/2.1.4093.2801
Poyet, P., Monceyron, J.-L., and Sauce, G., 1995. Building Services: Heating, Ventilation and Air Conditioning. Report number: ISO TC184/SC4/WG3 N497 (T12) - Part 228 - Working Draft, Affiliation: ISO, 41 pp. + Figures, https://www.academia.edu/30128073
Poyet, P., Zarli, A., Besse, G., and Monceyron, J.-L., 1995. KBS and STEP architectural CAD Systems (The integration of STEP compliant KBS and CAD systems in Building Design). Revue internationale de CFAO et d’informatique graphique [International Journal of CAD/CAM and Computer Graphics], Vol. 10, n°1-2, p.45-55, https://www.academia.edu/30128069, DOI: 10.13140/2.1.4587.5846
Poyet, P., and Monceyron, J.-L., 1997a. Les classes d'objets IFCs - Finalités et mode d'emploi. Cahiers du CSTB, Livraison 383, Cahier 2986, 17 pp, pdf file is available at https://www.academia.edu/30128074/ and https://www.researchgate.net/
Poyet, P., and Monceyron, J.-L., 1997b. Methods and tools for handling multiple view subsets of product models in a distributed, data sharing environment. ISO 10303 STEP/TC184/SC4 WG3 Meeting, Automation systems and integration — Product data representation and exchange, 1-6th June 1997, San Diego, CA, USA, 27 pp., available at https://www.academia.edu/30128072, DOI: 10.13140/2.1.3112.3845
Poyet, P., and Zarli, 1997. Distributed objects and architectures for distributed enterprises. Proceedings of Product Data Technology Days 1997, 14 to 16 April, Sophia Antipolis, France, Invited paper as Conference Organizer, https://www.academia.edu/30128085, DOI: 10.13140/2.1.1777.7288
Poyet, P., and Zarli, 1999. Computer Integrated Construction towards Distributed Objects and Architectures for Virtual Enterprises. Invited white paper presented at ISO 10303 STEP/TC184/SC4 WG3 Meeting, Automation systems and integration - Product data representation and exchange, 26-28th Jan. 1999, San Francisco, CA, USA, 15 pp., https://www.academia.edu/30128082, DOI: 10.13140/2.1.4819.6162
Poyet, P., Zarli, A., and Besse, G., 2002. Vers une Généralisation de l'Usage de la Norme STEP dans le secteur du Bâtiment. CSTB, Report number: SAIL/02-1405, 115 pp., https://www.academia.edu/30128071, DOI: 10.13140/2.1.4909.8566
Poyet, P., Bus, N., and Keilholz, W., 2004. Etude et propositions pour l’avenir logiciel du CSTB. CSTB (ed.), 162pp., pdf file at https://www.academia.edu/30128509 and https://www.researchgate.net/, DOI: 10.13140/2.1.3473.4727
Poyet, P., and Besse, G., 2005a. Systèmes Experts de Trading en Ligne - Trading Expert Systems On Line TExSOL ®, 194pp., https://www.academia.edu/30128494, DOI: 10.13140/2.1.1212.4809
Poyet, P., and Besse, G., 2005b. COSMOS Hedge Funds and Trading Expert-System TEXSOL - A White Paper, DOI: 10.13140/RG.2.2.15019.75044
Poyet, P., 2012. Twelve answers to John P. Hussman's Financial QUIZZ. 23 pp., https://www.academia.edu/30128507 DOI: 10.13140/2.1.2596.2247
Poyet, P., Vida, J.-P., and Abad, J., 2014. « Jas de Tardivy » Observatory in Caussols - Brief History and Some Deep-Sky Images. 29 pp., https://www.academia.edu/30128511, DOI: 10.13140/2.1.1313.8885
Poyet, P., 2014. Revisiting the Collision of D/1993 F2 (Shoemaker–Levy) with Jupiter 20 years later: a Planisphere is worth a thousand words. 12 pp., https://www.academia.edu/30128508, DOI: 10.13140/2.1.1979.3927
Poyet, P., 2017a. Calculating visual binaries’ orbits: should it ever be fully automated ? Discussing 13 stars with 8 first-time orbits, 43 p., https://www.academia.edu/34358613, DOI: 10.13140/RG.2.2.35677.92647
Poyet, P., 2017b. Spreadsheet of "Calculating visual binaries' orbits: should it ever be fully automated ? Discussing 13 stars with 8 first-time orbits", DOI: 10.13140/RG.2.2.15290.90569
https://www.researchgate.net/publication/321154995_Spreadsheet_of_Calculating_visual_binaries'_orbits_should_it_ever_be_fully _automated_Discussing_13_stars_with_8_first-time_orbits
Poyet, P., 2019. Calculating visual binaries’ orbits: should it ever be fully automated ? Discussing 13 stars with 8 first-time orbits, LAP Lambert Academic Publishing, ISBN-13: 978-620-2-19802-8, ISBN-10: 6202198028, EAN 9786202198028, 43 pp.
Poyet, P., 2021a. Book Review: “Politics & Climate Science - A HISTORY” by Andy May. January 30th, 2021, 9 pp., DOI: 10.13140/RG.2.2.29634.71365
Poyet, P., 2021b. The Rational Climate e-Book: Cooler is Riskier. The Sorry State of Climate Science and Policies. Final First Edition, April 19th, 125 Figures, 185 Equations, 473 pp., DOI: 10.13140/RG.2.2.28648.80640
Prather, M. J., 2007. Lifetimes and time-scales in atmospheric chemistry. Philosophical Transactions of the Royal Society A, Vol. 365, Issue 1856, p. 1705–1726, DOI: 10.1098/rsta.2007.2040
Press, W. H., and Dyson, F. J., 2012. Iterated Prisoner’s Dilemma contains strategies that dominate any evolutionary opponent. Proc. of the Natl. Acad. of Sci. of the U.S.A., Vol. 109, Issue 26, p. 10409-10413, https://doi.org/10.1073/pnas.1206569109
Preto, N., Hinnov, L. A., DeZanche, V., Mietto, P., and Hardie, L. A., 2004. The Milankovitch interpretation of the Latemar platform cycles (Dolomites, Italy): implications for geochronology biostratigraphy, and middle Triassic carbonate accumulation. In book: Cyclostratigraphy: Approaches and Case Histories, p.167-182, DOI: 10.2110/pec.04.81.0167
Pretzsch, H., Biber, P., Schütze, G., Uhl, E., and Rötzer, T., 2014. Forest stand growth dynamics in Central Europe have accelerated since 1870. Nature Communications, Vol. 5, Article n°4967, 10 pp., DOI: 10.1038/ncomms5967
Prokoph, A., Shields, G. A., Veizer, J., 2008. Compilation and time-series analysis of a marine carbonate δ 18O, δ13C, 87Sr/86Sr and δ34S database through Earth history. Earth Science Reviews, Vol. 87, Issue 3, p. 113–133, DOI: 10.1016/j.earscirev.2007.12.003
Prothero, D., 2003. The Late Eocene-Oligocene Extinctions. Annual Review of Earth and Planetary Science, Vol. 22, n°1, p. 145-165, DOI: 10.1146/annurev.ea.22.050194.001045
Prud'homme, R., 2010. Climat : la « pétition des 600 » ruine la crédibilité du Giec. April 15, 2010, https://energie.lexpansion.com/climat/climat-la-petition-des-600-ruine-la-credibilite-du-giec_a-35-3999.html, accessed and archived on February 10, 2021.
Pudykiewicz, J., and Brunet, G., 2008. The first hundred years of numerical weather prediction. In: M. Gad-el-Hak (Ed.), Large-Scale Disasters: Prediction, Control, and Mitigation, Cambridge: Cambridge University Press, p. 427-446, DOI: 10.1017/CBO9780511535963.020
Purkey, S. G., Johnson, G. C., and Chambers, D. P., 2014. Relative contributions of ocean mass and deep steric changes to sea level rise between 1993 and 2013. Journal of Geophysical Research, Vol. 119, Issue 11, p. 7509-7522, https://doi.org/10.1002/2014JC010180
Purkey, S. and Johnson, G. C., 2015. Diagnosing Causes of Sea Level Rise. Diagnosing Causes of Sea Level Rise. http://www.realclimate.org/index.php/archives/2015/01/diagnosing-causes-of-sea-level-rise/#ITEM-17982-0
Pustilnik, L. A., and Yom Din, G., 2004. Influence of solar activity on the state of the wheat market in medieval Europe. Solar Physics, Vol. 223, n°1, p. 335-356, DOI: 10.1007/s11207-004-5356-5
Pyle, D.M., Ricketts, G.D., Margari, V., van Andel, T. H., Sinitsyn, A. A., Praslov, N.D., Lisitsyn, S., 2006. Wide dispersal and deposition of distal tephra during the Pleistocene ‘Campanian Ignimbrite/Y50 eruption, Italy. Quaternary Science Reviews, Vol. 25, p. 2713–2728, DOI: 10.1016/j.quascirev.2006.06.008
Quay, P., Tilbrook, B., and Wong, C. S., 1992. Oceanic Uptake of Fossil Fuel CO 2: Carbon-13 Evidence. Science, Vol. 256, Issue 5053, p 74-79, DOI: 10.1126/science.256.5053.74
Quinn, J., 2010. Global Warming. Geophysical Counterpoints to the Enhanced Greenhouse Theory. Dorrance Publ., Pittsburgh, 978-14349-0581-9.
Rabeh, T., Carvalho, J., Khalil, A., El-Aal, E., and El-Hemaly, I., 2011. Climate Changes Associated with High-Amplitude Sq Geomagnetic Variations. Acta Geophysica, Vol. 59, no. 5, Oct. 2011, pp. 1044-1056, DOI: 10.2478/s11600-011-0029-x
Rahmstorf, S., 2002. Ocean circulation and climate during the past 120,000 years, Nature, Vol. 419, Issue 6903, p. 207-214, DOI: 10.1038/nature01090
Rahmstorf, S., 2004 The climate sceptics Munich Re, Weather catastrophes and climate change. http://www.pikpotsdam.de/~stefan/Publications/Other/rahmstorf_climate_sceptics_2004.pdf, accessed and archived on December 1, 2020. Rahmstorf, S., 2006. Thermohaline Ocean Circulation. In: Encyclopedia of Quaternary Sciences, Edited by S. A. Elias. Elsevier, Amsterdam 2006, 10 pp., http://www.pik-potsdam.de/~stefan/Publications/Book_chapters/rahmstorf_eqs_2006.pdf, accessed and archived on August 3, 2020.
Raina, V. K., 2009. Himalayan Glaciers: A State-of-Art Review of Glacial Studies, Glacial Retreat and Climate Change, Discussion Paper, Ministry of Environment and Forests, Government of India, New Delhi, 56 p., https://www.heartland.org/_templateassets/documents/publications/indian_glacier_paper_discussion_paper_him_2.pdf, accessed and archived on July 6, 2020. Raina, V. K., 2013. Global Warming and the Glacier Retreat: An Overview. In: Sinha R., Ravindra R. (eds) Earth System Processes and Disaster Management Society of Earth Scientists Series, Berlin, Heidelberg, Vol. 1, pp 9-23, https://doi.org/10.1007/978-3642-28845-6_2
Rajapaksa, G., 2021. Speech by President Gotabaya Rajapaksa at the COP 26 Side Event, on 31 Oct 2021, in Glasgow, Scotland, UK. High Commission of the Democratic Socialist Republic of Sri Lanka in the United Kingdom, https://srilankahc.uk/2021/11/01/speech-by-president-gotabaya-rajapaksa-at-the-cop-26-side-event-on-31-oct-2021-inglasgow-scotland-uk/, accessed and archived on July 13, 2022.
Rajaratnam, B., Romano, J., Tsiang, M., and Diffenbaugh, N. S., 2015. Debunking the climate hiatus. Climatic Change, Vol. 133, p. 129140, DOI: 10.1007/s10584-015-1495-y
Ramanathan, V., and Coakley Jr., J. A., 1978. Climate Modelling Through Radiative-Convective Models. Reviews of Geophysics and Space Physics, Vol. 16, n°4, p. 465-489.
Ramanathan, V., Lian, M. S., Cess, R. D., 1979.Increased atmospheric CO2: Zonal and seasonal estimates of the effect on the radiation energy balance and surface temperature. Journal of Geophysical Research, Vol. 84, Issue C8, p. 4949-4958, https://doi.org/10.1029/JC084iC08p04949
Ramanathan, V., Pitcher, E. J., Malone, R. C., Blackmon, M. L., 1983. The Response of a Spectral General Circulation Model to Refinements in Radiative Processes. Journal of Atmospheric Sciences, Vol. 40, Issue 3, p. 605-630, doi: 10.1175/15200469(1983)040<0605:TROASG>2.0.CO;2
Ramanathan, V., Callis, L., Cess, R., Hansen, J., Isaksen, I., Kuhn, W., Lacis, A., Luther, F., Mahlman, J., Reck, R. and Schlesinger, M., 1987. Climate-chemical interactions and effects of changing atmospheric trace gases. Reviews of Geophysics, Vol. 25, n°7, p.1441-1482, DOI: 10.1029/RG025i007p01441
Ramanathan, V., R. D. Cess, E. F. Harrison, P. Minnis, B. R. Barkstrom, E. Ahmad, and D. Hartmann, 1989. Cloud‐Radiative Forcing and Climate: Results from the Earth Radiation Budget Experiment. Science, Vol. 243, Issue 4887, p. 57‐63, DOI: 10.1126/science.243.4887.57
Ramanathan, V., and Collins, W., 1991. Thermodynamic regulation of ocean warming by cirrus clouds deduced from observations of the 1987 El Niño. Nature, Vol. 351, Issue 6321, p. 27-32, DOI: 10.1038/351027a0
Ramanathan, V. and Vogelmann, A. M. , 1997. Greenhouse effect, atmospheric solar absorption and the earth’s radiation budget : From the arrhenius-langley era to the 1990s. AMBIO, Vol. 26, n°1, p. 38–46, https://www.jstor.org/stable/4314548
Ramos-Román, M. J., et al., 2018. Millennial-scale cyclical environment and climate variability during the Holocene in the western Mediterranean region deduced from a new multi-proxy analysis from the Padul record (Sierra Nevada, Spain). Global and Planetary Change, Vol. 168, p. 35-53, DOI: 10.1016/j.gloplacha.2018.06.003
Rampino, M. R., Self, S. and, Stothers, R. B., 1988. Volcanic Winters. Annual Review of Earth and Planetary Sciences, Vol.16, p. 73-99, DOI: 10.1146/annurev.ea.16.050188.000445
Rampino, M.R., and Self, S., 1992. Volcanic winter and accelerated glaciation following the Toba super-eruption. Nature, Vol. 359, p. 50-52, DOI: 10.1038/359050a0.
Rampino, M. R., and Self, S., 1993a. Climate-volcanism feedback and the Toba eruption of ~74,000 years ago: Quaternary Research, Vol. 40, p. 269–280, DOI: 10.1006/qres.1993.1081
Rampino, M. R., and Self, S., 1993b, Bottleneck in human evolution and the Toba eruption. Science, Vol. 262, p. 1955, DOI: 10.1126/science.8266085
Rampino, M. R., and Ambrose, S. H., 2000. Volcanic winter in the Garden of Eden: The Toba supereruption and the late Pleistocene human population crash. Special Paper of the Geological Society of America, Vol. 345, p. 71-82, DOI: 10.1130/0-8137-23450.71
Rampino, M. R., and Caldeira, K., 2020. A 32-million year cycle detected in sea-level fluctuations over the last 545 Myr. Geoscience Frontiers, Vol. 11, Issue 6, p. 2061-2065, https://doi.org/10.1016/j.gsf.2020.06.005
Ramstein, G., Fluteau, F., Besse, J., and Joussaume, S., 1997. Effect of orogeny, plate motion and land-sea distribution on Eurasian climate change over the past 30 million years. Nature, Vol. 386, p. 788-795, https://doi.org/10.1038/386788a0
Randall, D. A., 2000. General Circulation Model Development - Past, Present and Future. Vol. 70 in the International Geophysics Series, Academic Press, International Standard Book Number (ISBN) 0-12-578010-9, 807 pp.
Randall, D. A., et al., 2007. Climate models and their evaluation. In S. Solomon et al. (eds.), Chapter 8, Climate Change 2007: The Physical Science Basis. Contribution of Working Group I to the Fourth Assessment Report of the Intergovernmental Panel on Climate Change, New York: Cambridge University Press, p. 589–662. https://www.ipcc.ch/site/assets/uploads/2018/02/ar4wg1-chapter8-1.pdf
Randerson, J. T., Chapin, F. S., Harden, J. W., Neff, J. C., and Harmon, M. E., 2002. Net Ecosystem Production: a Comprehensive Measure of Net Carbon Accumulation by Ecosystems. Ecological Applications, Vol. 12, Issue 4, p. 937-947, https://doi.org/10.1890/1051-0761(2002)012[0937:NEPACM]2.0.CO;2
Randerson J. T., et al., 2015. Multicentury changes in ocean and land contributions to the climate-carbon feedback. Global Biogeochemical Cycles, Vol. 29, p. 744–759, DOI: 10.1002/2014GB005079
Rao, J., Garfinkel, C. I., and Ren, R., 2019. Modulation of the Northern Winter Stratospheric El Niño–Southern Oscillation Teleconnection by the PDO. Journal of Climate, Vol. 32, n°18, p. 5761-5783, DOI: 10.1175/JCLI-D-19-0087.1
Raschke, E., 1968. The radiation balance of the earth-atmosphere system from radiation measurements of the Nimbus 2 meteorological satellite. Goddard Space Flight Center, NASA Document ID: 19680018750, 86 pp., https://ntrs.nasa.gov/citations/19680018750
Rasmusson, E.M., and Carpenter, T.H., 1982. Variations in Tropical Sea Surface Temperature and Wind Associated with the Southern Oscillation/El Niño. Monthly Weather Review, Vol. 110, Issue 5, p. 354-384, https://doi.org/10.1175/15200493(1982)110<0354:VITSST>2.0.CO;2
Rasool, S. L., and Schneider, S. H., 1971. Atmospheric carbon dioxide and aerosols: Effects of large increases on global climate. Science, Vol. 173, Issue 3992, p. 138–141, https://doi.org/10.1126/science.173.3992.138
Rasmussen, S. O., et al., 2006. A new Greenland ice core chronology for the last glacial termination. Journal of Geophysical Research, Vol. 111, Issue D6, D06102, 16 pp., https://doi.org/10.1029/2005JD006079
Raspopov, O. M.,Dergachev, V. A., Esper, J., Kozyreva, O.V., Frank, D., et al., 2008. The influence of the de Vries (200-year) solar ∼ cycle on climate variations: Results from the Central Asian Mountains and their global link. Palaeogeography, Palaeoclimatology, Palaeoecology, Vol. 259, p. 6–16 , doi:10.1016/j.palaeo.2006.12.017
Raymo, M. E., Ruddiman, W. F., and Froelich, P. N., 1988. Influence of late Cenozoic mountain building on ocean geochemical cycles. Geology, Vol. 16, n°7, p. 649–653, DOI: 10.1130/0091-7613(1988)016<0649:IOLCMB>2.3.CO;2
Raymo, M. E., and Ruddiman, W. F., 1992. Tectonic forcing of late Cenozoic climate. Nature, Vol. 359, 6391, p. 117-122, https://doi.org/10.1038/359117a0
Raymo, M. E., Ruddiman, W. F., and Froelich, P. N., 1988. Influence of late Cenozoic mountain building on ocean geochemical cycles. Geology, Vol. 16, n°7, p. 649–653, DOI: 10.1130/0091-7613(1988)016<0649:IOLCMB>2.3.CO;2
Raymo, M. E., and Huybers, P., 2008. Unlocking the mysteries of the ice ages. Nature, Vol. 451, p. 284–285, https://doi.org/10.1038/nature06589
Raynaud, D., and Barnola, J.-M., 1985. An Antarctic ice core reveals atmospheric CO 2 variations over the past few centuries. Nature, Vol. 315, p. 309-311, https://doi.org/10.1038/315309a0
Raynaud, D., et al., 1994, The Ice Record of Greenhouse Gases. Science, Vol. 259, Issue 5097, p. 926-934, DOI: 10.1126/science.259.5097.926
Raynaud, D., et al., 2000. The ice record of greenhouse gases: a view in the context of future changes. Quaternary Science Reviews, Vol. 19, p. 9-17, DOI: 10.1016/S0277-3791(99)00082-7
Readfearn, G., 2017. How Climate Science Deniers Manufacture Quotes to Convince You the United Nations Is One Big Socialist Plot. DeSmog, Nov. 7, 2017, https://www.desmog.com/2017/11/07/how-climate-science-deniers-manufacture-quotes-convinceyou-united-nations-one-big-socialist-plot/, accessed and archived on June 21, 2022.
Redd, N. T., 2016. Our Galactic Arm May Have a Longer Reach Than We Thought. space.com, October 28, 2016, https://www.space.com/34543-suns-galactic-arm-longer-than-thought.html, accessed and archived on December 25, 2020.
Reeves, R. W., and Gemmill, D., 2004. Origins of a ‘diagnostics climate center’. Proceedings of the 29th Annual Climate Diagnostics & Prediction Workshop, Monona Terrace Convention Center, Madison, Wisconsin, accessed and archived on July 14, 2020. https://www.cpc.ncep.noaa.gov/products/outreach/proceedings/cdw29_proceedings/Reeves.pdf
Relman, D. A., 2020. To stop the next pandemic, we need to unravel the origins of COVID-19. Proc. of the Natl. Acad. of Sci. of the U.S.A., Vol. 117, n°47, p. 29246-29248, https://doi.org/10.1073/pnas.2021133117
Renaud, P., 2012. Les retombées des essais aériens d'armes nucléaires. IRSN, voir Fiche n°13 C14, 13 pp., http://www.pedagogie.acaix-marseille.fr/upload/docs/application/pdf/2012-01/tirs-atmosph.pdf, accessed and archived on February 12, 2021. René, P., 2011. Régression des glaciers pyrénéens et transformation du paysage depuis le Petit Âge Glaciaire. Revue Géographique des Pyrénées et du Sud-Ouest, n°32, p. 5-19, https://journals.openedition.org/soe/639, accessed April 2020
Renssen, H., Beets, C.J. , Fichefet, T. , Goosse, H., and Kroon, D., 2004. Modeling the climate response to a massive methane release from gas hydrates, Paleoceanography, Vol. 19, PA2010, 13 pp., DOI: 10.1029/2003PA000968
Rérolle, V. M. C., et al., 2016. Measuring pH in the Arctic Ocean: Colorimetric method or SeaFET? Methods in Oceanography, Vol. 17, p. 32-49, DOI: 10.1016/j.mio.2016.05.006
Reuters, 2020. Fact check: Climate change skeptic Naomi Seibt was not banned from social media for her views and she is appealing a regulator’s order to remove two videos. https://www.reuters.com/article/uk-factcheck-seibt-fined-banned-social-midUSKBN2322PD, accessed and archived on October 24, 2020.
Reuters Staff, 2020. Global carbon trading turnover at record $214 billion last year: research. https://www.reuters.com/article/uscarbontrading-turnover-idUSKBN1ZN1RN, accessed and archived on November 2, 2020.
Revelle, R., and Suess, H. A., 1957. Carbon Dioxide Exchange Between Atmosphere and Ocean and the Question of an Increase of Atmospheric CO2 during the Past Decades. Tellus IX, 1, p. 18-27. https://doi.org/10.1111/j.2153-3490.1957.tb01849.x , https://pdfs.semanticscholar.org/d014/06a57bff758203390e36247bd96e0c9f8102.pdf
Revelle, R., et al., 1965. Atmospheric Carbon Dioxide, Carbon Dioxide from Fossil Fuels - The Invisible Pollutant. In: Restoring the Quality of our Environment, Report of the Environmental Pollution Panel, President's Science Advisory Committee, The White House, Nov., p. 111-131.
Rhoades, D. A., and Salinger, M.J., 1993. Adjustment of temperature and rainfall records for site changes. International Journal of Climatology, vol. 13, issue 8, p. 899-913, DOI: 10.1002/joc.3370130807
Rhodes et al., 2015. Enhanced tropical methane production in response to iceberg discharge in the North Atlantic. Science, Vol. 348, Issue 6238, p. 1016-1019, DOI: 10.1126/science.1262005, http://citeseerx.ist.psu.edu/viewdoc/download? doi=10.1.1.855.3657&rep=rep1&type=pdf
Rial, A., et al., 2004. Nonlinearities, feedbacks and critical thresholds within the Earth’s climate system. Climatic Change, Vol. 65, p.11-38,https://doi.org/10.1023/B:CLIM.0000037493.89489.3f, https://www.globalcarbonproject.org/global/pdf/pep/Rial2004.NonlinearitiesCC.pdf
Richard, K., 2016. Massive Cover-up Exposed: 285 Papers From 1960s-’80s Reveal Robust Global Cooling Scientific ‘Consensus’. September 13, http://notrickszone.com/2016/09/13/massive-cover-up-exposed-285-papers-from-1960s-80s-reveal-robustglobal-cooling-scientific-consensus/, accessed and archived on January 22, 2021.
Richard, K., 2020. Wild Horses And Mammoths Were Still Eating Grass Year-Round In The Arctic Until 2500-4000 Years Ago. NoTrickZone, August 31, 2020, https://notrickszone.com/2020/08/31/grass-fed-wild-horses-and-mammoths-lived-in-thearctic-until-2500-4000-years-ago-when-cooling-extirpated-them/, accessed and archived on December 1, 2020.
Richard, K., 2022. Cold Kills: Since 2000 There Were 85 Times More UK Excess Deaths Attributable To Cold Than Heat. July 21, https://notrickszone.com/2022/07/21/cold-kills-since-2000-there-were-85-times-more-uk-excess-deaths-attributable-tocold-than-heat/, accessed and archived on July 25, 2022.
Richards, D. and Boudnik, K., 2020. Neil Ferguson's Imperial model could be the most devastating software mistake of all time. https://www.telegraph.co.uk/technology/2020/05/16/neil-fergusons-imperial-model-could-devastating-software-mistake/, subscriber only, accessed May 2020.
Richardson, L. F., 1910. The approximate arithmetical solution by finite-differences of physical problems involving differential equations, with an aplication to the stresses in a masonry dam. Philosophical Transactions of the Royal Society of London. Series A, Containing Papers of a Mathematical or Physical Character, Vol. 210, doi: 10.1098/rsta.1911.0009
Richardson, L. F., 1922. Weather Prediction by Numerical Process. Cambridge University Press, London, Fetter Lane, E.C.4, 236 pp., https://ia802709.us.archive.org/4/items/weatherpredictio00richrich/weatherpredictio00richrich.pdf, accessed and archived on August 19, 2022.
Richardson, L. F., 1927. The deferred approach to the limit. Part I: Single lattice. Philosophical Transactions of the Royal Society, London, A226, p. 299–349, https://royalsocietypublishing.org/doi/pdf/10.1098/rsta.1927.0008
Richardson, V., 2018. Al Gore under fire for claiming icy storm is 'exactly what we should expect from climate crisis'. The Washington Times - Sunday, January 7, 2018. https://www.washingtontimes.com/news/2018/jan/7/al-gore-under-fire-climate-changeclaim-bomb-cyclo/, accessed and archived on October 14, 2020.
Richet, P., 2021. The temperature–CO2 climate connection: an epistemological reappraisal of ice-core messages. History of Geo- and Space Sciences, Vol. 12, p. 97-110, https://doi.org/10.5194/hgss-12-97-2021 and retracted further to censoring post publication by IPCC pressures from French WG group leaders https://hgss.copernicus.org/articles/12/97/2021/ Ridd, P., 2022. The Good News on Coral Reefs. The Global Warming Policiy Foundation, Note 33, 12 pp., https://www.thegwpf.org/content/uploads/2022/08/Ridd-Record-Coral-GBR.pdf, accessed and archived on August 6, 2022. Ridley, J. K., Huybrechts, P., Gregory, J. M., and Lowe, J. A., 2005. Elimination of the Greenland ice sheet in a high CO 2 climate. Journal of Climate, Vol. 18, Issue 17, p. 3409-3427, https://doi.org/10.1175/JCLI3482.1
Ridley, M., 2015. The Benefits of Carbon Dioxide, Global greening may save more lives and forests than warming costs. http://www.rationaloptimist.com/blog/the-benefits-of-carbon-dioxide/, accessed and archived on September 24, 2020.
Rignot, E., Mouginot, J., and Scheuchl, B., 2011. Ice Flow of the Antarctic Ice Sheet. Science, Vol. 333, Issue 6048, p.1427-1430, https://www.science.org/doi/10.1126/science.1208336
Riley, P., et al., 2015. Inferring the Structure of the Solar Corona and Inner Heliosphere during the Maunder Minimum using Global Thermodynamic Magnetohydrodynamic Simulations. The Astronomical Journal, Vol. 802, n°2, 14 pp., doi:10.1088/0004637X/802/2/105
Rimbu, N., Lohmann, G., Lorenz, S. J., Kim, J. H. and Schneider, R. R., 2004. Holocene climate variability as derived from alkenone seasurface temperature and coupled ocean-atmosphere model experiments. Climate Dynamics, Vol.23, p. 215-227, DOI: 10.1007/s00382-004-0435-8
Risebrobakken, B., Dokken, T., Smedsrud, L. H., Andersson, C., Jansen, E., Moros, M., and Ivanova, E. V., 2011. Early Holocene temperature variability in the Nordic Seas: The role of oceanic heat advection versus changes in orbital forcing. Paleoceanography, Vol. 26, Issue 4, PA4206, https://doi.org/10.1029/2011PA002117
Risso, V. A., et al. 2013. Hyperstability and substrate promiscuity in laboratory resurrections of Precambrian b-lactamases. Journal of the American Chemical Society, Vol. 135, Issue 8, p. 2899–2902, doi:10.1021/ja311630a
Ritchie, H., 2019. How many people die and how many are born each year? https://ourworldindata.org/births-and-deaths
Rittaud, B., 2010. Le mythe climatique. Seuil (ed.), Science ouverte, ISBN-13: 978-2021011326, 203 pp. Rittaud, B., 2015. La peur exponentielle. PUF, ISBN-13: 978-2130633693, 448 pp.
Robbins, L. L., Hansen, M. E., Kleypas, J.A., and Meylan, S.C., 2010. CO2calc: A User-Friendly Seawater Carbon Calculator for Windows, Mac OS X, and iOS (iPhone). Open-File Report 2010–1280, U.S. Department of the Interior, U.S. Geological Survey, 17 pp., https://pubs.usgs.gov/of/2010/1280/pdf/ofr_2010-1280.pdf
Robert, F., and Chaussidon, M., 2006. A palaeotemperature curve for the Precambrian oceans based on silicon isotopes in cherts. Nature, Vol. 443, Issue 7114, p. 969-972, DOI: 10.1038/nature05239
Robert, J.-H., 2019. Le principe de loyauté dans la recherche de la preuve dans le procès civil et le procès pénal. August 27, 2019, https://www.actualitesdudroit.fr/browse/penal/droit-penal-special/23390/le-principe-de-loyaute-dans-la-recherche-de-lapreuve-dans-le-proces-civil-et-le-proces-penal, accessed and archived on December 1, 2020.
Roberts, W. O., 1975. Climate change and its effect on world food. Science and Public Policy, Volume 2, Issue 6, pp. 264–266, https://doi.org/10.1093/spp/2.6.264
Roberts, N., et al., 2018. Europe’s lost forests: a pollen based synthesis for the last 11,000 years. Scientific Reports, Nature Publishing Group, 9 pp., DOI: 10.1038/s41598-017-18646-7
Robichaud, A., 2018. L’aérobiologie du pollen de bouleau (Betula spp.) : synergie avec les facteurs environnementaux et impacts sur les maladies respiratoires. Thèse présentée à la Faculté des études supérieures et postdoctorales en vue de l’obtention du grade de Philosophiæ Doctor (Ph. D.) en géographie physique. 361 pp., accessed and archived on March 5, 2021. https://papyrus.bib.umontreal.ca/xmlui/bitstream/handle/1866/21725/Robichaud_Alain_2018_these.pdf
Robinson, A. B, Robinson, N., E., Soon, W., 2007. Environmental Effects of Increased Atmospheric Carbon Dioxide. Journal of American Physicians and Surgeons, 12, p. 79-90. See the Petition Project, http://www.petitionproject.org/index.php, accessed on December 1, 2020.
Robock, A., and Mao, J., 1992. Winter warming from large volcanic eruptions. Geophysical Research Letters, Vol. 19, Issue 24, p.24052408, https://doi.org/10.1029/92GL02627
Robock, A. 2000. Volcanic eruptions and climate. Reviews of Geophysics, Vol. 38, Issue 2, p. 191-219, https://doi.org/10.1029/1998RG000054
Robock, A., 2002. Volcanic Eruptions. In: Encyclopedia of Global Environmental Change, Volume 1, The Earth system: physical and chemical dimensions of global environmental change, Ted Munn (ed.), p. 738-744. Roe, G., 2006. In defense of Milankovitch. Geophysical Research Letters, Vol. 33, Issue 24, L24703, 5 pp., https://doi.org/10.1029/2006GL027817
Rogin, J., 2021. In 2018, Diplomats Warned of Risky Coronavirus Experiments in a Wuhan Lab. Politico, August 3rd, 16 pp., https://www.politico.com/news/magazine/2021/03/08/josh-rogin-chaos-under-heaven-wuhan-lab-book-excerpt-474322
Rogozhina, I, et al., 2016. Melting at the base of the Greenland ice sheet explained by Iceland hotspot history. Nature Geoscience, Vol. 9, p. 366–369, https://doi.org/10.1038/ngeo2689
Rohling, E.J., et al., 2002. Holocene atmosphereocean interactions: record from Greenland and the Aegean Sea. Climate Dynamics, Vol. 18, p. 573-592, DOI: 10.1007/s00382-001-0194-8
Rohling, E. J., et al., 2012. Making sense of palaeoclimate sensitivity. Nature, Vol. 491, Issue 7426, p. 683-691, DOI: 10.1038/nature11574
Rollin, G., 2015. Chaos dynamique dans le problème à trois corps restreint. Thèse Physique / Astrophysique, Université de FrancheComté, 133 pp., https://hal.archives-ouvertes.fr/tel-01344435/file/these_A_ROLLIN_Guillaume_2015.pdf
Rombaut, B., 2010. Proxy versus model-proxy comparison: Holocene climate evolution of the North Atlantic Ocean. Master thesis, Ghent University, Faculty of Sciences, Geology and Soil Science, 122 pp., accessed and archived on July 24, 2020. https://archimer.ifremer.fr/doc/00505/61706/65675.pdf
Rondjeschagen, 2016. Former director of ECN enriched himself with turbines. January 23, 2016. https://www.rondjeschagen.nl/nw823-7-3609284/nieuws/oud-directeur_ecn_verrijkte_zich_aan_turbines.html, accessed and archived on February 12, 2021. Rose, D., 2017a. Exposed: How world leaders were duped into investing billions over manipulated global warming data. https://www.dailymail.co.uk/sciencetech/article-4192182/World-leaders-duped-manipulated-global-warming-data.html, accessed and archived on October 21, 2020.
Rose, D., 2017b. How can we trust global warming scientists if they keep twisting the truth. November 13, 2017, https://www.dailymail.co.uk/debate/article-4216180/How-trust-global-warming-scientists-asks-David-Rose.html, accessed on December 1, 2020.
Rosenblatt, M., 2015. Short Range and Long Range Dependence. Chapter in: Asymptotic Laws and Methods in Stochastics, Springer New York, p. 283-294.
Rosenthal, Y., Linsley, B., and Oppo, D. W., 2013. Pacific Ocean Heat Content During the Past 10,000 Years. Science, Vol. 342, Issue 6158, p. 617-621, DOI: 10.1126/science.1240837
Ross, J. C., 1847. A Voyage of Discovery and Research in the Southern Antarctic Regions, during the years 1839-43, Vol II, John Murray, London, https://doi.org/10.5962/bhl.title.98449
Rossiter, C. S., 2020. Equal Warming, 1900 to 1950 versus 1950 to 2018: Why the UN Knows the First Half was Natural. CO 2 COALITION, 3 pp., accessed and archived on June 30, 2020, http://co2coalition.org/wp-content/uploads/2020/04/CO2Coalition-Science-Policy-Brief_EqualWarming.pdf
Rothman, D. H., 2002. Atmospheric carbon dioxide levels for the last 500 million years. Proc. of the Natl. Acad. of Sci. of the U.S.A., Vol. 99, n°7, p. 4167-4171, https://doi.org/10.1073/pnas.022055499
Rousseau, D., 2009. Les températures mensuelles en région parisienne de 1676 à 2008. La Météorologie, n° 67, Novembre, p. 43-55, http://documents.irevues.inist.fr/bitstream/handle/2042/30038/meteo_2009_67_43.pdf, accessed and archived on November 13, 2020.
Roy, I., and Haigh, J.D., 2011. The influence of solar variability and the quasi-biennial oscillation on lower atmospheric temperatures and sea level pressure. Atmospheric Chemistry and Physics, Vol. 11, p. 11679-11687, doi: 10.5194/acp-11-11679-2011.
Roy, I., and Haigh, J. D., 2012. Solar Cycle Signals in the Pacific and the Issue of Timings. Journal of the Atmospheric Sciences, Vol. 69, Issue 4, p. 1446-1451, DOI: 10.1175/JAS-D-11-0277.1
Roy, I., 2014. The role of the sun in atmosphere-ocean coupling. International Journal of Climatology, Vol. 34, Issue 3, p. 655-677, doi:10.1002/joc.3713.
Roy, I., 2018a. Solar cyclic variability can modulate winter Arctic climate. Scientific Reports, Vol. 8, Article 4864, 15 pp., DOI: 10.1038/s41598-018-22854-0
Roy, I., 2018b. Addressing on Abrupt Global Warming, Warming Trend Slowdown and Related Features in Recent Decades. Frontiers in Earth Science, Vol. 6, Article 136, 19 pp., DOI: 10.3389/feart.2018.00136
Roy, I., 2020. Solar Signals in Observation Indeed Implied Enhanced Predictability Since 1977. Pure and Applied Geophysics, Vol. 177, p. 5483–5485, https://doi.org/10.1007/s00024-020-02564-3
Royer, D. L., et al., 2001. Paleobotanical Evidence for Near Present-Day Levels of Atmospheric CO 2 During Part of the Tertiary. Science, Vol. 292, Issue 5525, p. 2310-2313, DOI: 10.1126/science.292.5525.2310
Royer, D. L., 2014. Atmospheric CO2 and O2 during the Phanerozoic: Tools, patterns and impacts. In Treatise on Geochemistry, 2nd ed. Holland, H., Turekian, K., Eds., Elselvier: Amsterdam, The Netherlands, p. 251–267, http://dx.doi.org/10.1016/B978-0-08095975-7.01311-5, http://droyer.wescreates.wesleyan.edu/Royer_2014_Treatise.pdf
RSS, 2020. Atmospheric Water Vapor (total precipitable water). http://www.remss.com/measurements/atmospheric-water-vapor (they only report data which includes the latest month available, 201910 means thru October, 2019) http://data.remss.com/vapor/monthly_1deg/tpw_v07r01_198801_201910.time_series.txt, accessed and archived on December 10, 2020.
Rubin, M. J., and van Loon, H., 1954. Aspects of the Circulation of the Southern Hemisphere. Journal of Meteorology, Vol. 11, p. 6876, DOI: 10.1175/1520-0469(1954)011<0068:AOTCOT>2.0.CO;2
Rubino, M., et al., 2013. A revised 1000 year atmospheric δ13C‐CO2 record from Law Dome and South Pole, Antarctica. Journal of Geophysical Research: Atmospheres, Vol. 118, p. 8482-8499, DOI: 10.1002/jgrd.50668
Rubino, M., et al., 2019. Revised records of atmospheric trace gases CO2, CH4, N2O, and δ13C‐CO2 over the last 2000 years from Law Dome, Antarctica? Earth System Science Data, Vol. 11, p. 473–492, https://doi.org/10.5194/essd-11-473-2019
Rubino, A., Zanchettin, D., De Rovere, F., and M. J., McPhaden, 2020. On the interchangeability of sea-surface and near-surface air temperature anomalies in climatologies. Scientific Reports, Vol. 10, Article number: 7433, 8 pp., https://doi.org/10.1038/s41598-020-64167-1
Ruddiman, W.F., 2001. Earth’s Climate: Past and Future. First Edition, New York, NY: W.H. Freeman and Co., ISBN-13: 978-0-71678490-6, 388 pp.
Ruddiman, W. F., 2007. The early anthropogenic hypothesis: Challenges and responses. Reviews of Geophysics, Vol. 45, Issue 4, RG4001, 37 pp., https://doi.org/10.1029/2006RG000207
Ruddiman, W.F., 2008. Earth’s Climate: Past and Future. Second Edition, New York, NY: W.H. Freeman and Co., ISBN-13: 978-0-71678490-6, 388 pp., http://www.incline.iag.usp.br/data/disciplinaPOS/2016/0822_segunda-feira/tarde/Ruddiman%202nd.pdf Russell, H. N., 1928. On the determination of dynamical parallaxes. Astronomical Journal, vol.38, Issue 897, n°11, p. 89-99. Ryb, U., and Eiler, J. M., Oxygen isotope composition of the Phanerozoic ocean and a possible solution to the dolomite problem. Proc. of the Natl. Acad. of Sci. of the U.S.A., Vol. 115, n°26, p. 6602-6607, www.pnas.org/cgi/doi/10.1073/pnas.1719681115 Rysgaard, S., Bendtsen, J., Mortensen, J., and Sejr, M. K., 2018. High geothermal heat flux in proximity to the Northern Greenland ice stream. Nature, Scientific Reports, Vol. 8, Art. n°1344, https://www.nature.com/articles/s41598-018-19244-x
Sagan, C., and Mullen, G., 1972. Earth and Mars: Evolution of atmospheres and surface temperatures. Science, Vol. 177, p. 52–56, DOI: 10.1126/science.177.4043.52
Sagan, C., Toon O. B., and Pollack J. B., 1979. Anthropogenic Albedo Changes and the Earth's Climate. Science, vol. 206, n°4425, p. 1363-1368, DOI: 10.1126/science.206.4425.1363
Sagan, C., 1995-97. The Demon-Haunted World: Science as a Candle in the Dark. Random House, ISBN 0-7472-5156-8, 426 pp.
Sager, W. W., et al., 2013. An immense shield volcano within the Shatsky Rise oceanic plateau, northwest Pacific Ocean. Nature Geoscience, Vol. 6, p. 976-981, DOI:10.1038/NGEO1934
Sager, W. W., 2019. Do all oceanic plateau erupt at spreading ridges? The Geological Society of America, Vol. 51, No. 5, doi: 10.1130/abs/2019AM-335361
Sager, W. W., et al., 2019. Oceanic plateau formation by seaflorr spreading implied by Tamu Massif magnetic anomalies. Nature Geoscience, Vol. 12, p. 661-666, https://doi.org/10.1038/s41561-019-0390-y
Sager, W. W., Thoram, S., Engfer, D. W., Koppers, A. A. P., and Class, C., 2021. Late Cretaceous ridge reorganization, microplate formation, and the evolution of the Rio Grande Rise – Walvis Ridge hot spot twins, South Atlantic Ocean. Geochemistry, Geophysics, Geosystems, Vol. 22, e2020GC009390, 27 pp., https://doi.org/10.1029/2020GC009390
Saing, U. B., et al., 2020. First characterization of Gamkonora gas emission, North Maluku, East Indonesia. Bulletin of Volcanology, Vol. 82, n°5, DOI: 10.1007/s00445-020-01375-7
Saint-Lu, M., Bony, S., Dufresne, J.-L., 2020. Observational Evidence for a Stability Iris Effect in the Tropics. Geophysical Research Letters, Vol. 47, Issue 14, 10 pp., DOI: 10.1029/2020GL089059
Salamy, K. A., and Zachos, J. C., 1999. Latest Eocene-Early Oligocene climate change and Southern Ocean fertility: Inferences from sediment accumulation and stable isotope data. Palaeogeography Palaeoclimatology Palaeoecology, Vol. 145, p. 61-77, DOI: 10.1016/S0031-0182(98)00093-5
Salby, M. L., 1996. Fundamentals of Atmospheric Physics. This is Vol. 61 in the International Geophysics Series, R. Dmowska and J. R. Holton (Eds.), Academic Press, CA, USA, ISBN-13:978-0-12-615160-2, 624 pp. + illustrations.
Salby, M. L., 2012. Physics of the Atmosphere and Climate - 2nd Edition, Cambridge University Press, ISBN, 978-0-521-76718-7, 666pp. + illustrations, 718 pp., www.cambridge.org/9780521767187
Salby, M. L., and Harde, H., 2021a. Control of Atmospheric CO2: Part I: Relation of Carbon 14 to the Removal of CO2. Science of Climate Change, International Journal of Science and Philosophy, Vol. 1, n°2, pp. N1 1-36, https://doi.org/10.53234/scc202112/210
Salby, M. L., and Harde, H., 2021b. Control of Atmospheric CO2: Part II: Influence of Tropical Warming. Science of Climate Change, International Journal of Science and Philosophy, Vol. 1, n°2, pp. N2 1-29, https://doi.org/10.53234/scc202112/211
Salinger, M. J., and Gunn, J. M., 1975. Recent climate warming around New Zealand. Nature, Vol. 256, Issue 5516, p. 396-398, https://www.nature.com/articles/256396a0, DOI: 10.1038/256396a0
Salinger, M. J., 1981. Site Assessments on Climatological Stations. Appendix C in: “New Zealand Climate: The instrumental record”. Thesis submitted for the degree of Doctor of Philosophy at the Victoria University of Wellington, January 1981.
Salstein, D. A., 2015. Angular Momentum of the Atmosphere. In Encyclopedia of Atmospheric Sciences (2nd Ed.). G.R. North, J. Pyle, F. Zhang (eds.), Elsevier. Vol. 2, p. 43-50.
Saltzman, B., 1962. Finite Amplitude Free Convection as an Initial Value Problem-I. Journal of the Atmospheric Sciences, Vol. 19, p. 329-341, https://doi.org/10.1175/1520-0469(1962)019<0329:FAFCAA>2.0.CO;2
Saltzman, E. S., et al., 1999. 420,000 years of climate and atmospheric history revealed by the Vostok deep Antarctic ice core. Nature, Vol. 399, p. 429-436, DOI: 10.1038/20859
Sánchez-Lavega, A. , 2011. An Introduction to Planetary Atmospheres. CRC Press, Taylor & Francis Group, ISBN-13: 978-1-4200-67354 (Ebook-PDF) 587 pp, accessed and archived on March 13, 2021.
Sandakly, F., Garcia, J., Ferreira, P., and Poyet, P., 2001. Distributed shared memory infrastructure for virtual enterprise in building and construction. Journal of Intelligent manufacturing, Vol. 12, Issue 2, p. 199-212, DOI: 10.1023/A:1011208828486
Sander, R., 2015. Compilation of Henry’s law constants (version 4.0) for water as solvent. Atmospheric Chemistry and Physics, Vol. 15, p. 4399–4981, DOI: 10.5194/acp-15-4399-2015
Sandweiss, D. H., et al., 2020. Archaeological climate proxies and the complexities of reconstructing Holocene El Niño in coastal Peru. Proc. of the Natl. Acad. of Sci. of the U.S.A., Vol. 117, n°15, p. 8271-8279, https://doi.org/10.1073/pnas.1912242117
Santer, B. D., et al., 1995. Towards the detection and attribution of an anthropogenic effect on climate. Climate Dynamics, Vol. 12, p. 77-100, https://doi.org/10.1007/BF00223722
Santer, B. D., et al. 2005. Amplification of surface temperature trends and variability in the tropical atmosphere. Science, Vol. 309, Issue 5740, p. 1551–1556, DOI: 10.1126/science.1114867
Santer, B. D., et al., 2014. Volcanic contribution to decadal changes in tropospheric temperature. Nature Geoscience, Vol. 7, n°3, 5 pp., DOI: 10.1038/NGEO2098
Santer, B. D., et al., 2017. Comparing Tropospheric Warming in Climate Models and Satellite Data. Journal of Climate, Vol. 30, Issue 1, p. 373-392, https://doi.org/10.1175/JCLI-D-16-0333.1
Sarnthein, M., et al., 1994. Changes in east Atlantic deepwater circulation over the last 30,000 years: Eight time slice reconstructions. Paleoceanography and Paleoclimatology, Vol. 9, Issue 2, p. 209-267, https://doi.org/10.1029/93PA03301
Sarnthein, M., et al., 1995. Variations in Atlantic surface ocean paleoceanography, 50°-80°N: A time-slice record of the last 30,000 years. Paleoceanography, Vol. 10, Issue 6, p. 1063-1094, https://doi.org/10.1029/95PA01453
Sato, K., 2008. Scaling of soaring seabirds and its implication for themaximum size of flying pterosaurs. Nature Precidings, https://doi.org/10.1038/npre.2008.2605.1
Sato, K., et al., 2009. Scaling of Soaring Seabirds and Implications for FlightAbilities of Giant Pterosaurs. PLoS ONE, Vol. 4, Issue 4, Article e5400. doi:10.1371/journal.pone.0005400
Satterthwaite, D., 2006. Barbara Ward and the Origins of Sustainable Development, 76 pp., https://pubs.iied.org/sites/default/files/pdfs/migrate/11500IIED.pdf, accessed and archived on July 22, 2022.
Saussure de, H.-B., 1779-1796. Voyages dans les Alpes, précédés d'un essai sur l'histoire naturelle des environs de Genève. Samuel Fauche (Ed.) Neuchâtel, 4 Tomes, https://doi.org/10.3931/e-rara-8487, pdf files available at https://www.erara.ch/zut/content/titleinfo/2266563, accessed on January 11, 2021.
Sawyer, J. S., 1972. Man-made Carbon Dioxide and the "Greenhouse" Effect. Nature, Vol. 239, p. 23-26, https://doi.org/10.1038/239023a0
Scafetta, N., 2007. Testing an astronomically-based decadal-scale empirical harmonic climate model versus the IPCC (2007) general circulation climate models. Journal of Atmospheric and Solar-Terrestrial Physics, Vol. 80, 67 pp., DOI: 10.1016/j.jastp.2011.12.005
Scafetta, 2010. Empirical evidence for a celestial origin of the climate oscillations and its implications. Journal of Atmospheric and Solar-Terrestrial Physics, Volume 72, Issue 13, p. 951-970. https://doi.org/10.1016/j.jastp.2010.04.015
Scafetta, N., 2012. Testing an astronomically-based decadal-scale empirical harmonic climate model versus the IPCC (2007) general circulation climate models. Journal of Atmospheric and Solar-Terrestrial Physics, Vol. 80, 67 pp., DOI: 10.1016/j.jastp.2011.12.005
Scafetta, N., and Willson, R.C., 2013. Planetary harmonics in the historical Hungarian aurora record (1523-1960). Planetary and Space Science, Vol. 78, p. 38-44, DOI: 10.1016/j.pss.2013.01.005
Scafetta, N., 2014. The complex planetary synchronization structure of the solar system. Pattern Recognition in Physics, Vol. 2, p. 1–19, DOI: 10.5194/prp-2-1-2014
Scafetta, N., and Willson, R. C., 2014. ACRIM total solar irradiance satellite composite validation versus TSI proxy models. Astrophysics and Space Science, Vol. 350, 22 pp., DOI: 10.1007/s10509-013-1775-9
Scafetta, N., Mirandola, A., and Bianchini, A., 2017a. Natural climate variability, part 1: Observations versus the modeled predictions. International Journal of Heat and Technology, Vol. 35, Special Issue1, pp. S9-S17, DOI: 10.18280/ijht.35Sp0102
Scafetta, N., Mirandola, A., and Bianchini, A., 2017b. Natural climate variability, part2: Interpretation of the post 2000 temperature standstill. International Journal of Heat and Technology, Vol. 35, Special Issue1, pp. S18-S26, DOI: 10.18280/ijht.35Sp0103
Scafetta, N., 2019. On the Reliability of Computer-Based Climate Models. Italian Journal of Engineering Geology and Environment, Vol. 1, p. 49-70, DOI: 10.4408/IJEGE.2019-01.O-05
Scafetta, N., Willson, R. C., Lee, J. N., and Wu, D. L., 2019. Modeling Quiet Solar Luminosity Variability from TSI Satellite Measurements and Proxy Models during 1980-2018. Remote Sensing, Vol. 11, Issue 21, Article 2569, 27 pp., DOI: 10.3390/rs11212569
Scafetta, N., 2020. Solar Oscillations and the Orbital Invariant Inequalities of the Solar System. Solar Physics, Vol. 295, n°2, 20 p., DOI: 10.1007/s11207-020-01599-y
Scafetta, N., 2021a. Detection of non‐climatic biases in land surface temperature records by comparing climatic data and their model simulations. Climate Dynamics, 24 pp., https://doi.org/10.1007/s00382-021-05626-x
Scafetta, N., 2021b. Reconstruction of the Interannual to Millennial Scale Patterns of the Global Surface Temperature. Atmosphere, Vol. 12, Issue 2, 147, 36 pp., https://doi.org/10.3390/atmos12020147
Scafetta, N., 2021c. Testing the CMIP6 GCM Simulations versus Surface Temperature Records from 1980–1990 to 2011–2021: High ECS Is Not Supported. Climate, Vol. 9, 161, 30 pp., https://doi.org/10.3390/cli9110161
Shellenberger, M., 2018. A question that gives pause: If Solar And Wind Are So Cheap, Why Are They Making Electricity So Expensive? WUWT, May 16, 2018, https://wattsupwiththat.com/2018/05/16/a-question-that-gives-pause-if-solar-and-windare-so-cheap-why-are-they-making-electricity-so-expensive/, accessed and archived on December 1, 2020.
Shellenberger, M., 2022. Sri Lanka Just Fell. What Do We Have to Do With It? July 12, https://www.commonsense.news/p/sri-lankajust-fell-what-do-we-have, accessed and archived on July 13, 2022.
Schafer, C. T., 2018. Perspective on warm climate intervals and their history: How might coastal Canada adapt to an ocean-related and potentially negative impact of predicted warmer conditions? Proceedings of the Nova Scotian Institute of Science (NSIS), Vol. 49, Part 2, p. 205-228, DOI: 10.15273/pnsis.v49i2.8160
Schildknecht, D., 2020. Saturation of the infrared absorption by carbon dioxide in the atmosphere. International Journal of Modern Physics B, Volume 34, Issue 30, 26 pp., DOI: 10.1142/S0217979220502938, https://arxiv.org/pdf/2004.00708.pdf
Schimel, D., et al., 1996. Radiative forcing of climate change. In: IPCC's Climate Change 1995: The Science of Climate Change, edited by J. T. Houghton et al., Cambridge Univ. Press, New York. Chap. 2, p. 65 – 131.
Schimel, D., Stephens, B. B., and Fisher, J. B., 2015. Effect of increasing CO 2 on the terrestrial carbon cycle. Proc. of the Natl. Acad. of Sci. of the U.S.A., Vol. 112, Issue 2, p. 436-441, https://doi.org/10.1073/pnas.1407302112
Schlatter, T. W., 2010. Vertical Structure of the Atmosphere. Encyclopedia of Aerospace Engineering, https://doi.org/10.1002/9780470686652.eae582
Schmidt, G., 2019. Sensitive But Unclassified. realclimate.org, Nov 6, 2019 https://www.realclimate.org/index.php/archives/2019/11/sensitive-but-unclassified/, accessed and archived on August 22, 2022.
Schmithüsen, H., Notholt, J., König‐Langlo, G., Lemke, P., and Jung, T., 2015. How increasing CO2 leads to an increased negative greenhouse effect in Antarctica. Geophysical Research Letters, Vol. 42, Issue 23, p. 10,422 - 10,428, https://doi.org/10.1002/2015GL066749
Schmitt, H., 2008. Former NASA Advisory Council Chair Jack Schmitt Quits Planetary Society. 14 Nov. 2008, http://www.spaceref.com/news/viewsr.html?pid=29813
Schmitz, B., et al., 2019. An extraterrestrial trigger for the mid-Ordovician ice age: Dust from the breakup of the L-chondrite parent body. Science Advances, Vol. 5, no. 9, eaax4184, DOI: 10.1126/sciadv.aax4184
Schneider, S. H., 1989. The Greenhouse Effect Science and Policy. Science, Vol. 243, Issue 4892, p. 771-781, DOI: 10.1126/science.243.4892.771
Schneider, D.P., et al. 2006. Antarctic temperatures over the past two centuries from ice cores. Geophysical Research Letters, Vol. 33, Issue 16, L16707, L16707, 5 pp, https://doi.org/10.1029/2006GL027057
Schofield, J. E., et al., 2019. Pushing the Limits- Palynological Investigations at the Margin of the Greenland Ice Sheet in the Norse Western Settlement. Environmental Archaeology, The Journal of Human Palaeoecology, Special Issue: Environmental challenges for the Medieval North Atlantic world, Vol. 27, Issue 2, p. 228-242, DOI: 10.1080/14614103.2019.1677075
Schoonover, R., 2019. The White House Blocked My Report on Climate Change and National Security. https://www.nytimes.com/2019/07/30/opinion/trump-climate-change.html 731, accessed and archived on December 1, 2020.
Schrijver de, E., et al., 2022. Nationwide Analysis of the Heat- and Cold-Related Mortality Trends in Switzerland between 1969 and 2017: The Role of Population Aging. Environmental Health Perspectives, Vol. 130, Issue 3, p. 037001-1 - 037001-9, https://doi.org/10.1289/EHP9835
Schroeder, D. M., Blankenship, D. D., Young, D. A., and Quartini, E., 2014. Evidence for elevated and spatially variable geothermal flux beneath the West Antarctic Ice Sheet. Proc. of the Natl. Acad. of Sci. of the U.S.A., Vol. 111, no. 25, p. 9070-9072, www.pnas.org/cgi/doi/10.1073/pnas.1405184111
Schroeder, E., 2021. FAO forecasts record wheat production in 2021. World-Grain.com, May 3, 2021, https://www.worldgrain.com/articles/14970-fao-forecasts-record-wheat-production-in-2021
Schuckmann von, K., and Le Traon, P.-Y., 2011. How well can we derive Global Ocean Indicators from Argo data? Ocean Science Discussions, Vol. 8, p. 999-1024, DOI: 10.5194/osd-8-999-2011
Schulze-Makuch, D., Heller, R. and Guinan, E., 2020. In Search for a Planet Better than Earth: Top Contenders for a Superhabitable World. Astrobiology, Vol. 20, n°12, 11 pp., DOI: 10.1089/ast.2019.2161
Schurer, A. P., et al., 2013. Separating forced from chaotic climate variability over the past millennium. Journal of Climate, Vol. 26, p. 6954-6973, DOI: 10.1175/JCLI-D-12-00826.1
Schwartz, S. E., 2007. Heat Capacity, Time Constant, and Sensitivity of Earth’s Climate System. Journal of Geophysical Research, Atmosphere, Vol. 112, D24S05, https://doi.org/10.1029/2007JD008746
Schwartz, J., 2015. Lawmakers Seek Information on Funding for Climate Change Critics. The New York Times, https://www.nytimes.com/2015/02/26/science/lawmakers-seek-information-on-funding-for-climate-change-critics.html, accessed and archived on October 7, 2020.
Schwarzacher, W., 1964. An application of statistical time-series analysis of a limestone-shale sequence. The Journal of Geology, Vol. 72, n°2, p. 195-213, https://doi.org/10.1086/626976
Schwarzacher, W., 1993. Milankovitch cycles in the pre-Pleistocene stratigraphic record; a review. In Hailwood, E.A., and Kidd, RB. (eds.), High Resolution Stratigraphy. Geological Society Special Publications 70, p. 187-194
Scotese, C. R., 2001. Atlas of Earth History. Volume 1, PaleogeographyPublisher: PALEOMAP Project, Arlington, TX, 58 pp.ISBN: 09700020-0-9
Scotese, C. R., 2003. Paleomap Project. http://www.scotese.com/Default.htm
Scotese, C. R., and Wright, N., 2018. PALEOMAP Paleodigital Elevation Models (PaleoDEMS) for the Phanerozoic PALEOMAP Project, https://www.earthbyte.org/paleodem-resourcescotese-and-wright-2018/, accessed and archived on August 28, 2020. Scott, W., Gardner, C., Alvarez, A., and Devoli, G., 2006. A.D. 1835 Eruption of Volcán Cosigüina, Nicaragua: A Guide for Assessing Hazards. USGS, GSA Special Papers, Vol. 412, p. 167-187, DOI: 10.1130/2006.2412(09)
Scott, M., 2020a. Understanding climate: Antarctic sea ice extent. NOAA Climate.gov science & information for a climate-smart nation, 7 pp., Climate.gov, April 28, 2020, https://www.climate.gov/news-features/understanding-climate/understandingclimate-antarctic-sea-ice-extent, accessed and archived on December 1, 2020.
Scott, M., 2020b. Unexceptional Arctic sea ice maximum in 2020. NOAA Climate.gov science & information for a climate-smart nation, 4 pp., Climate.gov, March 24, 2020 https://www.climate.gov/news-features/featured-images/unexceptional-arcticsea-ice-maximum-2020, accessed and archived on December 1, 2020. SCOTUS, 2022. West Virginia v. EPA-20-1530_n758, 89 pp., https://www.supremecourt.gov/opinions/21pdf/20-1530_n758.pdf, accessed and archived on July 8, 2022.
Scripps, 2020. Primary Mauna Loa CO2 Record, Mauna Loa Observatory - Hawaii (19.5°N, 155.6°W), 3397m, https://scrippsco2.ucsd.edu/data/atmospheric_co2/primary_mlo_co2_record.html, https://scrippsco2.ucsd.edu/assets/data/atmospheric/stations/in_situ_co2/monthly/monthly_in_situ_co2_mlo.csv, accessed and archived on December 1, 2020.
Segalstad, T., 1998. Carbon cycle modelling and the residence time of natural and anthropogenic atmospheric CO 2: on the construction of the "Greenhouse Effect Global Warming" dogma. In: Bate, R. (Ed.): “Global Warming: The Continuing Debate", European Science and Environment Forum (ESEF), Cambridge, England (ISBN 0-9527734-2-2), p. 184-219, https://www.researchgate.net/publication/237706208
Seitz, F., 1996. A major deception on 'global warming'. Wall Street Journal, New York, Jun 12, 1996 https://stephenschneider.stanford.edu/Publications/PDF_Papers/WSJ_June12.pdf, accessed and archived on July 7, 2020. Sellar, A. A., et al., 2019. UKESM1: Description and Evaluation of the U.K. Earth System Model. Journal of Advances in Modeling Earth Systems, Vol. 11, Issue 12, p. 4513-4558, http://dx.doi.org/10.1029/2019MS001739
731The nytimes paper shows: A local fisherman on what was once Lake Atescatempa, which dried up because of drought and high temperatures, in Guatemala, in 2017. The choice of the picture is pure bad faith, as the geographic location of the lake leaves it uniquely susceptible to the cyclical weather pattern known as El Niño; other human activity, from resource extration to agricultural malpractice, could also be to blame. Letting people imagine that a 0.01% increase of CO2 could be the explanation is simply fake journalism.
Semi, P. A., 2009. Orbital resonance and Solar cycles. https://arxiv.org/ftp/arxiv/papers/0903/0903.5009.pdf, accessed and archived on Auguest 6, 2022.
SEP, 2020. Paul Feyerabend. Stanford Encyclopedia of Philosophy. https://plato.stanford.edu/entries/feyerabend/, accessed and archived on February 24, 2021.
SEPP, 2017. SEPP weekly newsletter, Oct 21, 20 pp. http://www.sepp.org/twtwfiles/2017/TWTW10-21-17.pdf, accessed and archived on December 1, 2020.
Serreze, M. C., and Francis, J. A., 2006. The arctic amplification debate. Climatic Change, Vol. 76, p. 241–264, DOI: 10.1007/s10584005-9017-y
Severinghaus, J. P., and Brook, E. J., 1999. Abrupt climate change at the end of the last glacial period inferred from trapped air in polar ice. Science, vol. 286, p. 930-934, DOI: 10.1126/science.286.5441.930
Severinghaus, J., 2004. What does the lag of CO2 behind temperature in ice cores tell us about global warming?. http://www.realclimate.org/index.php/archives/2004/12/co2-in-ice-cores/ accessed and archived May 24, 2020.
Shakun, J.D., et al. 2012. Global warming preceded by increasing carbon dioxide concentrations during the last deglaciation. Nature, Vol. 484, Issue 7392, p. 49-54, DOI: 10.1038/nature10915
Shanahan, T. M., et al., 2015. The time-transgressive termination of the African Humid Period. Nature Geoscience. Vol.8, (2), p.140–144, DOI: 10.1038/NGEO2329
Shapiro, A. I., et al., 2011. A new approach to the long-term reconstruction of the solar irradiance leads to large historical solar forcing. Astronomy & Astrophysics, Vol. 529, Article A69, 8 pp., DOI: 10.1051/0004-6361/201016173
Sharapova, A., et al., 2008. Lateglacial and Holocene terrestrial and marine proxies reflecting climate changes in the Malangen fjord area, Norway, northeast North Atlantic. Boreas, Vol. 37, n°3, p. 444-457, DOI: 10.1111/j.1502-3885.2008.00029.x
Shaviv, N. J., 2002. Cosmic Ray Diffusion from the Galactic Spiral Arms, Iron Meteorites, and a Possible Climatic Connection. Physical Review Letters, Vol. 89, Issue 5, 051102, 4 pp., DOI: 10.1103/PhysRevLett.89.051102
Shaviv, N. J., 2003. The Spiral Structure of the Milky Way, Cosmic Rays, and Ice Age Epochs on Earth. New Astronomy, Vol. 8, n°1, p.39-77. DOI: 10.1016/S1384-1076(02)00193-8
Shaviv, N.J., and Veizer, J., 2003. Celestial driver of Phanerozoic climate? GSA TODAY, v. 13/7, p. 4-10.
Shaviv, N. J., 2005. On climate response to changes in the cosmic ray flux and radiative budget. Journal of Geophysical Research: Space Physics, Vol. 110, Issue A8, Article: A08105, 15 pp., https://doi.org/10.1029/2004JA010866
Shaviv, N. J., 2008. Using the oceans as a calorimeter to quantify the solar radiative forcing. Journal of Geophysical Research (Space Physics), Vol. 113, Issue A11, 9 pp., DOI: 10.1029/2007JA012989
Shellenberger, M., 2020a. On Behalf Of Environmentalists, I Apologize For The Climate Scare. http://environmentalprogress.org/bignews/2020/6/29/on-behalf-of-environmentalists-i-apologize-for-the-climate-scare, accessed and archived on June 30, 2020. Shellenberger, M., 2020b. Apocalypse Never: Why Environmental Alarmism Hurts Us All. Harper Publisher, ISBN 978-0063001695, 432 pp.
Shepherd, S. J., Zharkov, S. I., Zharkova, V. V., 2014. Prediction of Solar Activity from Solar Background Magnetic Field Variations in Cycles 21-23. The Astrophysical Journal, Vol. 795, Issue 1, article id. 46, 8 pp, doi: 10.1088/0004-637X/795/1/46
Sherwood, S. C., et al., 2020. An assessment of Earth's Climate Sensitivity Using Multiple Lines of Evidence. Reviews of Geophysics, Vol. 58, Issue 4, Article: e2019RG000678, https://doi.org/10.1029/2019RG000678
Shi, F., et al., 2013. Northern Hemisphere temperature reconstruction during the last millennium using multiple annual proxies. Climate Research, Vol. 56, p. 231-244, DOI: 10.3354/cr01156
Shin, Y., and Schmidt, P., 1992. The KPSS stationarity test as a unit root test. Economics Letters, Vol. 38, p. 387-392, https://doi.org/10.1016/0165-1765(92)90023-R
Shindell, D., et al., 1999. Solar cycle variability, ozone and climate. Science, Vol. 284, Issue 5412, p. 305–308, DOI: 10.1126/science.284.5412.305
Shoemaker, E. M., and Shoemaker, C. S., 1990. The collision of solid bodies. In: The New Solar System, Chapter 21, Cambridge University Press, p. 259-274.
Shoji, H. and Langway C.C. Jr., 1983. Volume relaxation of air inclusions in a fresh ice core. Journal of Physical Chemistry, Vol. 87, n°21, p. 4111-4114, DOI: 10.1021/j100244a600
Shoji, H. and Langway C.C. Jr., 1987. Microscopic Observations of the Air Hydrate-Bubble, Transformation process in Glacier Ice. Journal de Physique, Colloque C1, Tome 48, p. C1-551-C1-556, DOI: ff10.1051/jphyscol:1987175ff
Shortt, Cmdr. J., 1885. Summary of Observations on Earthquake Phenomena Made in Tasmania During 1883 and 1884. Royal Society of Tasmania papers, State Library of Tasmania, Launceston, p. 263-270, https://eprints.utas.edu.au/15617/1/shorttobservations-earthquake-1884.pdf, accessed and archived on November 19, 2020.
Shturmakov, A., J., et al., 2007. A new 122 mm electromechanical drill for deep ice-sheet coring (DISC): 1. Design concepts. Annals of Glaciology, Vol. 47, p. 28-34, https://doi.org/10.3189/172756407786857811
Sidiropoulos, M., 2019a. Demarcation Aspects of Global Warming Theory. https://www.researchgate.net/, DOI: 10.13140/RG.2.2.28048.46086
Sidiropoulos, M., 2019b. Climate Science: Simulations of the combined effect of long solar cycles and multidecadal ocean oscillations. https://www.researchgate.net/, DOI: 10.13140/RG.2.2.20793.62566
Siegenthaler, U., and Joos, F., 1992. Use of a simple model for studying oceanic tracer distributions and the global carbon cycle. Tellus B, Chemical and Physical Meteorology, 44:3, p. 186-207, https://doi.org/10.3402/tellusb.v44i3.15441
Sigl, M. et al., 2015a. Timing and climate forcing of volcanic eruptions for the past 2,500 years. Nature, Vol. 523, Issue 7562, p. 543–549, https://doi.org/10.1038/nature14565
Sigl, M. et al., 2015b. The history of volcanic eruptions since Roman times. Pages Magazine, Vol. 23, n°2, p. 48-49. http://www.pastglobalchanges.org/download/docs/magazine/2015-2/PAGESmagazine_2015(2)_48-49_Sigl.pdf
Sigl, M., et al. 2016. The WAIS Divide deep ice core WD2014 chronology – Part 2: Annual-layer counting (0–31 ka BP). Climate of the Past, Vol. 12, p. 769–786, https://doi.org/10.5194/cp-12-769-2016, https://cp.copernicus.org/articles/12/769/2016/cp-12-769-2016.pdf
Sigl, M., Abram, N. J., Gabrieli, J., Jenk, T. M., Osmont, D., and Schwikowski, M., 2018. 19th century glacier retreat in the Alps preceded the emergence of industrial black carbon deposition on high-alpine glaciers. The Cryosphere, 12, p. 3311-3331, https://doi.org/10.5194/tc-12-3311-2018
Sigrist, R., 1993. Le capteur solaire de Horace-Bénédict de Saussure, Genèse d'une science empirique. Editions Passé-Présent / Librairie Jullien, ISBN 2-940014-04-3, 112 pp., accessed and archived on January 11, 2021. https://www.academia.edu/392404/Le_capteur_solaire_de_Horace_Bénédict_de_Saussure_Genèse_dune_science_empiriq ue_Genève_Passé_Présent_Jullien_1993
Sillen, L. G., 1961. Physical chemistry of sea water. In “Oceanography”; Sears, M., (ed.), American Association for the Advancement of Sciences Publication 67, Washington, D.C., p. 549-581.
Sillen, L. G., 1967. The ocean as a chemical system Science, Vol. 156, Issue 3779, p. 1189-1197, DOI: 10.1126/science.156.3779.1189
Sillmann, J., et al., 2017. Understanding, modeling and predicting weather and climate extremes- Challenges and opportunities. Weather and Climate Extremes, Vol. 18, p. 65-74, https://doi.org/10.1016/j.wace.2017.10.003
Silverman, J., Lazar, B., Cao, B., Caldeira, K., and Erez, J., 2009. Coral reefs may start dissolving when atmospheric CO 2 doubles. Geophysical Research Letters, Vol. 36, L05606, 5 pp., DOI: 10.1029/2008GL036282
Simmons, N. B., Seymour, K. L., Habersetzer, J., and Gunnell, G. F., 2008. Primitive Early Eocene bat from Wyoming and the evolution of flight and echolocation. Nature, Vol. 451, Issue 7180, p. 818-821, DOI: 10.1038/nature06549
Simpson, I., Blackburn, M., and Haigh, J. D., 2009. The Role of Eddies in Driving the Tropospheric Response to Stratospheric Heating Perturbations. Journal of the Atmospheric Sciences, Vol. 66, n°5, p. 1347-1365, DOI: 10.1175/2008JAS2758.1
Singer, S. F., 1970. Global effects of environmental pollution. EOS: Earth and Space Science News, Vol. 51, Issue 5, p. 476–478, https://doi.org/10.1029/EO051i005p00476
Singer, S. F., Revelle, R., and Starr, C., 1991. What to do about Greenhouse Warming: Look Before You Leap. Cosmos 1, p.28-33. Singer, S. F., Revelle, R., and Starr, C., 1993. What to do about Greenhouse Warming: Look Before You Leap. A global warming forum: Scientific, economic, and legal overview, p. 347-355; Book, Geyer, R.A. (ed.); 662 p., CRC Press, Inc. Boca Raton, FL, USA. Singer, S. F., 2003. The Revelle-Gore Story Attempted Political Suppression of Science. In: Politicizing Science: The Alchemy of Policymaking edited by Michael Gough, Hoover Institution 313 pp., p. 283-297, accessed and archived on May 17, 2020. Singer, S. F., et al., 2008. Nature, Not Human Activity, Rules the Climate. Published by the Heartland Institute, 40 pp., https://www.heartland.org/_template-assets/documents/publications/22835.pdf, accessed and archived on December 1, 2020.
Singer, S. F., 2012. Climate Deniers Are Giving Us Skeptics a Bad Name. Independent Institute, February 29, 2012, https://www.independent.org/news/article.asp?id=3263, accessed and archived on December 20, 2020.
Singh, H. A., and Polvani, L. M., 2020. Low Antarctic continental climate sensitivity due to high ice sheet orography. npj Climate and Atmospheric Science, Vol. 3, Issue 39, 10 pp., https://doi.org/10.1038/s41612-020-00143-w
Six, D., Reynaud, L. and Letréguilly, A., 2001. Bilan de masse des glaciers alpins et scandinaves, leurs relations avec l’oscillation du climat de l’Atlantique Nord. C. R. Acad. Sci. Paris, Earth and Planetary Sciences, 333, p. 693-698, DOI: 10.1016/S12518050(01)01697-4
Sleeper, H. P., Jr., 1972. Planetary Resonances, Bi-Stable Oscillation Modes and Solar Activity Cycles. NASA Report n°CR-2035, April 1972, George C. Marshall Space Flight Center, AeroAstrodynamics Laboratory, under Contract NAS8-21810, Northrop Services, Inc., https://www.aipro.info/wp/wp-content/uploads/2017/08/PLANETARY_-RESONANCES.pdf
Sloan, E. D., 1998. Clathrate Hydrates of Natural Gases, 2nd ed., Revised and Expanded. CRC Press, 2 edition, ISBN-13: 9780824799373, 705 pp.
Slocum, G., 1955. Has the amount of carbon dioxide in the atmosphere changed significantly since the beginning of the twentieth century? Monthly Weather Review, October, p. 225-231, http://www.pensee-unique.fr/001_mwr-083-10-0225.pdf
Slocum, A. H., and Haji, M. N., 2017. Extraction of Uranium from Seawater: Design and Testing of a Symbiotic System. Project No. 146557, Massachusetts Institute of Technology, Nuclear Energy University Programs, U.S. Department of Energy, 147 pp., https://www.osti.gov/servlets/purl/1423067/
Smagorinsky, J., Manabe, S., and Holloway Jr., J. L., 1965. Numeric Results From a Nine-Level General Circulation Model of the Atmosphere. Monthly Weather Review, vol. 93, No. 12, p. 727-768, https://doi.org/10.1175/15200493(1965)093<0727:NRFANL>2.3.CO;2, https://www.gfdl.noaa.gov/bibliography/related_files/sm6503.pdf
Smagorinsky, J., 1983. The beginnings of Numerical Weather Prediction and General Circulation Modeling: Early Recollections. Advances in geophysics, Vol. 25, p. 3-37, https://doi.org/10.1016/S0065-2687(08)60170-3
Smil, V., 2022. How the World Really Works : A Scientist's Guide to Our Past, Present and Future. Penguin Books Ltd, London (UK), ISBN13 9780241454404, 336 pp.,
Smirnov, B. M., 2018. Collision and radiative processes in emission of atmospheric carbon dioxide. Journal of Physics D Applied Physics, Vol. 51, Issue 21, DOI: 10.1088/1361-6463/aabac6
Smirnov, B. M., 2020. Atmospheric carbon dioxide and climate. Journal of Atmospheric Science Research, Vol. 2, Issue 4, p. 21-27, DOI: 10.30564/jasr.v2i4.1838
Smith, A., 1776. An Inquiry into the Nature and Causes of the Wealth of Nations. Smith’s fifth edition of the book (1789) is the final edition in Smith’s lifetime. https://www.adamsmith.org/the-wealth-of-nations
Smith, R., 2006. Peer review: a flawed process at the heart of science and journals. Journal of the Royal Society of Medicine, Vol. 99, Issue 4, p. 178–182, doi: 10.1258/jrsm.99.4.178, https://www.ncbi.nlm.nih.gov/pmc/articles/PMC1420798/
Smith, E. I., Jacobs, Z., Johnsen, R., Ren, M., Fisher, E. C., Oestmo, S., Wilkins, J., Harris, J. A., Karkanas, P., Fitch, S., Ciravolo, A., Keenan, D., Cleghorn, N., Lane, C. S., Matthews, T., and Marean, C. W., 2018. Humans thrived in South Africa through the Toba eruption about 74,000 years ago. Nature, Vol. 555, Issue 7697, p. 511-515, http://dx.doi.org/10.1038/nature25967
Sneath, P. H. A., 1970. Planets and Life. Thames & Hudson Ltd, ISBN-13: 978-0500100042, (French translation by François de Closets), 216 pp.
Snider, L., 2016. 40 Earths: NCAR's Large Ensemble Reveals Staggering Climate Variability. NCAR & UCAR News, September 28, 2016, https://news.ucar.edu/123108/40-earths-ncars-large-ensemble-reveals-staggering-climate-variability, accessed and archived on December 1, 2020.
Snow, C. P., 1959. The Two Cultures and the Scientific Revolution. Rede Lecture, and Cambridge University Press, New York, 1961, 58 pp. http://sciencepolicy.colorado.edu/students/envs_5110/snow_1959.pdf, accessed and archived on July 12, 2022.
Snow, D., 2015. Fire From Heaven: Climate Science And The Element Of Life--Part One, Fire By Day. October 29, 2015, https://hubpages.com/education/Fire-From-Heaven-Climate-Science-And-The-Element-Of-Life-Part-One-Fire-By-Day, accessed and archived on December 1, 2020.
Soares, O. C., 2010. Warming Power of CO2 and H2O: Correlations with Temperature Changes. International Journal of Geosciences, Vol. 1, p. 102-112, doi:10.4236/ijg.2010.13014
Socolow, R., 2011. 7 Billion People, 30 Gigatons of CO2, 1 Warming Planet: Population & Climate in the 21st Century. https://www.discovermagazine.com/environment/7-billion-people-30-gigatons-of-co2-1-warming-planet-population-andclimate-in-the-21st-century, accessed and archived on October 20, 2020.
Soden, B.J., et al. 2002. Global cooling after the eruption of Mount Pinatubo: A test of climate feedback by water vapor. Science, Vol. 296, Issue 5568, p. 727-730, DOI: 10.1126/science.296.5568.727
Solanki, S. K., and Krivova, N., 2003. Can solar variability explain global warming since 1970? Journal of Geophysical Research, Vol. 108, Issue A5, 1200, 8 pp., DOI: 10.1029/2002JA009753
Solanki, S. K., Usoskin, I. G., Kromer, B., Schüssler, M., Beer, J., 2004. Unusual activity of the Sun during recent decades compared to the previous 11,000 years. Nature, Vol. 431, Issue 7012, p. 1084–1087, DOI:10.1038/nature02995.
Som, S. M., Catling, D., Harnmeijer, J. et al., 2012. Air density 2.7 billion years ago limited to less than twice modern levels by fossil raindrop imprints. Nature, 484, p. 359-362, https://doi.org/10.1038/nature10890
Som, S. M., et al., 2016. Earth’s air pressure 2.7 billion years ago constrained to less than half of modern levels. Nature Geoscience, Vol. 9, p. 448-451, DOI: 10.1038/NGEO2713
Soon, W., and Baliunas, S., 2003a. Proxy climatic and environmental changes of the past 1000 years. Climate Research, Vol. 23, p. 89110, DOI: 10.3354/cr023089
Soon, W., Baliunas, S., Idso, C., Idso, S., and Legates, D. R., 2003b. Reconstructing Climatic and Environmental Changes of the Past 1000 Years: A Reappraisal. Energy & Enironment, Vol. 14, Nos. 2 & 3, p. 233-296, DOI:10.1260/095830503765184619
Soon, W., and Yaskell, S. H., 2003c. The Maunder Minimum and the Variable Sun-Earth Connection. World Scientific Publishers, ISBN: 981-233-274-7, 323 pp., DOI: 10.1142/5199
Soon, W., Connolly, R., and Connolly, M., 2015. Re-evaluating the role of solar variability on Northern Hemisphere temperature trends since the 19th century. Earth-Science Reviews, Vol. 150, p. 409-452, DOI: 10.1016/j.earscirev.2015.08.010
Soon, W., and Markó, I., 2017. To Put America First is to Put our Planet's Climate First. Breitbart, June 16, 2017, https://www.breitbart.com/politics/2017/06/16/america-first-climate/, accessed and archived on September 5, 2022.
Sørensen, S.P.L. and Palitzsch, S., 1910. Über die Messung der Wasserstoffionenkonzentration des Meerwassers. Biochem. Z., 24: 387.
Sornette, D., 2015. A civil super-Apollo project in nuclear research for a safer and prosperous world. Energy Research & Social Science, Vol. 8, P. 60-65, DOI: 10.1016/j.erss.2015.04.007, https://arxiv.org/pdf/1504.06985.pdf
Sorokhtin, O. G., 2001. Greenhouse effect: Myth and reality. Vestnik Russian Academy of Natural Sciences, 1(1), p. 8-21 (in Russian) Sorokhtin, O. G., Chilingar, G. V., Khilyuk, L. F., and Gorfunkel, M. V., 2007a. Evolution of the Earth’s Global Climate. Energy Sources, Part A, 29: p. 1–19, Taylor & Francis Group, ISSN: 1556-7036 print/1556-7230 online, DOI: 10.1080/15567030600968648
Sorokhtin, O. G., Chilingar, G. V., and Khilyuk, L. F., 2007b. Global Warming and Global Cooling Evolution of the Climate on Earth, Elsevier, 313 pp.
Sorokhtin, O. G., Chilingar, G. V., and Sorokhtin, N. O., 2011. Evolution of Earth and its Climate, Birth, Life and Death of Earth, Elsevier, ISBN-13: 978-0444537577, 596 pp.
Sorokhtin, O. G., Chilingar, G. V., Sorokhtin, N. O., Liu, M., and Khilyuk, L. F., 2015. Jupiter’s effect on Earth’s climate. Environmental Earth Sciences, Vol. 73, p. 4091–4097.
Souney, J. M., 2014. Core handling and processing for the WAIS Divide ice-core project. Annals of Glaciology, Vol. 55, Issue 68, p. 1526, https://doi.org/10.3189/2014AoG68A008
Soyfer, V. N., 1994. Lysenko and the Tragedy of Soviet Science. Rutgers University Press, ISBN-13: 978-0813520872, 379pp. Spakovsky von, H., 2016. Attorney General Lynch Looks Into Prosecuting ‘Climate Change Deniers’. March, 10, 2016, https://www.dailysignal.com/2016/03/10/attorney-general-lynch-looking-into-prosecuting-climate-change-deniers/, accessed and archived on October 27, 2020.
Sparks, R. J., et al., 2016. 14C Calibration in the Southern Hemisphere and the Date of the Last Taupo Eruption: Evidence from TreeRing Sequences. Radiocarbon, Volume 37 , Issue 2, p. 155-163, DOI: https://doi.org/10.1017/S0033822200030599
Speelman, E. N., et al., 2009. The Eocene Arctic Azolla Bloom: Environmental Conditions, Productivity and Carbon Drawdown. Geobiology, Vol. 7, n°2, p. 155-170, DOI: 10.1111/j.1472-4669.2009.00195.x.
Spencer, R. W., 2007. How Serious is the Global Warming Threat? Society, Social Science and Public Policy, Vol. 44, n°5, p. 45-50, DOI: 10.1007/s12115-007-9002-3
Spencer, R. W., 2014. 95% of Climate Models Agree: The Observations Must be Wrong. February 7, 2014, https://www.drroyspencer.com/2014/02/95-of-climate-models-agree-the-observations-must-be-wrong/, accessed and archived on December 1, 2020.
Spencer, R. W., Christy, J. R., and Braswell, W. D., 2015. Version 6.0 of the UAH Temperature Dataset Released: New LT Trend = +0.11 C/decade. 16 pp., April 28, 2015, http://www.drroyspencer.com/wp-content/uploads/Version-61.pdf also http://www.drroyspencer.com/2015/04/version-6-0-of-the-uah-temperature-dataset-released-new-lt-trend-0-11-cdecade/, accessed and archived on December 1, 2020.
Spencer, R. W., 2016. A Guide to Understanding Global Temperature Data. Texas Public Policy Foundation, www.texaspolicy.com, 22 pp., https://files.texaspolicy.com/uploads/2018/08/16102354/ACEE-Global-Temperature-booklet-July-2016-PDF.pdf, accessed and archived on July 25, 2020.
Spencer, R. W., 2017. Update on Possible Ecoterror Attack at UAH. https://www.drroyspencer.com/2017/04/update-on-possibleecoterror-attack-at-uah/, accessed and archived on December 1, 2020.
Spencer, R. W., Christy, J. R., and Braswell, W. D., 2017. UAH Version 6 global satellite temperature products: Methodology and results, Asia-Pacific Journal of the Atmospheric Sciences, Vol. 53, p. 121-130, DOI: 10.1007/s13143-017-0010-y
Spencer, R., 2021. UAH Global Temperature Update for January 2021: +0.12 deg. C (new base period). February 2nd, 2021, http://www.drroyspencer.com/2021/02/uah-global-temperature-update-for-january-2021-0-12-deg-c-new-base-period/ Spiegel, E. A., and Zahn, J.-P., 1992. The solar tachocline. Astronomy and Astrophysics, Vol. 265, no. 1, pp. 106-114.
Stallinga, P., 2018. Carbon Dioxide and Ocean Acidification. European Scientific Journal, Vol. 14, Issue 18, DOI: 10.19044/esj.2018.v14n18p476
Stallinga, P., 2020. Comprehensive Analytical Study of the Greenhouse Effect of the Atmosphere. Atmospheric and Climate Sciences, Vol. 10, p. 40-80, DOI: 10.4236/acs.2020.101003
Steele, J., 2013. Landscapes & Cycles: An Environmentalist's Journey to Climate Skepticism. Publisher: CreateSpace Independent Publishing Platform, ISBN-13 978-1490390185, 342 pp
Steele, J., 2016. How Gaia and coral reefs regulate ocean pH. Climate Etc., October 13th, 2016, https://judithcurry.com/2016/10/13/how-gaia-and-coral-reefs-regulate-ocean-ph/, accessed and archived on June 30, 2020. Steele, J., 2020. Ocean Health – Is there an “Acidification” problem? 29 pp., CO 2 COALITION white paper, http://co2coalition.org/wpcontent/uploads/2020/06/Steele-Ocean-Health-White-Paper-final-5-28-20.pdf, accessed and archived on June 30, 2020. Stefan, J., 1879. Über die Beziehung zwischen der Wärmestrahlung und der Temperatur, “On the relationship between thermal radiation and temperature”. Bulletin from the sessions of the Vienna Academy of Sciences (Vienna, 1879), Vol. 79, p. 391-428, http://www.ing-buero-ebel.de/strahlung/Original/Stefan1879.pdf, accessed and archived on August 4, 2022.
Stefani, F., Giesecke, A., Weier, T., 2019. A Model of a Tidally Synchronized Solar Dynamo. Solar Physics, Vol. 294, n°5, 60 pp., DOI: 10.1007/s11207-019-1447-1, https://arxiv.org/abs/1803.08692
Stefani, F., Stepanov, R., and Weier, T., 2021. Shaken and Stirred: When Bond Meets Suess–de Vries and Gnevyshev–Ohl. Solar Physics, Vol. 296, Article number: 88, https://doi.org/10.1007/s11207-021-01822-4
Stéfanon, M., 2012. Heat waves and droughts in Mediterranean : contributions of land-atmosphere coupled processes on mesoscale. Thèse préparée au Laboratoire de Météorologie Dynamique Institut Pierre Simon Laplace, 123 pp., https://www.lmd.polytechnique.fr/intro/Files/2012-These_Stefanon.pdf, accessed and archived on August 26, 2020.
Steffen, W., and Hughes, L., 2013. The Critical Decade: Climate science, risks and responses. Department of Climate Change and Energy Efficiency. ISBN 978-1-925006-20-9 (Print), 978-1-925006-21-6 (Web), 108 pp., https://www.climatecouncil.org.au/uploads/b7e53b20a7d6573e1ab269d36bb9b07c.pdf, accessed and archived on July 8, 2020.
Steig, E. J., 2006. The south–north connection. Nature, Vol. 444, p. 152-153, https://doi.org/10.1038/nature05301
Steig, E. J., et al., 2013. Recent climate and ice-sheet changes in West Antarctica compared with the past 2,000 years. Nature Geoscience, Vol. 6, p. 372–375, https://ntrs.nasa.gov/archive/nasa/casi.ntrs.nasa.gov/20150001452.pdf, DOI: 10.1038/NGEO1778,
Stein, R., et al. 2017. Holocene variability in sea ice cover, primary production, and Pacific‐Water inflow and climate change in the Chukchi and East Siberian Seas (Arctic Ocean). Journal of Quaternary Science, Vol. 32, Issue 3, p. 362-379.
Stainforth, D. A., et al., 2005. Uncertainty in predictions of the climate response to rising levels of greenhouse gases. Nature, Vol. 433, Issue 7024, p. 403-406, DOI: 10.1038/nature03301
Steinhilber, F., et al., 2012. 9,400 years of cosmic radiation and solar activity from ice cores and tree rings. Proc. of the Natl. Acad. of Sci. of the U.S.A., 5 pp., www.pnas.org/cgi/doi/10.1073/pnas.1118965109
Steinthorsdottir, M., Wohlfarth, B., Kylander, M. E., Blaauw, M., Reimer, P. J., 2013. Stomatal proxy record of CO 2 concentrations during the Last Termination suggests an important role for CO2 at climate change transitions. Quaternary Science Reviews, Vol. 68, p. 43-58, http://dx.doi.org/10.1016/j.quascirev.2013.02.003
Stéphan, I., 2018. Programmation Logique et Prolog. UFR Sciences Angers, 70 pp., http://www.info.univangers.fr/pub/stephan/L3INFO/PROGRAMMATION_LOGIQUE/prog_log.pdf, accessed and archived on October 12, 2020. Stern, B., and Miller, N. R., 2019. Neoproterozoic Glaciation—Snowball Earth Hypothesis. In book: Encyclopedia of Geology, 2nd edition, Reference Module in Earth Systems and Environmental Sciences, 11 pp., DOI: 10.1016/B978-0-12-409548-9.12107-4
Stern, H., and Davidson, N. E., 2015. Trends in the skill of weather prediction at lead times of 1–14 days. Quarterly Journal of the Meteorological Society, Vol. 141, Issue 692, p. 2726-2736, https://doi.org/10.1002/qj.2559
Stevens, B., and Bony, S., 2013. What Are Climate Models Missing? Science, Vol. 340, Issue 6136, p. 1053-1054, https://www.wcrpclimate.org/images/documents/grand_challenges/GC4_cloudsStevensBony_S2013.pdf, DOI: 10.1126/science.1237554
Stevens, B., Sherwood, S. C., Bony, S., and Webb, M. J., 2016. Prospects for narrowing bounds on Earth's equilibrium climate sensitivity. Earths Future, Vol. 4, p. 512–522, https://doi.org/10.1002/2016EF000376
Steyn, M., 2015a. A Disgrace to the Profession: The World's Scientists on Michael E Mann, his Hockey Stick and their Damage to Science. ISBN-13 : 978-0986398339, 347 pp.
Steyn, M., 2015b. Steyn on Mann "should be a Mandatory Textbook" for Ethics of Science. September 15, 2015, https://www.steynonline.com/7174/steyn-on-mann-should-be-a-mandatory-textbook-for Stríkis, N. M., et al., 2018. South American monsoon response to iceberg discharge in the North Atlantic. Proc. of the Natl. Acad. of Sci. of the U.S.A., Vol. 115, Issue 15, p. 3788-3793, https://doi.org/10.1073/pnas.1717784115
Stokstad, E., 2019. Nitrogen crisis from jam-packed livestock operations has ‘paralyzed' Dutch economy. https://www.science.org/, Dec. 4, https://www.science.org/content/article/nitrogen-crisis-jam-packed-livestock-operations-has-paralyzed-dutcheconomy, doi: 10.1126/science.aba4504, accessed and archived on July 26, 2022.
Storey, M., Duncan, R. A., and Swisher, C. C., 2007. Paleocene-Eocene thermal maximum and the opening of the northeast Atlantic. Science, Vol. 316, Issue 5824, 587–589, DOI: 10.1126/science.1135274
Stothers, R., 1979. Ancient aurorae. Isis, Vol. 70, n°1, p. 85–95, https://doi.org/10.1086/352156
Stothers, R. B., 2002. Cloudy and clear stratospheres before A.D. 1000 inferred from written sources. Journal of Geophysical Research, Vol. 107, Issue D23, 4718, DOI: 10.1029/2002JD002105
Stott, P. A., et al., 2000. External Control of 20th Century Temperature by Natural and Anthropogenic Forcings. Science, Vol. 290, Issue 5499, p. 2133-2137, DOI: 10.1126/science.290.5499.2133
Stott, P. A., Jones, G. S., and Mitchell, J. F. B., 2003. Do Models Underestimate the Solar Contribution to Recent Climate Change? Journal of Climate, Vol. 16, n°24, p. 4079-4093, DOI: 10.1175/1520-0442(2003)016<4079:DMUTSC>2.0.CO;2
Stott, P. A., et al., 2016 Attribution of extreme weather and climate-related events. Wiley Interdisciplinary Reviews Climate Change, Vol. 7, p. 23-41, DOI: 10.1002/wcc.380
Stouffer, R., et al., 2017. CMIP5 scientific gaps and recommendations for CMIP6. Bulletin of the American Meteorological Society, Vol. 98, p. 95-105, DOI: 10.1175/BAMS-D-15-00013.1
Stranne, C., , Jakobsson, M, and Björk, G., 2014. Arctic Ocean perennial sea ice breakdown during the Early Holocene Insolation Maximum. Quaternary Science Reviews, Vol. 92, p. 123-132, https://doi.org/10.1016/j.quascirev.2013.10.022
Strasser, A., Hilgen, F., and Heckel, P., 2006. Cyclostratigraphy - Concepts, definitions, and applications. Newsletters on Stratigraphy, Vol. 42, n°2, p. 75-114, DOI: 10.1127/0078-0421/2006/0042-0075
Strong, M., 2007. A Super Agency? The Globe and Mail, March 7, 2007, https://www.theglobeandmail.com/opinion/a-superagency/article721953/, accessed and archived on July 22, 2022.
Strong, K., Saba, J., and Kucera, T., 2012. Understanding Space Weather: The Sun as a Variable Star. American Meteorological Society, BAMS, p. 1327-1335, DOI: 10.1175/BAMS-D-11-00179.1
Strong, M., 2012. Environment: radical changes needed. Reflections of Maurice Strong at Symposium on “Environmental Change and Global Responses 2012”, Monday, February 20th 2012. https://www.mauricestrong.net/
Stouffer, R. J., et al., 2006. Investigating the Causes of the Response of the Thermohaline Circulation to Past and Future Climate Changes. Journal of Climate, Vol. 19, n°8, p. 1365–1387, https://doi.org/10.1175/JCLI3689.1
Stuiver, M., 1978. Atmospheric Carbon Dioxide and Carbon Reservoir Changes. Science, Vol. 199, Issue 4326, p. 253-258, DOI: 10.1126/science.199.4326.253
Stuiver, M., and Braziunas, T. F., 1993. Sun, ocean,climate and atmospheric 14CO2: An evaluation of causal and spectral relationship. The Holocene, Vol. 3, n°4, p. 289-305, https://doi.org/10.1177/095968369300300401
Stuiver, M., Grootes, P. M., and Braziunas, T. F., 1995. The GISP2 δ 18O Climate Record of the Past 16,500 Years and the Role of the Sun, Ocean, and Volcanoes. Quaternary Research, Vol. 44, p. 341-354, https://doi.org/10.1006/qres.1995.1079
Su, Z., Ingersoll, A. P., and He, F., 2016. On the Abruptness of Bølling–Allerød Warming. Journal of Climate, Vol. 29, n°13, p. 4965–4975, DOI:10.1175/JCLI-D-15-0675.1
Suarez-Gutierrez, L., Milinski, S. and Maher, N., 2021. Exploiting large ensembles for a better yet simpler climate model evaluation. Climate Dynamics, Vol. 57, p. 2557–2580, https://doi.org/10.1007/s00382-021-05821-w
Suess, 1875. Die Entstehung der Alpen. Wilhelm Braumüller, Wien, 1875, 188 pp, https://opac.geologie.ac.at/ais312/dokumente/7574,%2080_Suess_Entstehung_Alpen.pdf, accessed and archived on December 7, 2020.
Sullivan, W., 1978. International Team of Specialists Finds No End in Sight to 30‐Year Cooling Trend in Northern Hemisphere. The New York Times, January 5, 1978, Section D, Page 17, https://www.nytimes.com/1978/01/05/archives/international-teamof-specialists-finds-no-end-in-sight-to-30year.html, accessed and archived on December 20, 2020.
Sun, N., Brandon, A. D., Forman, S. L., Waters, M. R., and Befus, K. S., 2020. Volcanic origin for Younger Dryas geochemical anomalies ca. 12,900 cal B.P. Science Advances, Vol. 6, n° 31, eaax8587, DOI: 10.1126/sciadv.aax8587
Sussman, G. J. and Wisdom, J., 1992. Chaotic Evolution of the Solar System. Science, Vol. 257, Issue 5066, p. 56–62, DOI: 10.1126/science.257.5066.56
Sussman, B., 2008. James Hansen: Abusing the Public Trust. American Thinker, June 24, 2008, https://www.americanthinker.com/articles/2008/06/james_hansen_abusing_the_publi.html, accessed and archived on December 1, 2020.
Svensmark, H., and Friis-Christensen, E., 1997. Variation of cosmic ray flux and global cloud coverage – a missing link in solar-climate relationships. Journal of Atmospheric and Solar Terrestrial Physics, vol. 59, p. 1225–1232, DOI: 10.1016/S13646826(97)00001-1
Svensmark, H., 1998. Influence of Cosmic Rays on Earth's Climate. Physical Review Letters, Vol. 81, n°22, p. 5027-5030. DOI: 10.1103/PhysRevLett.81.5027
Svensmark, H., 2007. Cosmoclimatology: a new theory emerges. Astronomy and Geophysics, Vol. 48, p. 1.18-1.24, https://doi.org/10.1111/j.1468-4004.2007.48118.x
Svensmark, H., Pedersen, JOP, Marsh, N. D., et al., 2007. Experimental evidence for the role of ions in particle nucleation under atmospheric conditions. Royal Society of London Proceedings Series A, Vol. 463, p. 385–396, https://doi.org/10.1098/rspa.2006.1773
Svensmark, H., Bondo, T., and Svensmark, J., 2009. Cosmic ray decreases affect atmospheric aerosols and clouds. Geophysical Research Letters: Space Physics, Vol. 36, L15101, p. 1-4, DOI: 10.1029/2009GL038429
Svensmark, H., Enghoff, M. B., and Pedersen, J. O. P., 2013. Response of cloud condensation nuclei (> 50 nm) to changes in ionnucleation under atmospheric conditions. Physics Letters A, Vol. 377, Issue 37, pp. 2343–2347, https://doi.org/10.1016/j.physleta.2013.07.004
Svensmark, J., Enghoff, M. B., Shaviv, N. J., and Svensmark, H., 2016. The response of clouds and aerosols to cosmic ray decrease. Journal of Geophysical Research: Space Physics, Vol. 121, p. 8152–8181. http://dx.doi.org/10.1002/2016JA022689
Svensmark, H., Enghoff, M. B., Shaviv, N. J., and Svensmark, J., 2017. Increased ionization supports growth of aerosols into cloud condensation nuclei, Nature Communications, Vol. 8, p. 2199, 9 pp., https://doi.org/10.1038/s41467-017-02082-2
Svensmark, H., 2019. FORCE MAJEURE, The Sun’s Role in Climate Change. The Global Warming Policy Foundation, GWPF Report 33, ISBN 978-0-9931190-9-5, 42 pp, accessed and archived on June 10, 2020.
Svensmark, H., Svensmark, J., Enghoff, M. B., and Shaviv, N. J., 2021. Atmospheric ionization and cloud radiative forcing. Scientific Reports, Vol. 11, Article 19668, 14 pp., DOI: 10.1038/s41598-021-99033-1
Sverdrup, H. U., Johnson, M. W., and Fleming, R. H., 1942. Chapter VI: Chemistry of Sea Water, in: The Oceans Their Physics, Chemistry, and General Biology, New York: Prentice-Hall, p. 165-227, DOI: 10.2307/1438154, https://publishing.cdlib.org/ucpressebooks/view?docId=kt167nb66r, accessed and archived on August 27, 2020. https://publishing.cdlib.org/ucpressebooks/data/13030/6r/kt167nb66r/pdfs/kt167nb66r_ch06.pdf
Swanson, R. E., 2017. A Comparative Analysis of Data Derived from Orbiting MSU/AMSU Instruments. Journal of Atmospheric and Oceanic Technology, Vol. 34, p. 225-232, https://doi.org/10.1175/JTECH-D-16-0121.1
Takahashi, T., 1961. Carbon dioxide in the atmosphere and in Atlantic Ocean water. Journal of Geophysical Research, Vol. 66, Issue 2, p. 477-494, https://doi.org/10.1029/JZ066i002p00477
Takahashi, T., Olafsson, J., Goddard, J., Chipman, D.W., and Sutherland, S.C., 1993. Seasonal variation of CO2 and nutrients in the high-latitude surface oceans: a comparative study. Global Biogeochemical Cycles, Vol. 7, NO. 4, p. 843–878, https://doi.org/10.1029/93GB02263
Takahashi, T., et al., 2002. Global sea–air CO2 flux based on climatological surface ocean pCO2, and seasonal biological and temperature effects. Deep-Sea Research Part II: Topical Studies in Oceanography, Vol. 49, Issues 9-10, p. 1601–1622, https://doi.org/10.1016/S0967-0645(02)00003-6
Takahashi, T., et al., 2009. Climatological mean and decadal change in surface ocean pCO 2, and net sea-air CO2 flux over the global oceans. Deep-Sea Research II, Vol. 56, p. 554-577, DOI: 10.1016/j.dsr2.2008.12.009
Taljaard, J. J., and H. van Loon, 1964. Southern Hemisphere weather maps for the International Geophysical Year. Bulletin of the American Meteorological Society, Vol. 45, No.2, p. 88-95, https://www.jstor.org/stable/26246879
Tamarkin, T., 2021. Manmade Global Warming: The Story & the Reality. climatecite, March 24, 2021, https://climatecite.com/manmade-global-warming-story-and-reality/, accessed and archived on July 10, 2022.
Tans, P., 2009. An Accounting of the Observed Increase in Oceanic and Atmospheric CO 2 and an Outlook for the Future. Oceanography, Vol. 22, n°4, p. 26-35. http://dx.doi.org/10.5670/oceanog.2009.94
Taub, D., 2010. Effects of Rising Atmospheric Concentrations of Carbon Dioxide on Plants. Nature Education Knowledge, Vol. 3, n°10, p. 21, https://www.nature.com/scitable/knowledge/library/effects-of-rising-atmospheric-concentrations-of-carbon13254108/, accessed and archived on November 18, 2020.
Taurisano, A., Bøggild, C.E., and Karlsen, H.G. 2004. A century of climate variability and climate gradients from coast to ice sheet in West Greenland. Geografiska Annaler, Series A, Physical Geography, Vol. 86, no. 2 (2004), pp. 217-224, Taylor & Francis, Ltd, https://www.jstor.org/stable/3566110, https://doi.org/10.1111/j.0435-3676.2004.00226.x
Taylor, K. E., Stouffer, R. J., and Meehl, G. A., 2012. An Overview of CMIP5 and the Experiment Design. Bulletin of the American Meteorological Society, Vol. 93, Issue 4, p. 485-498, https://doi.org/10.1175/BAMS-D-11-00094.1 TBD&MJ, 1901. RECEDING GLACIERS. The Braidwood Dispatch and Mining Journal (NSW : 1888 - 1954) mer. 28 sept. 1910, Page 4, https://trove.nla.gov.au/newspaper/article/100784966
Tennekes, H., 2008. My Position on Climate Change. July 14, https://pielkeclimatesci.wordpress.com/2008/07/14/my-position-onclimate-change-by-hendrik-tennekes/ Accessed and archived on November 23, 2020.
Tennekes, H., 2009. Three Essays on Climate Models. 9 January, SPPI Commentary & Essay Series, 11 pp., http://scienceandpublicpolicy.org/images/stories/papers/commentaries/tennekes_essays_climate_models.pdf, accessed and archived on November 23, 2020.
Tetlock, P. E., 2005. Expert Political Judgment: How Good Is It? How Can We Know? Princeton University Press, 362 pp. (new edition in 2017 - ISBN 9780691178288, 368 pp.)
Teyssen, J., and Fuchs, M., 2005. Wind Report 2005. E.ON Netz GmbH Bernecker Straße 70 95448 Bayreuth Germany, 24 pp., http://s3.amazonaws.com/windaction/attachments/141/EON_2005_Report.pdf, accessed and archived on December 1, 2020.
TF-PHA-NEO, 2000. Report of the Task Force on potentially hazardous NEAR EARTH OBJECTS. Information Unit, British National Space Centre, 151 Buckingham Palace Road, London, SW1W 9SS, 54 pp., http://www.nearearthobjects.co.uk, accessed and archived on December 7, 2020, https://spaceguardcentre.com/wp-content/uploads/2014/04/full_report.pdf
Thatcher, M., 1981. Speech at Monash University (1981 Sir Robert Menzies Lecture). October 6, 1981, https://www.margaretthatcher.org/document/104712, accessed and archived on December 2, 2020.
The Irish Times, 2019. 'Our house is on fire’: MEPs declare climate emergency. The Irish Times, November 28, 2019, https://www.irishtimes.com/news/environment/our-house-is-on-fire-meps-declare-climate-emergency-1.4098159, accessed and archived on December 1, 2020.
The World Bank, 2017. Vision 2025: Sri Lanka’s Path to Prosperity. October 17, https://www.worldbank.org/en/news/feature/2017/10/17/vision-2025-sri-lankas-path-to-prosperity, accessed and archived on July 25, 2022.
Thiagarajan, N., et al., 2014. Abrupt pre-Bølling–Allerød warming and circulation changes in the deep ocean. Nature, Vol. 511, p. 7578, DOI: 10.1038/nature13472
Thomas, E. R., et al., 2007. The 8.2 ka event from Greenland ice cores. Quaternary Science Reviews, Vol. 26, n°1, p. 70-81, DOI: 10.1016/j.quascirev.2006.07.017
Thomas, T., 2019. A Climate Modeller Spills the Beans. https://quadrant.org.au/opinion/doomed-planet/2019/09/a-climatemodeller-spills-the-beans/, accessed and archived on August 25, 2020.
Thompson, D. W. J., and Wallace, J. M., 1998. The Arctic oscillation signature in the wintertime geopotential height and temperature fields. Geophysical Research Letters, Vol. 25, Issue 9, p. 1297-1300, https://doi.org/10.1029/98GL00950
Thompson, L., G., et al., 2006. Abrupt tropical climate change: Past and present. Proc. of the National Academy of Sciences of the U.S.A., Vol. 103, n°28, p. 10536-10543, https://doi.org/10.1073/pnas.0603900103
Thomson, W., 1849. An Account of Carnot's Theory of the Motive Power of Heat. Earth and Environmental Science Transactions of The Royal Society of Edinburgh , Vol.16, Issue 5, p. 541-574, https://doi.org/10.1017/S0080456800022481
Thoning, K. W., Tans, P. P., Komhyr, W. D., 1989. Atmospheric carbon dioxide at Mauna Loa Observatory: 2. Analysis of the NOAA GMCC data, 1974–1985. Journal of Geophysical Research, Atmospheres, Vol. 94, Issue D6, p. 8549-8565, https://doi.org/10.1029/JD094iD06p08549
Thunberg, G., 2019. Greta Thunberg's full speech to world leaders at UN Climate Action Summit, https://www.youtube.com/watch? v=KAJsdgTPJpU
Tiedtke, M., 1993. Representation of clouds in large-scale models. Monthly Weather Review, Vol. 121, Issue 11, p. 3040–3061, DOI: 10.1175/1520-0493(1993)121<3040:ROCILS>2.0.CO;2
Timmreck, C., 2011. Limited Climate Response of Very Large Volcanic Eruptions. Research News, Max Planck Institute for Meteorology, https://pdfs.semanticscholar.org/75ee/4b5336a0ac89e18f9db1819654c2fbdf61bf.pdf, accessed and archived on August 17, 2020.
Timperley, J., 2020. The law that could make climate change illegal. BBC, July 8, 2020, https://www.bbc.com/future/article/20200706-the-law-that-could-make-climate-change-illegal, accessed and archived on November 2, 2020.
Ting, M., Kushnir, Y., Seager, R., and Li, C., 2008. Forced and Internal Twentieth-Century SST Trends in the North Atlantic. Journal of Climate, Vol. 22, p. 1469-1481, DOI: 10.1175/2008JCLI2561.1
Tinsley, B. A., and Deen, G.W., 1991. Apparent tropospheric response to MeVGeV particle flux variations: A connection via electrofreezing of supercooled water in high-level clouds? Journal of Geophysical Research (Atmospherics), Vol. 96, n° D12, p.22,283-22,296, https://doi.org/10.1029/91JD02473
Tinsley, B. A., and Heelis, R. A., 1993. Correlations of atmospheric dynamics with solar activity evidence for a connection via the solar wind, atmospheric electricity, and cloud microphysics. Journal of Geophysical Research: Atmospheres, Vol. 98, Issue D6, p. 10375–10384, https://doi.org/10.1029/93JD00627
Tinsley, B. A., Burns, G. B., and Zhou, L., 2007. The role of the global electric circuit in solar and internal forcing of clouds and climate. Advances in Space Research, Vol. 40, p. 1126–1139, doi:10.1016/j.asr.2007.01.071
Tinsley, B. A., 2012. A working hypothesis for connections between electrically-induced changes in cloud microphysics and storm vorticity, with possible effects on circulation. Advances in Space Research, Vol. 50, Issue 6, p. 791–805, https://doi.org/10.1016/j.asr.2012.04.008
Titus, J. G., Wedge, R., Psuty, N., and Fancher, J., 1990. Changing Climate and the Coast, Vol. 1, Adaptive Responses and their Economic, Environmental, and Institutional Implications. Report of the IPCC from the Miami Conference on Adaptive Responses to Sea Level Rise and Other Impacts of Global Climate Change, Fla, Nov 27-Dec 1, 1989, sponsored by the US Environmental Protection Agency and others. https://nepis.epa.gov/Exe/ZyPDF.cgi/70000A5V.PDF?Dockey=70000A5V.PDF
Tjaart, Lemmer, https://www.quora.com/Why-have-the-IPCC-removed-the-following-statement-from-the-record-The-climatesystem-is-a-coupled-non-linear-chaotic-system-and-therefore-the-long-term-prediction-of-future-exact-climate-states-is-notpossible, accessed on December 1, 2020.
Tjemkes, S. A., 1988. Radiative Cooling in the Nocturnal Boundary Layer. Thesis to obtain the degree of Doctor of Agricultural Sciences, December 21, Agricultural University in Wageningen, 108 pp, https://edepot.wur.nl/202962, accessed and archived on March 1, 2021.
TNZCSC, 2009. Are we feeling warmer yet? November 25, https://www.climateconversation.org.nz/docs/awfw/are-we-feelingwarmer-yet.htm, accessed and archived on October 30, 2020.
Toggweiler, J.R., 1990. Bombs and ocean carbon cycles. Nature, Vol. 347, p. 122-123, https://doi.org/10.1038/347122a0, https://www.gfdl.noaa.gov/bibliography/related_files/jrt9001.pdf
Tol, R. S. J., 2017. The Private Benefit of Carbon and its Social Cost. Working Paper Series 0717, Department of Economics, University of Sussex Business School, 8 pp., https://ideas.repec.org/p/sus/susewp/0717.html, accessed and archived on February 10, 2021.
Tollefson, J., 2021. Top climate scientists are sceptical that nations will rein in global warming. Nature, Vol 599, p. 22-24, https://doi.org/10.1038/d41586-021-02990-w
Tolman, F., and Poyet, P., 1994. The ATLAS models. 1st ECPPM Conference, in: Product and Process Modelling in the Building Industry, Scherer (ed.), ISBN 90 5410 584 8, Dresden, Germany, Vol. 1, pp. 473-477, DOI: 10.13140/2.1.4715.8723
Tomasini, B., Cassassolles, E., Poyet, P., Maynard de Lavalette, G. and Siffredi, B., 1991. Multiple-target tracking in a cluttered environment and intelligent track record. Proceedings of SPIE - The International Society for Optical Engineering, Vol. 1468, Issue 60, p. 60-71, DOI: 10.1117/12.45449
Toohey, M., et al., 2016. Climatic and societal impacts of a volcanic double event at the dawn of the Middle Ages. Climatic Change, Vol. 136, Issue 3-4, 15 pp. , DOI: 10.1007/s10584-016-1648-7
Toohey, M., and Sigl, M., 2017. Volcanic stratospheric sulfur injections and aerosol optical depth from 500 BCE to 1900 CE. E arth System Science Data, Vol. 9, p. 809–831, https://doi.org/10.5194/essd-9-809-2017
Torbett, M. V., 1989. Solar system and galactic influences on the stability of the earth. Global and Planetary Change, Vol 1, Issues 1–2, p. 3-33, https://doi.org/10.1016/0921-8181(89)90014-3
Touma, J., and Wisdom, J., 1993. The Chaotic Obliquity of Mars. Science, Vol. 259, Issue 5099, p. 1294-1297, DOI: 10.1126/science.259.5099.1294
Treadgold, R., 2010a. NIWA loses, opts for fresh start. Feb. 7, https://www.climateconversation.org.nz/2010/02/niwa-loses-opts-forfresh-start/, accessed and archived on October 30, 2020.
Treadgold, R., 2010b. NIWA disowns Salinger thesis. April 5, https://www.climateconversation.org.nz/2010/04/niwa-disownssalinger-thesis/, accessed and archived on November 11, 2020.
Treadgold, R., 2010c. The Curious Case of the Missing Thesis. October 21, https://www.climateconversation.org.nz/2010/10/thecurious-case-of-the-missing-thesis/, accessed and archived on December 1, 2020.
Trenberth, K. E., and Guillemot, C. J., 1994. The total mass of the atmosphere. Journal of Geophysical Research, Atmospheres, Vol. 99, Issue D11, p. 23079-23088, https://doi.org/10.1029/94JD02043
Trenberth, K. E., Fasullo, J. T., and Kiehl, J., 2009. Earth's Global Energy Budget. Bulletin of the American Meteorological Society, Vol.90, Issue 3, p. 311-324, https://doi.org/10.1175/2008BAMS2634.1
Trevelyan, G. M., 1942. A Shortened History of England. First published 1942, re-published 1988 by Penguin Books, ISBN: 0140233237, 608 pp.
Tripati, A., Roberts, C. D., and Eagle, R., 2009. Coupling of CO2 and Ice Sheet Stability Over Major Climate Transitions of the Last 20 Million Years. Science, Vol. 326, Issue 5958, p. 1394-1397, DOI: 10.1126/science.1178296
Tripati, A., and Darby, D., 2018. Evidence for ephemeral middle Eocene to early Oligocene Greenland glacial ice and pan-Arctic sea ice. Nature Communications, Vol. 9, Article n°1038, 11 pp., DOI: 10.1038/s41467-018-03180-5
Tröstl, J., et al., 2016. The role of low-volatility organic compounds in initial particle growth in the atmosphere. Nature, Vol. 533, p.527-531, DOI: 10.1038/nature18271
Trotter, J. A., Williams, I. S., Barnes, C. R., Lécuyer, C., and Nicoll, R. S., 2008. Did cooling oceans trigger Ordovician biodiversification? Evidence from conodont thermometry: Science, Vol. 321, Issue 5888, p. 550–554, https://doi.org/10.1126/science.1155814
Trouet V, et al., 2009. Persistent positive North Atlantic Oscillation mode dominated the medieval climate anomaly. Science, Vol. 324, Issue 5923, p. 78–80, DOI: 10.1126/science.1166349
Trutat, E., 1876. Les glaciers des Pyrénées, Station de la Dent de la Maladeta. Annuaire du Club Alpin Français, 1876, p.480-486. Tsushimaa, Y., and Manabe, S., 2013. Assessment of radiative feedback in climate models using satellite observations of annual flux variation. Proc. of the Natl. Acad. of Sci. of the U.S.A., Vol. 110, no. 19, p. 7568-7573, www.pnas.org/cgi/doi/10.1073/pnas.1216174110
Tung, K. K., Zhou, J., and Camp, C. D., 2008. Constraining model transient climate response using independent observations of solarcycle forcing and response. Geophysical Research Letters, Vol. 35, Issue 17, L17707, 5 pp., https://doi.org/10.1029/2008GL034240
Turco, R. P., Toon, O. B., Ackerman, T. P., Pollack, J. B., and Sagan, C., 1983. Nuclear Winter: Global Consequences of Multiple Nuclear Explosions, Science, Vol. 222, Issue 4630, p. 1283-1292, https://www.science.org/doi/10.1126/science.222.4630.1283
Turner, S. K., Hull, P. M., Kump, L. R., and Ridgwell, A., 2017. A probabilistic assessment of the rapidity of PETM onset. Nature Communications, Vol. 8, Article 353, 10 pp., DOI: 10.1038/s41467-017-00292-2
Tindall, J., 1864. On luminous and Obscure Radiation. Philosophical Magazine and Journal of Science, Vol. XXVIII. - Fourth Series, JulyDecember, p. 329-341.
Tyndall, J., 1875. Heat a Mode of Motion. Fifth Edition, London,Longmans, Green, and Co., 556 pp, accessed and archived on August 4, 2022, http://www.afhalifax.ca/magazine/wp-content/sciences/AMA2009/GustavKirchhoff/N0090140_PDF_1_-1DM.pdf
Tzedakis, P.C., et al. 2012. Determining the natural length of the current interglacial. Nature Geoscience, Vol. 5, p. 138-141, DOI: 10.1038/NGEO1358
Uche, U., 2011. The Problem With Absolute Thinking. https://www.psychologytoday.com/, September 27, 2011, https://www.psychologytoday.com/us/blog/promoting-empathy-your-teen/201109/the-problem-absolute-thinking, accessed and archived on September 6, 2022.
Udelhofen, P. M., and Cess, R. D., 2001. Cloud cover variations over the United States: An influence of cosmic rays or solar variability? Geophysical Research Letters, Vol. 28, p. 2617-2620, DOI: 10.1029/2000GL012659
Uemura, R., et al., 2018. Asynchrony between Antarctic temperature and CO 2 associated with obliquity over the past 720,000 years. Nature Communications, Vol. 9, Article number: 961, DOI: 10.1038/s41467-018-03328-3
UHP, 2020. International Alert Message of Health Professionals to Governments and Citizens of the World. United Health Professionnals, https://drive.google.com/file/d/1hghf8Bh3AIUi5HxrnPA8FZeQqo77e_xN/view/ https://covidinfos.net , ENinternational alert message.pdf, 59 pp, accessed 20th Oct 2020.
United Nations, 2015. Paris Agreement. Parties to the United Nations Framework Convention on Climate Change, hereinafter referred to as "the Convention", 27 pp., accessed and archived on December 1, 2020. https://sustainabledevelopment.un.org/content/documents/17853paris_agreement.pdf
United Nations, 2017. Transforming our World: The 2030 Agenda for Sustainable Development, A/RES/70/1, 41 pp., https://sustainabledevelopment.un.org/content/documents/21252030%20Agenda%20for%20Sustainable%20Development %20web.pdf, accessed and archived on July 25, 2022.
UN News, 2018. Climate change: An 'existential threat' to humanity, UN chief warns global summit. UNIS Vienna, 15 May 2018, Climate Change, https://news.un.org/en/story/2018/05/1009782, accessed and archived on October 27, 2020.
UN-OOSA, 2018. Near-Earth Objects and Planetary Defence. United Nations, Office for Outer Space Affairs, 22 pp., https://www.unoosa.org/documents/pdf/smpag/st_space_073E.pdf, accessed and archived on September 17, 2020.
Uppenbrink, J., 1999. The North Atlantic Oscillation. Science, Vol. 283, Issue 5404, p. 948-949, DOI: 10.1126/science.283.5404.948
Urey, H.C. 1947 The thermodynamic properties of isotopic substances. Journal of the Chemical Society, p. 562-581, https://doi.org/10.1039/JR9470000562
Urey, H. C., Lowenstam, H. A., Epstein, S., and McKinney, C. R., 1951. Measurements of Paleotemperatures and temperatures of the upper Cretaceous of England, Denmark and the Southeastern United States. Bulletin of the Geological Society of America, Vol. 61, p. 399-416.
Urey, H. C., 1952. On the early chemical history of the earth and the origin of life. Proc. of the Natl. Acad. of Sci. of the U.S.A., Vol. 38, n°4, p. 351–363, DOI: 10.1073/pnas.38.4.351
Urey, H. C., 1956. Regarding the Early History of the Earth's Atmosphere. Bulletin of the Geological Society of America, Vol. 67, n°8, p. 1125-1128, https://doi.org/10.1130/0016-7606(1956)67[1125:RTEHOT]2.0.CO;2
USGCRP, 2017. Climate Science Special Report: Fourth National Climate Assessment, Volume I [Wuebbles, D.J., D.W. Fahey, K.A. Hibbard, D.J. Dokken, B.C. Stewart, and T.K. Maycock (eds.)]. U.S. Global Change Research Program, Washington, DC, USA, 470 pp., DOI: 10.7930/J0J964J6, https://science2017.globalchange.gov/downloads/CSSR2017_FullReport.pdf, accessed and archived on November 3, 2020.
USGCRP, 2018. Impacts, Risks, and Adaptation in the United States: Fourth National Climate Assessment, Vol. II, U.S. Global Change Research Program, Washington, DC, USA, 1515 pp., DOI: 10.7930/NCA4.2018, https://nca2018.globalchange.gov/downloads/NCA4_2018_FullReport.pdf, accessed and archived on November 3, 2020.
Usoskin, I. G., Solanki, S. K., and Kovaltsov, G. A., 2007. Grand minima and maxima of solar activity: New observational constraints. Astronomy & Astrophysics, Vol. 471, n°1, p. 301–309, DOI: 10.1051/0004-6361:20077704
Usoskin, I. G., et al., 2014. Evidence for distinct modes of solar activity. Astronomy & Astrophysics, Vol. 562, L10, 4 pp., DOI: 10.1051/0004-6361/201423391
Usoskin, I. G., 2017. A history of solar activity over millennia. Living Reviews in Solar Physics, Vol. 14, Article n°3, 85 pp., DOI: 10.12942/lrsp-2013-1, https://link.springer.com/article/10.1007/s41116-017-0006-9
Usoskin, I. G., et al., 2018. A Millennium Scale Sunspot Number Reconstruction: Evidence For an Unusually Active Sun Since the 1940s. Physical Review Letters. Vol. 91, n°21, p. 211101, DOI: 10.1103/PhysRevLett.91.211101, https://arxiv.org/pdf/astroph/0310823.pdf
Vahrenholt von, F., 2011. Öko diktatur pur. Pure eco dictatorship. Welt, May 27, 2011, https://www.welt.de/print/die_welt/debatte/article13397280/Oekodiktatur-pur.html, accessed and archived on December 1, 2020.
Vallis, G. K., 2020. The Trouble with Water: Condensation, Circulation and Climate. The European Physical Journal Plus, 135:478, 26pp., https://doi.org/10.1140/epjp/s13360-020-00493-7
van der Ent, R. J., and Tuinenburg, O. A., 2017. The residence time of water in the atmosphere revisited. Hydrology and Earth System Sciences, Vol. 21, p. 779-790, DOI: 10.5194/hess-21-779-2017
van Geel, B., Raspopov, O. M., van Der Plicht, J., and Renssen, H., 1998. Solar forcing of abrupt Climate Change around 850 calendar years BC. In: Natural catastrophes during Bronze Age civilisations, Peiser, B. J., et al. (eds.), BAR International Series 728, p.162-168.
van Loon, H., 1956. Blocking action in the Southern Hemisphere. Notos, Vol. 5, 171 – 177.
van Loon, H., 1965. A Climatological Study of the Atmospheric Circulation in the Southern Hemisphere during the IGY, Part II. Journal of Applied Meteorology, Vol. 4, p. 479-491 DOI: 10.1175/1520-0450(1965)004<0479:ACSOTA>2.0.CO;2
van Loon, H., 1967. The Half-Yearly Oscillations in Middle and High Southern Latitudes and the Coreless Winter. Journal of the Atmospheric Sciences, Vol. 24, Issue 5, p. 472-486, DOI: 10.1175/1520-0469(1967)024<0472:THYOIM>2.0.CO;2
van Loon, H., and Jenne, R. L., 1972. The zonal harmonic standing waves in the southern hemisphere. Journal of Geophysical Research, Oceans and Atmospheres, Vol. 77, NO. 6, p. 992-1003, https://doi.org/10.1029/JC077i006p00992
van Loon, H., and Madden, R. A., 1981. The Southern Oscillation. Part I: Global Associations with Pressure and Temperature in Northern Winter. Monthly Weather Review, Vol. 109, p. 1150-1162, DOI: 10.1175/15200493(1981)109<1150:TSOPIG>2.0.CO;2
van Loon, H., 1984. The Southern Oscillation. Part III: Associations with the Trades and with the Trough in the Westerlies of the South Pacific Ocean. Monthly Weather Review, Vol. 112, p. 947-954, DOI: 10.1175/1520-0493(1984)112<0947:TSOPIA>2.0.CO;2
van Loon, H., and Labitzke, K., 1988. Association between the 11-Year Solar Cycle, the QBO, and the Atmosphere. Part II: Surface and 700 mb in the Northern Hemisphere in Winter. Journal of Climate, Vol. 1, n°9, p. 905-920, DOI: 10.1175/15200442(1988)001<0905:ABTYSC>2.0.CO;2
van Loon, H., and Labitzke, K., 1990. Association between the 11-Year Solar Cycle, the QBO, and the Atmosphere. Part IV: The Stratosphere, Not Grouped by the Phase of the QBO. Journal of Climate, Vol. 3, p. 827-837, https://www.jstor.org/stable/26196168
van Loon, H., and Labitzke, K., 1999. The signal of the 11-year solar cycle in the global stratosphere Journal of Atmospheric and Solar-Terrestrial Physics, Vol. 61, p. 53-61, DOI: 10.1016/S1364-6826(98)00116-3
van Loon, H., and Shea, D. J., 1999. A probable signal of the 11-year solar cycle in the troposphere of the northern hemisphere. Geophysical Research Letters, Vol. 26, Issue 18, p. 2893-2896, https://doi.org/10.1029/1999GL900596
van Loon, H., Meehl, G. A., and Milliff, R., 2003. The Southern Oscillation in the Early 1990s. Geophysical Research Letters, Vol. 30, NO. 9, 1478, 4 pp., DOI: 10.1029/2002GL016307
van Loon, H., Meehl, G. A., and Shea, D. J., 2007. Coupled air-sea response to solar forcing in the Pacific region during northern winter. Journal of Geophysical Research, Vol. 112, D02108, doi:10.1029/2006JD007378 van Loon, H., and Meehl, G. A., 2012. The Indian Summer Monsoon during peaks in the 11 year sunspot cycle. Geophysical Research Letters, Vol. 39, Issue 13, Article L13701, 5 pp., DOI: 10.1029/2012GL051977
Van Noorden, R., 2021. Hundreds of gibberish papers still lurk in the scientific literature. Nature, Vol. 594, p.160-161, https://www.nature.com/articles/d41586-021-01436-7
van't Hoff, J. H., 1884. Etudes de dynamique chimique, Amsterdam, Frederic Muller & Cie, 214 pp. van Wijngaarden, W. A., and Happer, W., 2019. Infrared Forcing by Greenhouse Gases. June 18, https://co2coalition.org/wpcontent/uploads/2022/03/Infrared-Forcing-by-Greenhouse-Gases-2019-Revised-3-7-2022.pdf van Wijngaarden, W. A., and Happer, W., 2020. Dependence of Earth’s Thermal Radiation on Five Most Abundant Greenhouse Gases, 8th June, https://arxiv.org/pdf/2006.03098.pdf, accessed and archived on October 27, 2020.
Van Wyk de Vries, M., Bingham, R. G., and Hein, A. S., 2017. A new volcanic province: an inventory of subglacial volcanoes in West Antarctica. In Siegert, M. J., Jamieson, S. S. R. & White, D. A. (eds) Exploration of Subsurface Antarctica: Uncovering Past Changes and Modern Processes. Geological Society, London, Special Publications, 461, 18 pp., https://doi.org/10.1144/SP461.7
Varadi, F., Runnegar, B., and Ghil, M., 2003. Successive Refinements in Long-Term Integrations of Planetary Orbits, Astrophysical Journal, Vol. 592, n°1, p. 620–630, DOI: 10.1086/375560
Vardoulakis, S., et al., 2014. Comparative assessment of the effects of climate change on heat-and cold-related mortality in the United Kingdom and Australia. Environmental Health Perspectives, Vol. 122, n°12, p. 1285-1292, DOI: 10.1289/ehp.1307524
Vasiliev, S. S., and Dergachev, V. A., 2002. The~ 2400-year cycle in atmospheric radiocarbon concentration: bispectrum of 14C data over the last 8000 years. Annales Geophysicae, Vol. 20, n°1, p. 115-120, https://doi.org/10.5194/angeo-20-115-2002
Vaughan, S., Bailey, R. J., and Smith, D. G., 2011. Detecting cycles in stratigraphic data: Spectral analysis in the presence of red noise. Paleoceanography, Vol. 26, PA4211, 15 pp., DOI:10.1029/2011PA002195
Veizer, J., Ala, D., Azmy, K., Bruckschen, P., Buhl, D., et al. 1999. 87Sr/86Sr, δ13C and δ18O evolution of Phanerozoic seawater. Chemical Geology, Vol. 161, Issues 1-3, p. 59–88, https://doi.org/10.1016/S0009-2541(99)00081-9
Veizer, J., 2005. Celestial Climate Driver: A Perspective from Four Billion Years of the Carbon Cycle. Geoscience Canada, Vol. 32, Number 1, p. 13-28, https://journals.lib.unb.ca/index.php/GC/article/view/2691
Veizer, J., Prokoph, A., 2015. Temperature and oxygen isotopic composition of Phanerozoic oceans. Earth-Science Reviews, Vol. 146, p. 92–104, https://doi.org/10.1016/j.earscirev.2015.03.008
Velichko, A A., Pisareva, V.V., Sedov, S.N., Sinitsyn, A.A., and Timireva, S.N., 2009. PALEOGEOGRAPHY OF KOSTENKI-14 (MARKINA GORA). Archaeology Ethnology & Anthropology of Eurasia, Vol. 37, n°4, p. 35–50, DOI: 10.1016/j.aeae.2010.02.002
Vérard, C., and Veizer, J., 2019. On plate tectonics and ocean temperatures. Geology, Vol. 47, Issue 9, p. 881-885, DOI: 10.1130/G46376.1
Vettoretti, G. and Peltier, W.R. 2004: Sensitivity of glacial inception to orbital and greenhouse gas climate forcing. Quaternary Science Reviews, Vol. 23, p. 499–519, DOI: 10.1016/j.quascirev.2003.08.008
Vettoretti, G. and Peltier, 2011: The Impact of Insolation, Greenhouse Gas Forcing and Ocean Circulation Changes on Glacial Inception. The Holocene, Vol. 21, Issue 5, p. 803-817, https://doi.org/10.1177/0959683610394885
Veyres, C., 2014. Sur le cycle du carbone et le delta13C: quelques figures. July 28, 2014, 26 pp., in French, https://www.lecolocritique.fr/app/download/9904091195/Notice+sur+le+delta13C++28+VII+2014.pdf, accessed and archived on December 2, 2020.
Veyres, C., 2018. Eleven facts you must know to avoid being deceived by the AGW. In: Basic Science of a Changing Climate: How processes in the Sun, Atmosphere and Ocean affect Weather and Climate, Mörner, N.-A., et al. (eds.), The Porto Climate Conference, https://www.researchgate.net/publication/326882331_Th_Porto_Climate_Conference_Volume, September 7th and 8th, p. 24-28.
Veyres, C., 2019a. N’ayez pas peur ! Onze faits démontrent qu’il n’y a pas et qu’il ne saurait y avoir de réchauffement climatique dû aux combustibles fossiles. June 4, 2019, 16 pp., in French, https://veyres48.monsiteorange.fr/file/c43a3c6027fa9f809096660afa5bd007.pdf, accessed and archived on December 1, 2020.
Veyres, C., 2019b. Réponses à des Questions Fréquemment Posées. November 18, in French,https://veyres48.monsiteorange.fr/file/74dda4454e4870dad9baeb1fa5961da1.pdf, accessed and archived on December 1, 2020.
Veyres, C., 2020a. Camille Veyres' web site with all resources, papers and foils. in French, https://veyres48.monsite-orange.fr/, accessed on December 1, 2020.
Veyres, C., 2020b. Faits et Fables. February 5, 92 pp., in French, https://veyres48.monsiteorange.fr/file/b3f779e13b3019ea19f1b6b1f35f50df.pdf, accessed and archived on December 1, 2020.
Veyres, C., 2020c. Notice succincte sur le réchauffement climatique anthropique. November 12, 2014, in French, https://www.lecolocritique.fr/app/download/9963895095/argumentaire+sur+le+rechauffement+climatique+anthropique+1 2+XI+2014+relu-2.pdf, accessed and archived on December 2, 2020.
Veyres, C., 2020d. Note sur le réchauffement climatique anthropique, June 5, in French, https://veyres48.monsiteorange.fr/file/7383b14918811931db9deb80ab71aaef.pdf, accessed and archived on December 1, 2020.
Veyres, C., 2020e. Sur la preuve de fraudes intentionnelles. June, 167 pp, in French, https://1drv.ms/b/s! Agk3YBF8dMbdn3CjJpnH8Li7EpE-?e=Ftcgd5, accessed and archived on December 1, 2020.
Veyres, C., and Maurin, J.C., 2020. Quelques rappels de physico-chimie pour évaluer les arguments visant à attribuer aux activités humaines la croissance du CO2 dans l’air, 29 IX 2020, 74 pp., in French, https://veyres48.monsiteorange.fr/file/4d012930af67ece070252d0b2f915b2f.pdf, accessed and archived on December 1, 2020.
Viaggi, P., 2021. Quantitative impact of astronomical and sun-related cycles on the Pleistocene climate system from Antarctica records. Quaternary Science Advances, Vol 4, Article 100037, 21 pp., https://doi.org/10.1016/j.qsa.2021.100037
Vidal, C. M., et al., 2016. The 1257 Samalas eruption (Lombok, Indonesia): The single greatest stratospheric gas release of the Common Era. Scientific Reports, Vol. 6, article 34868, DOI: 10.1038/srep34868
Villa, G., Fioroni, C., Persico, D., Roberts, A. P., and Florindo, F., 2013. Middle Eocene to Late Oligocene Antarctic glaciation/deglaciation and Southern Ocean productivity. Paleoceanography and palaeoclimatology, Vol. 29, Issues 3, pp. 223-237, https://doi.org/10.1002/2013PA002518
Villarini, G., Vecchi, G. A., Knutson, T. R., and Smith, J. A., 2011. Is the recorded increase in short‐duration North Atlantic tropical storms spurious. Journal of Geophysical Research Atmospheres, Vol. 116, D10114, 11 pp., DOI: 10.1029/2010JD015493 Vincent, C., 2010. L'impact des changements climatiques sur les glaciers alpins. These de doctorat en Sciences de la Terre et de l'Univers, Université Joseph Fourier, Grenoble 1, https://tel.archives-ouvertes.fr/tel-00596523/document, 212 pp.
Vink, A., Steffen , H., Reinhardt, L., and Kaufmann, G., 2007. Holocene relative sea-level change, isostatic subsidence and the radial viscosity structure of the mantel of northwest Europe. Quaternary Science Reviews, Vol. 26, p. 3249–3275, doi:10.1016/j.quascirev.2007.07.014
Vinós, J., 2016a. Nature Unbound I: The Glacial Cycle. Climate Etc., October 24th, 2016, https://judithcurry.com/2016/10/24/natureunbound-i-the-glacial-cycle/, accessed and archived on June 24, 2020.
Vinós, J., 2016b. Impact of the ~ 2400 yr solar cycle on climate and human societies. Climate Etc., September 20 th, 2016, https://judithcurry.com/2016/09/20/impact-of-the-2400-yr-solar-cycle-on-climate-and-human-societies/, accessed and archived on July 17, 2020.
Vinós, J., 2017a. Nature Unbound II: The Dansgaard-Oeschger Cycle. Climate Etc., February 17 th, 2017, https://judithcurry.com/2017/02/17/nature-unbound-ii-the-dansgaard-oeschger-cycle/, accessed and archived on July 13, 2020.
Vinós, J., 2017b. Nature Unbound III: Holocene climate variability (Part A). Climate Etc., April 30th, 2017, https://judithcurry.com/2017/04/30/nature-unbound-iii-holocene-climate-variability-part-a/, accessed and archived on July 13, 2020.
Vinós, J., 2017c. Nature Unbound III: Holocene climate variability (Part B). Climate Etc., May 28 th, 2017, https://judithcurry.com/2017/05/28/nature-unbound-iii-holocene-climate-variability-part-b/ , accessed and archived on July 13, 2020.
Vinós, J., 2017d. Nature Unbound IV – The 2400-year Bray cycle. Part A. Climate Etc., July 11th, 2017, https://judithcurry.com/2017/07/11/nature-unbound-iv-the-2400-year-bray-cycle-part-a/, accessed and archived on July 13, 2020.
Vinós, J., 2017e. Nature Unbound IV – The 2400-year Bray cycle. Part B. Climate Etc., July 16 th, 2017, https://judithcurry.com/2017/07/16/nature-unbound-iv-the-2400-year-bray-cycle-part-b/, accessed and archived on July 13, 2020.
Vinós, J., 2017f. Nature Unbound V – The elusive 1500-year Holocene cycle. Climate Etc., September 15 th, 2017, https://judithcurry.com/2017/09/15/nature-unbound-v-the-elusive-1500-year-holocene-cycle/, accessed and archived on July 14, 2020.
Vinós, J., 2017g. Nature Unbound VI – Centennial to millennial solar cycles. Climate Etc., December 2 nd, 2017, https://judithcurry.com/2017/12/02/nature-unbound-vi-centennial-to-millennial-solar-cycles/, accessed and archived on July 13, 2020.
Vinós, J., 2018a. Nature Unbound VII – Climate change mechanisms. Climate Etc., January 21st, 2018, https://judithcurry.com/2018/01/21/nature-unbound-vii-climate-change-mechanisms/, accessed and archived on July 15, 2020.
Vinós, J., 2018b. Nature Unbound VIII – Modern global warming. Climate Etc., February 26 th, 2018, https://judithcurry.com/2018/02/26/nature-unbound-viii-modern-global-warming/, accessed and archived on July 14, 2020.
Vinós, J., 2018c. Nature Unbound IX – 21st Century Climate. Climate Etc., June 28th, 2018, https://judithcurry.com/2018/06/28/nature-unbound-ix-21st-century-climate-change/, accessed and archived on July 13, 2020.
Vinós, J., 2018d. Nature Unbound X – The next glaciation. Climate Etc., August 14 th, 2018, https://judithcurry.com/2018/08/14/nature-unbound-x-the-next-glaciation/, accessed and archived on July 13, 2020.
Vinós, J., 2022. Climate of the Past, Present and Future: A Scientific Debate 732. Critical Science Press, Madrid, CC BY-NC 4.0, ISBN: 97884-125867-0-1 (Hardcover), 279 pp.
Vinther, B. M., et al., 2009. Holocene thinning of the Greenland ice sheet. Nature, Vol. 461, Issue 7262, p. 385-388, https://doi.org/10.1038/nature08355. National Centers for Environmental Information, NESDIS, NOAA, U.S. Department of Commerce. Greenland Ice Sheet Holocene d18O, Temperature, and Surface Elevation. doi:10.1038/nature08355. Data: https://www.ncdc.noaa.gov/paleo-search/study/11148
Visser, K., Thunell, R., Stott, L., 2003. Magnitude and timing of temperature change in the Indo-Pacific warm pool during deglaciation. Nature, Vol 421, Issue 6919, p. 152–155, DOI: 10.1038/nature01297
Viterito, A., 2019. The Relationship Between Mid-Ocean Spreading Zone Seismic Activity and Global Temperatures Remains Strong Through 2018. International Journal of Environmental Sciences & Natural Resources, Vol. 20, Issue 3, 556039, p. 93-97, DOI: 10.19080/IJESNR.2019.20.556039
Viterito, A., 2022. 1995: An Important Inflection Point in Recent Geophysical History. International Journal of Environmental Sciences & Natural Resources, Vol. 29, Issue 5, Article 556271, 11 pp., DOI: 10.19080/IJESNR.2022.29.556271
Voiculescu, M., Usoskin, I., and Condurache-Bota, S., 2013. Clouds blown by the solar wind. Environmental Research Letters, Vol. 8, Number 4, Article 045032, 9 pp., doi:10.1088/1748-9326/8/4/045032
Volodin, E. M. , Diansky, N. A., and Gusev, A. V., 2010. Simulating present-day climate with the INMCM4.0 coupled model of the atmospheric and oceanic general circulations. Izvestiya Atmospheric and Oceanic Physics, Vol. 46, n°4, p. 414-431, DOI: 10.1134/S000143381004002X
Volodin, E. M. , Diansky, N. A., and Gusev, A. V., 2013. Simulation and prediction of climate changes in the 19th to 21st centuries with the Institute of Numerical Mathematics, Russian Academy of Sciences, model of the Earth’s climate system. Original Russian text: Известия
, Izvestiya AN. Fizika Atmosfery i Okeana, Vol. 49, n°4, p. 379-400.
Volodin, E. M. , Diansky, N. A., and Gusev, A. V., 2013. Izvestiya, 2013. Simulation and prediction of climate changes in the 19th to 21st centuries with the Institute of Numerical Mathematics, Russian Academy of Sciences, model of the Earth’s climate system. Atmospheric and Oceanic Physics, Vol. 49, n°4, p. 347–366, DOI: 10.1134/S0001433813040105
Volodin, et al., 2017. Simulation of Modern Climate with the New Version of the INM RAS Climate Model. Izvestiya, Atmospheric and Oceanic Physics, Vol. 53, n° 2, p. 142–155, DOI: 10.1134/S0001433817020128
Volodin, E. M, et al., 2018. Simulation of the modern climate using the INM-CM48 climate model. Russian Journal of Numerical Analysis and Mathematical Modelling, Vol. 33, n°6, p. 367-374, DOI: 10.1515/rnam-2018-0032
Volodin, E., and Gritsun, A., 2018. Simulation of observed climate changes in 1850–2014 with climate model INM-CM5. Earth System Dynamics, Vol. 9, p. 1235–1242, https://doi.org/10.5194/esd-9-1235-2018
Volokin, D., and ReLlez, L., 2014733. On the average temperature of airless spherical bodies and the magnitude of Earth’s atmospheric thermal effect. SpringerPlus, Vol. 3, Article 723, 21 pp., doi:10.1186/2193-1801-3-723
Voltaire, 1751. Le Siècle de LOUIS XIV, Paris, Garnier Frères, 421 p, https://www.academia.edu/39032279/Voltaire_Le_Siecle_de_Louis_XIV
von der Heydt, A., and Dijkstra, H. A., May 2006. Effect of ocean gateways on the global ocean circulation in the late Oligocene and early Miocene. Paleoceanography and Paleoclimatology, Vol. 21, Issue 1, PA1011, 18 pp., https://doi.org/10.1029/2005PA001149
von der Heydt, A., and Dijkstra, H. A., 2008. The effect of gateways on ocean circulation patterns in the Cenozoic. Global and Planetary Change, Vol. 62, Issues 1–2, p. 132–146, DOI: 10.1016/j.gloplacha.2007.11.006 von Hann, J., 1908. Handbuch der Klimatologie. 4th ed., Verlag J. Engelhorn, ISBN: 9783744631914, Stuttgart, 426 pp. There are three volumes. The first volume concerns general climatology; the second and third volumes deal with the climates of all parts of the world.
von Känel, L., Frölicher, T. L., and Gruber, N., 2017. Hiatus-like decades in the absence of equatorial Pacific cooling and accelerated global ocean heat uptake. Geophysical Research Letter, Vol. 44, Issue 15, p. 7909-7918, https://doi.org/10.1002/2017GL073578 von Storch, Zorita, E., Jones, J. M., et al., 2004. Reconstructing past climate from noisy data. Science, Vol. 306, Issue 5696, p. 679–682, DOI: 10.1126/science.1096109 von Storch, Zorita, E., 2005. Comment on "hockey sticks, principal components, and spurious significance" by S. McIntyre and R. McKitrick,’. Geophysical Research Letters, Vol. 32, Issue 20, L20701, 2 pp., https://doi.org/10.1029/2005GL022753 von Storch, H., Kiladis, G. and Madden, R., 2008a. Interview with Harry van Loon. GKSS 2005/8, Institute for Coastal Research, GKSS Research Centre, Geesthacht, Germany, ISSN 0344-9629, 40 pp, DOI : 10.13140/RG.2.2.2.19409.53609
732The pdf is free, but it is suggested to purchase the ebook for a modest sum and even better the magnificent paperbackversion. 733This paper has an erratum, see Nikolov and Zeller (2016).
von Storch, H., Zorita, E., González-Rouco, J. F., 2008b. Relationship between global mean sea-level and global mean temperature in a climate simulation of the past millennium. Ocean Dynamics, 58, p. 227–236. DOI: 10.1007/s10236-008-0142-9
von Storch, H., 2009. Good Science, Bad Politics, 'Climategate' reveals a concerted effort to emphasize scientific results useful to a political agenda. Wall Street Journal, December, 22, 2009, Subscriber access only, https://www.wsj.com/articles/SB10001424052748704238104574601443947078538, accessed on December 1, 2020. von Zahn, U., 1981. “Die Bedeutung des Kohlendioxids für das Klima der Planeten Erde und Venus“ [The importance of carbon dioxide for the climate of the planets Earth and Venus], Mitteilungen der Alexander von Humboldt-Stiftung [News from the Alexander von Humboldt Foundation], Kohlendioxid und Klima, Vol. 39, p. 15-23.
Voosen, P., 2016. Climate scientists open up their black boxes to scrutiny. Science, Vol. 354, Issue 6311, p. 401-402, DOI: 10.1126/science.354.6311.401
Voosen, P., 2022. Use of ‘too hot’ climate models exaggerates impacts of global warming. Science.org, May 4, 2022, and Science, Vol 376, Issue 6594, https://www.science.org/content/article/use-too-hot-climate-models-exaggerates-impacts-global-warming Wagner, F., et al., 1999. Century-Scale Shifts in Early Holocene Atmospheric CO 2 Concentration. Science, Vol. 284, Issue 5422, p. 1971-1973, DOI: 10.1126/science.284.5422.1971
Wagner, F., Aaby, B., and Visscher, H., 2002. Rapid atmospheric CO2 changes associated with the 8,200-years-B.P. cooling event. Proc. of the Natl. Acad. of Sci. of the U.S.A, Vol. 99, Issue 19, p. 12011–12014, doi: 10.1073/pnas.182420699
Wagner, G., et al., 2001. Presence of the solar de Vries cycle (205 years) during the last ice age. Geophysical Research Letters, Vol. 28, n°2, p. 303-306, https://doi.org/10.1029/2000GL006116
WAISDIC, 2020. West Antarctic Ice Sheet Divide Ice Core web site. WAIS Divide Ice Core Science Coordination Office (Desert Research Institute and University of New Hampshire), http://waisdivide.unh.edu/about/index.shtml, accessed on December 2, 2020.
Wallace, J. M., and Hobbs, P. V., 2006. Atmospheric Science, An introductory Survey. 2nd Edition, International Geophysics Series, Dmowska, R., Hartmann, D., Rossby, H. T., (Eds.), Vol. 92, ISBN 13: 978-0-12-732951-2, Elsevier, 483 pp., https://www.academia.edu/37366881/Atmospheric_science_wallace_and_hobbs_PDF
Wallace-Wells, D., 2017. Climate Scientist James Hansen: ‘The Planet Could Become Ungovernable’. Nymag.com, Intelligencer, July 12, 2017, https://nymag.com/intelligencer/2017/07/scientist-jim-hansen-the-planet-could-become-ungovernable.html, accessed and archived on October 10, 2020.
Walker, G. T., and Bliss, E. W., 1932. World Weather V. Memoirs of the Royal Meteorological Society, Vol. 4, n°36, p. 53-84.
Walker, G. P. L., 1981. The Waimihia and Hatepe plinian deposits from the rhyolitic Taupo Volcanic Centre. New Zealand Journal of Geology and Geophysics, Vol. 24, n°3, p. 305-324, https://doi.org/10.1080/00288306.1981.10422722
Walker, J. C. G., Hays, P. B., and Kasting, J. F., 1981. A Negative feedback mechanism for the long-term stabilization of Earths surfacetemperature. Journal of Geophysical Research Atmospheres, Vol. 86, NC10, p. 9776-9782, DOI: 10.1029/JC086iC10p09776
Walker, J. C. G., 1985. Carbon Dioxide on the Early Earth. Origins of Life, Vol. 16, p. 117-127.
Wallmann, K. 2001 The geological water cycle and the evolution of marine δ18O values. Geochemica Cosmochemica Acta, Vol. 65, n°15, p.2469-2485, DOI: 10.1016/S0016-7037(01)00603-2
Wallmann, K., et al., 2018. Gas hydrate dissociation off Svalbard induced by isostatic rebound rather than global warming. Nature Communications, Vol. 9, Article: 83, 9 pp., https://doi.org/10.1038/s41467-017-02550-9
Wang, C., Soden, B. J., Yang, W., and Vecchi, G. A., 2021. Compensation Between Cloud Feedback and Aerosol‐Cloud Interaction in CMIP6 Models. Geophysical Research Letters, Vol. 48, Issue 4, e2020GL091024, 10 pp., https://doi.org/10.1029/2020GL091024
Wang, K. J., et al., 2021. Group 2i Isochrysidales produce characteristic alkenones reflecting sea ice distribution. Nature Communications , Vol. 12, Article 15, https://doi.org/10.1038/s41467-020-20187-z
Wang, T., Surge, D., and Walker K. J., 2013. Seasonal climate change across the Roman Warm Period/Vandal Minimum transition using isotope sclerochronology in archaeological shells and otoliths, southwest Florida, USA. Quaternary International, Vol.308-309, p. 230-241, http://dx.doi.org/10.1016/j.quaint.2012.11.013
Wang, W., et al. 2013. Variations in atmospheric CO2 growth rates coupled with tropical temperature. Proc. of the Natl. Acad. of Sci. of the U.S.A., Vol. 110, n°32, p13061-13066, www.pnas.org/cgi/doi/10.1073/pnas.1219683110, http://www.pnas.org/content/110/32/13061.full.pdf
Wang, W., Zender, C. S., and van As, D. 2018. Temporal characteristics of cloud radiative effects on the Greenland ice sheet: discoveries from multiyear automatic weather station measurements. Journal of Geophysical Research, Vol. 123, Issue 20, p. 11,348-11,361, https://doi.org/10.1029/2018JD028540, https://www.osti.gov/pages/servlets/purl/1611964
Wang, W.-C., and Stone, P. H., 1980. Effect of Ice-Albedo Feedback on Global Sensitivity in a One-Dimensional Radiative-Convective Climate Model. Journal of the Atmospheric Sciences, Vol. 37, Issue 3., p. 545-552, https://doi.org/10.1175/15200469(1980)037<0545:EOIAFO>2.0.CO;2
Wang, X., et al., 2014. A two-fold increase of carbon cycle sensitivity to tropical temperature variations, Nature, Vol. 502, p. 212-215, DOI: 10.1038/nature12915
Wang, Y., et al., 2005. The Holocene Asian monsoon: links to solar changes and North Atlantic climate. Science, Vol. 308, Issue 5723, p. 854-857, DOI: 10.1126/science.1106296.
Wang, Y.-M., Lean J.L., and Sheeley, N.R.J., 2005. Modeling the Sun’s magnetic field and irradiance since 1713. The Astrophysical Journal, Vol. 625, p. 522-538, DOI: 10.1086/429689
Wang, Y., et al., 2019. A New 200‐Year Spatial Reconstruction of West Antarctic Surface Mass Balance. Journal of Geophysical Research Atmospheres, Vol. 124, Issue 10, p. 5282-5295, https://doi.org/10.1029/2018JD029601
Wanner, H., et al., 2001. North Atlantic Oscillation - Concepts and Studies. Surveys in Geophysics, Vol. 22, p. 321-382, https://doi.org/10.1023/A:1014217317898
Wanner, H., et al., 2011. Structure and origin of Holocene cold events. Quaternary Science Reviews, Vol. 30, Issues 21–22, p. 31093123, https://doi.org/10.1016/j.quascirev.2011.07.010
Wanner, H., and Brönnimann, S., 2012. Is there a global Holocene climate mode? PAGES news, Vol. 20, n°1, p. 44-45, https://doi.org/10.22498/pages.20.1.44
Wanninkhof, R., and McGillis, W. R., 1999. A cubic relationship between air-sea CO 2 exchange and wind speed. Geophysical Research Letters, Vol. 26, Issue 13, p.1889-1892, https://doi.org/10.1029/1999GL900363
Wanninkhof, R., et al., 2009. Advances in Quantifying Air-Sea Gas Exchange and Environmental Forcing. Annual Review of Marine Science, Vol. 1, p. 213-244, https://doi.org/10.1146/annurev.marine.010908.163742
Wanninkhof, R., et al., 2013. Global ocean carbon uptake: magnitude, variability and trends. Biogeosciences, Vol. 10, p. 1983-2000, https://doi.org/10.5194/bg-10-1983-2013
Ward, B. and Dubos, R. J., 1972. Only one earth : the care and maintenance of a small planet (an unofficial report commissioned by the Secretary-General of the United Nations Conference on the Human Environment), Publisher: Andre Deutsch Ltd (May 25, 1972), ISBN 10: 0233963081 ISBN 13: 9780233963082, 304 pp.
Ward, P. D., and Brownlee, D., 2000. Rare Earth: Why Complex Life Is Uncommon in the Universe. Copernicus, ISBN: 9780387952895, 338 pp.
Ward, J. K., et al., 2005. Carbon starvation in glacial trees recovered from the La Brea tar pits, southern California. Proc. of the Natl. Acad. of Sci. of the U.S.A., Vol. 102, Issue 3, p. 690-694, https://doi.org/10.1073/pnas.0408315102
Washington, W. M., and VerPlank, L., 1986. A Description of Coupled General Circulation Models of the Atmosphere and Oceans Used for Carbon Dioxide Studies. NCAR Technical Note, Atmospheric Analysis and Prediction Division, NCAR/TN-271 +EDD, 29pp.
Waterschoot van der Gracht, W. A. J. M., et al., 1928. Theory of Continental Drift: A Symposium on the Origin and Movement of Land Masses Both Inter-Continental and Intra-Continental, as Proposed by Alfred Wegener. American Association of Petroleum Geologists, American Association of Petroleum Geologists, 15 Chapters, https://pubs.geoscienceworld.org/aapg/books/book/1498/Theory-of-Continental-DriftA-Symposium-on-the ISBN electronic: 9781629812595, DOI: https://doi.org/10.1306/SV2329
Watts, A., 2008. Now THIS is interesting: Pielke on Dr. Joanne Simpson . February 27, 2008, accessed and archived on June 12, 2020. https://wattsupwiththat.wordpress.com/2008/02/27/now-this-is-interesting-pielke-on-dr-joanne-simpson/ Watts, A., 2012. Hansen and Schmidt of NASA GISS under fire for climate stance. April, 10, https://wattsupwiththat.com/2012/04/10/hansen-and-schmidt-of-nasa-giss-under-fire-engineers-scientists-astronauts-asknasa-administration-to-look-at-emprical-evidence-rather-than-climate-models/, accessed and archived on September 22, 2020.
Watts, A., 2013. Tail wagging the dog – IPCC to rework AR5 to be 'consistent with the SPM'. October 12, 2013, https://wattsupwiththat.com/2013/10/12/tail-wagging-the-dog-ipcc-to-rework-ar5-to-be-consistent-with-the-spm/, accessed and archived on December 2, 2020.
Watts, A., 2015. One of the longest running climate prediction blunders has disappeared from the Internet. November 12, 2015, https://wattsupwiththat.com/2015/11/12/one-of-the-longest-running-climate-prediction-blunders-has-disappeared-fromthe-internet/, accessed and archived on December 2, 2020.
Watts, A., 2017. An Informative Interview with István Markó (1956 – 2017). 28 October, 2017, https://wattsupwiththat.wordpress.com/2017/10/28/information-interview-with-istvan-marko/, accessed and archived on December 2, 2020.
WB, 2014. World Development Indicators 2014. The World Bank, International Bank for Reconstruction and Development / The World Bank, 144 pp., DOI: 10.1596/978-1-4648-0163-1, accessed and archived on October 19, 2020. https://openknowledge.worldbank.org/bitstream/handle/10986/18237/9781464801631.pdf
WBGU, 2011. Main Report, Changing World, Social Contract for a Great Transformation. Scientific advisory board of the federal government on global environmental changes, Berlin, ISBN 978-3-936191-38-7, 448 pp. https://www.wbgu.de/fileadmin/user_upload/wbgu/publikationen/hauptgutachten/hg2011/pdf/wbgu_jg2011.pdf, accessed and archived on June 5, 2020.
Weart, S., 2010. The development of general circulation models of climate. Studies in History and Philosophy of Science Part B: Studies in History and Philosophy of Modern Physics, Vol. 41, Issue 3, p. 208-217, https://doi.org/10.1016/j.shpsb.2010.06.002
Weedon, G.P., 2003. Time-series Analysis and Cyclostratigraphy - Examining Stratigraphic Records of Environmental Cycles. Cambridge, UK: Cambridge University Press, 259pp, Introduction of the book available at https://assets.cambridge.org/97805216/20017/sample/9780521620017ws.pdf, accessed and archived on August 6, 2020.
Wegener, A., 1929. Die Entstehung der Kontinente und Ozeane. Druck und Verlag von Friedr. Vieweg & Sohn Akt.-Ges, 151 pp., https://ia800502.us.archive.org/11/items/Entstehung1929/Entstehung1929.pdf
Wegener, A., 2002. The Origin of Continents. Translated by Roland von Huene, International Journal of Earth Sciences (Geologische Rundschau), Vol. 91, p. S4–S17, DOI 10.1007/s00531-002-0271-1
Weisberger, M., 2021. Antarctica's 'Doomsday Glacier' could meet its doom within 3 years. www.space.com December 21, 2021 https://www.space.com/agu-antarctica-thwaites-glacier-future, accessed and archived July 2, 2022.
Weisheimer, A., Doblas-Reyes, F. J., Jung, T., and Palmer, T. N., 2011. On the predictability of the extreme summer 2003 over Europe. Geophysical Research Letters, Vol. 38, Issue 5, L05704, 5 pp., https://doi.org/10.1029/2010GL046455
Weiss, H., 2016. Global megadrought, societal collapse and resilience at 4.2-3.9 ka BP across the Mediterranean and west Asia. Past Global Changes Magazine, Vol. 24, n°2, p. 62-63, DOI: 10.22498/pages.24.2.62
Weiss, H., 2017a. 4.2 ka BP Megadrought and the Akkadian Collapse. In: Megadrought and Collapse: from Early Agriculture to Angkor, Harvey Weiss (ed.), Oxford University Press, ISBN 978-0-19-932919-9, p. 93-159.
Weiss, H., 2017b. Megadrought, Collapse, and Causality. In: Megadrought and Collapse: from Early Agriculture to Angkor, Harvey Weiss (ed.), Oxford University Press., ISBN 978-0-19-932919-9, p. 1-31.
Weiss, R F., 1974. Carbon dioxide in water and seawater: the solubility of a non ideal gas. Marine Chemistry, Vol. 2, p.203-215. DOI: 10.1016/0304-4203(74)90015-2
Wegman, E. J., Scott, D. W., and Said, Y. H., 2006. Ad Hoc Committee Report on the ‘Hockey Stick’ Global Climate Reconstruction, 92pp. https://www.cjoint.com/doc/19_11/IKektrDC63e_07142006-wegman-report.pdf, accessed May and archived on December 2, 2020.
Wegman, E. J., Scott, D. W., and Said, Y. H., 2010. Ad Hoc Committee Report on the ‘Hockey Stick’ Global Climate Reconstruction, SPPI Reprint Series, April 26, 92pp. http://scienceandpublicpolicy.org/wp-content/uploads/2010/07/ad_hoc_report.pdf, accessed and archived on February 2, 2021.
Wheeler, L. F., and Mathias, D. L., 2019. Effects of asteroid property distributions on expected impact rates. Icarus, Vol 321, p. 767777, https://doi.org/10.1016/j.icarus.2018.12.034
WHO, 2003. Climate change and human health, RISKS AND RESPONSES. McMichael, A. J., Campbell-Lendrum, D.H., Corvalán, C.F., Ebi, K.L., Githeko, A.K., Scheraga, J.D., Woodward, A., (eds.), World Health Organization, ISBN 92 4 156248 X, 306 pp, https://www.who.int/globalchange/publications/climchange.pdf?ua=1, accessed and archived on December 2, 2020. Wickramasinghe, N. C., 2020. Is the 2019 novel coronavirus related to a spike of cosmic rays? Advances in Genetics, Vol. 106, p. 119122, doi: 10.1016/bs.adgen.2020.06.003
Wickremesinghe, R., 2018. Sri Lanka PM: This is how I will make my country rich by 2025. Speech first published as an article on the WEF, now deleted!, but available at the Sunday Times, https://www.sundaytimes.lk/180902/news/pm-this-is-how-i-willmake-my-country-rich-by-2025-309660.html, presentation at the 27th World Economic Forum (WEF) on ASEAN in Hanoi, Vietnam from 11 to 12 September 2018, accessed and archived on July 25, 2022.
Wielens, H., Oakey, G., Haggart, J., and Currie, L., 2009. Geological Field Work on Magnificent Bylot Island. p. 22-25, in: Bedford Institute of Oceanography - Annual Reviews, 2009, https://www.dfo-mpo.gc.ca/science/Publications/index-eng.htm and https://waves-vagues.dfo-mpo.gc.ca/Library/353990.pdf, accessed and archived on October 29, 2020.
Wilde, S. P. R., and Mulholland, P., 2020. Return to Earth- A New Mathematical Model of the Earth's Climate. International Journal of Atmospheric and Oceanic Sciences, Vol. 4, Issue 2, p. 36-53. doi: 10.11648/j.ijaos.20200402.11 Williams, G., 1999. Hayek's critique of constructivism: A Libertarian Appraisal. Economic Notes No. 85, 10 pp., ISBN 1 85637 446 7 Williams, M., Ambrose, S. H., van de Kaars, S., and Ruehlemann, C., 2009. Environmental Impact of the 73ka Toba super eruption in South Asia. Palaeogeography Palaeoclimatology Palaeoecology, Vol. 284, Issues 3-4, p. 295-314, DOI: 10.1016/j.palaeo.2009.10.009
Willson, R. C., 2014. ACRIM3 and the Total Solar Irradiance database. Astrophysics and Space Science, Vol. 352, 12 pp., DOI: 10.1007/s10509-014-1961-4
Wisdom, J., and Holman, M., 1991. Sympletic Maps for the N-Body Problem. Astronomical Journal, Vol. 102, n°4, p. 1528-1538. Wisdom, J., 1992. Long-Term Evolution of the Solar System. Proc. IAU Symp. no. 152: Chaos, Resonance, and Collective Dynamical Phenomena in the Solar System, FerrazMello, S., Ed., Dordrecht: Kluwer, 1992, p. 17–24.
Witteman, W. J., 2020a. The Absorption Of Thermal Emitted Infrared Radiation By CO 2. April 3, 2021, https://principiascientific.org/the-absorption-of-thermal-emitted-infrared-radiation-by-co2/, accessed and archived on February 24, 2021.
Witteman, W. J., 2020b. CO2 infrared absorption. Climate Auditor, Mathematical analysis of empirical climate data. https://climateauditor.com/co2-infrared-absorption/ accessed and archived on February 24, 2021.
Witton, M. P., 2008. A new approach to determining pterosaur body mass and its implications for pterosaur flight. Zitteliana, Vol. B28, p. 143-158.
Witton, M. P., and Naish, D., 2008. A Reappraisal of Azhdarchid Pterosaur Functional Morphology and Paleoecology. PLoS One, Vol. 3, Issue 5, Article e2271, doi: 10.1371/journal.pone.0002271
Witton, M. P., and Habib, M., B., 2010. On the Size and Flight Diversity of Giant Pterosaurs, the Use of Birds as Pterosaur Analogues and Comments on Pterosaur Flightlessness. PLoS ONE, Vol. 5, Issue 11, Article e13982, https://doi.org/10.1371/journal.pone.0013982
Witze, A., 2012. Greenland enters melt mode, Island-wide thaw is one for the record books. ScienceNews, August 2, 2012, https://www.sciencenews.org/article/greenland-enters-melt-mode, subscribers only, accessed on December 2, 2020. WMO/UNEP, 1988. Report of the first session of the WMO/UNEP Intergovernmental Panel on Climate Change (IPCC). Geneva, 9-11 November 1988, TD-No. 267, 34 pp., https://library.wmo.int/doc_num.php?explnum_id=4858
WMO, 2006. Summary Statement on Tropical Cyclones and Climate Change. https://web.archive.org/web/20090325193707/http://www.wmo.int/pages/prog/arep/press_releases/2006/pdf/iwtc_sum mary.pdf, accessed and archived on July 6, 2020.
WMO, 2021. La Niña has peaked, but impacts continue. February 9, 2021, https://public.wmo.int/en/media/press-release/la-niñahas-peaked-impacts-continue, accessed and archived on April 5, 2021.
Wong, E. W., and Minnett, P. J., 2018. The Response of the Ocean Thermal Skin Layer to Variations in Incident Infrared Radiation. Journal of Geophysical Research Oceans, Vol. 123, Issue 4, p. 2475-2493, https://doi.org/10.1002/2017JC013351
Wood, R. W., 1909. Note on the Theory of the Greenhouse. The London, Edinburgh, and Dublin Philosophical Magazine and Journal of Science, Vol. 17, Series 6, p. 319–320, DOI: 10.1080/14786440208636602.
Wood, R. R., Lehner, F., Pendergrass, A., Schlunegger, S., and Rodgers, K., 2020. What can we learn from single model initialcondition large ensembles (SMILEs)? A Comparison of Multiple SMILEs for Precipitation. EGU General Assembly 2020, Online, 4–8 May 2020, EGU2020-19202, https://doi.org/10.5194/egusphere-egu2020-19202
Wöppelmann, G., Martin Miguez, B., Bouin, M.-N., and Altamimi, Z., 2007. Geocentric sea-level trend estimates from GPS analyses at relevant tide gauges world-wide. Global and Planetary Change, Vol. 57, Issue 3-4, p.396–406, https://doi.org/10.1016/j.gloplacha.2007.02.002
worldometers, 2020. Global Fossil Carbon Dioxide emissions by Year. https://www.worldometers.info/co2-emissions/co2-emissionsby-year/, accessed September 2020 and archived on December 2, 2020.
Worrall, E., 2019. Swedish Power Shortages Because of Renewable Energy. May 4th 2019, https://wattsupwiththat.com/2019/05/04/swedish-power-shortages-looming-because-of-their-renewable-energy-push/, accessed and archived on February 11, 2021.
Wratt, D., Salinger, J., Bell, R., Lorrey, D., and Mullan, B., 2020. Past climate variations over New Zealand. https://niwa.co.nz/ourscience/climate/information-and-resources/clivar/pastclimate, accessed and archived on October 30, 2020.
Wrightstone, G., 2017. Inconvenient Facts: The science that Al Gore doesn't want you to know. Silver Crown Productions, LLC, ISBN13 : 978-1545614105, 158 pp.
Wu, C.-J. , Krivova, N. A., Solanki, S. K., and Usoskin, I. G., 2018. Solar total and spectral irradiance reconstruction over the last 9000 years. Astronomy and Astrophysics, Vol. 620, Article A120, 12 pp., https://doi.org/10.1051/0004-6361/201832956
Wu, H. C., et al., 2018. Surface ocean pH variations since 1689 CE and recent ocean acidification in the tropical South Pacific. Nature Communications, Vol. 9, Article 2543, 13 pp., DOI: 10.1038/s41467-018-04922-1
Wunsch, C., 2000. On sharp spectral lines in the climate record and the millennial peak. Paleoceanography, Vol. 15, Issue 4, p. 417–424, https://doi.org/10.1029/1999PA000468
Wunsch, C., 2003. The spectral description of climate change including the 100 ky energy. Climate Dynamics, Vol. 20, p. 353–363, DOI 10.1007/s00382-002-0279-z, https://www.whoi.edu/cms/files/wunsch03cd_269504.pdf
Wunsch, C., 2004. Quantitative estimate of the Milankovitch‐forced contribution to observed Quaternary climate change. Quaternary Science Reviews, Vol. 23, p. 1001–1012, DOI: 10.1016/j.quascirev.2004.02.014, https://www.whoi.edu/cms/files/wunsch04qsr_54723.pdf
Wunsch, C., Schmitt, R. W., and Baker, D. J., 2013. Climate change as an intergenerational problem. Proc. of the Natl. Acad. of Sci. of the U.S.A., Vol. 110, n°12, p. 4435-4436, https://doi.org/10.1073/pnas.1302536110
Wunsch, C., and Heimbach, P., 2014. Bidecadal Thermal Changes in the Abyssal Ocean. Journal of Physical Oceanography, Vol. 44, Issue 8, p. 2013-2030, http://dx.doi.org/10.1175/jpo-d-13-096.1
Xu, Y., et al., 2016. The local spiral structure of the Milky Way. Science Advances, Vol. 2, no. 9, e1600878, 5 pp., DOI: 10.1126/sciadv.1600878
Yao, B., et al., 2020. Transforming carbon dioxide into jet fuel using an organic combustion-synthesized Fe-Mn-K catalyst. Nature Communications volume 11, Article number: 6395, 12 pp., https://doi.org/10.1038/s41467-020-20214-z
Yeo, S., 2019a. Where climate cash is flowing and why it’s not enough. Nature News Feature, Vol. 573, p. 328-331, DOI: 10.1038/d41586-019-02712-3, https://www.nature.com/articles/d41586-019-02712-3, accessed and archived on July 6, 2020.
Yeo, S., 2019b. Green Climate Fund attracts record US$9.8 billion for developing nations. Nature News, DOI: https://doi.org/10.1038/d41586-019-03330-9, accessed and archived on November 6, 2020.
Yi, L., et al., 2016. Plio-Pleistocene evolution of Bohai Basin (East Asia): Demise of Bohai Paleolake and transition to marine environment. Scientific Reports, Vol. 6, 29403, 9 pp., DOI: 10.1038/srep29403
Yim, W., 2022. Volcanism and Climate Change. 40th Geological Society of Hong Kong Anniversary Conference on Living Geology, 26th August, 6 pp.
York, J., Dowsley, M., Cornwell, A., Kuc, M., and Taylor, M., 2016. Demographic and traditional knowledge perspectives on the current status of Canadian polar bear subpopulations Ecology and Evolution, Vol. 6, Issue 9, p. 2897-2924, https://doi.org/10.1002/ece3.2030
Young, J. A. T., and Hastenrath, S., 1987. Glaciers of the Middle East and Africa. U.S. Geologigal Survey Professional Paper 1386-G-3, Williams, Jr., R. S. et al. (eds.), G49-G70, https://pubs.usgs.gov/pp/p1386g/africa.pdf
Young, S. A., Saltzman, M. R., Ausich, W. I., Desrochers, A., and Kaljo, D., 2010. Did changes in atmospheric CO 2 coincide with latest Ordovician glacial-interglacial cycles? Palaeogeography, Palaeoclimatology, Palaeoecology, Vol. 296, p. 376–388, DOI: 10.1016/j.palaeo.2010.02.033
Young, N. S., Ioannidis, J. P. A. and Al-Ubaydli, O., 2008. Why Current Publication Practices May Distort Science, PLoS Medicine, Vol. 5, Issue 10, article: e201, p. 1418-1422, https://journals.plos.org/plosmedicine/article/file? type=printable&id=10.1371/journal.pmed.0050201
Youngren, S., 2019. Why scientific consensus is useless (at best). July 20, https://godevidence.com/2019/07/scientific-consensus-isuseless/, accessed and archived on November 13, 2020.
Yousef, S. M., 2000. The solar Wolf-Gleissberg cycle and its influence on the Earth. ICEHM2000, Proceedings of the International Conference on the Environmental Hazards Mitigation, p. 266-292.
Ypersele van, J.-P., 2019. Climate change "denial", the role of climate confusers, and their evolving strategies: an introduction –Presentation at the European Parliament, 37 slides,, https://www.europarl.europa.eu/cmsdata/162142/Presentation %20Jean-Pascal%20van%20Ypersele%20.pdf, accessed and archived on December 2, 2020.
Yu, P., et al., 2018. Efficient In-Cloud Removal of Aerosols by Deep Convection. Geophysical Research Letters, Vol. 46, 9 pp., DOI: 10.1029/2018GL080544
Zachos, J. C., Lohmann, K. C., Walker, J. C. G, and Wise, S. W., 1993. Abrupt climate change and transient climates during the Paleogene: a marine perspective. The Journal of Geology, Vol. 101, p. 191-213, DOI: 10.1086/648216
Zachos, J., Pagani, M., Sloan, L., Thomas, E., Billups, K., 2001. Trends, Rhythms, and Aberrations in Global Climate 65 Ma to Present. Science, Vol.27, Issue 5517, p. 686-693, DOI: 10.1126/science.1059412
Zachos, J. C., Dickens, G. R., and Zeebe, R. E., 2008 An Early Cenozoic perspective on greenhouse warming and carbon cycle dynamics. Nature, Vol. 451, p. 279-283, DOI: 10.1038/nature06588
Zágoni, M., 2008. Paleoclimatic Consequences of Dr. Miskolczi's Greenhouse Theory. The Heartland Institute's 2008 International Conference on Climate Change, 12 pp., https://friendsofscience.org/assets/documents/zagoni.pdf, accessed and archived on November 19, 2020.
Zahn, J.-P, 1977. Tidal friction in close binary stars. Astronomy and Astrophysics, Vol. 57, no. 3, p. 383-394.
Zahn, J.-P, 1992. Circulation and turbulence in rotating stars. Astronomy and Astrophysics, Vol. 265, no. 1, p. 115-132.
Zanchettin, D, et al., 2013. Delayed winter warming: A robust decadal response to strong tropical volcanic eruptions? Geophysical Research Letters, Vol. 40, n° 1, p. 204-209, https://doi.org/10.1029/2012GL054403
Zanon, M., Davis, B. A. S., Marquer, L., Brewer, S., and Kaplan, J. O., 2018. European Forest Cover During the Past 12,000 Years: : A Palynological Reconstruction Based on Modern Analogs and Remote Sensing. frontiers in Plant Science, Vol. 9, Article 253, https://doi.org/10.3389/fpls.2018.00253
Zarli, A., Poyet, P., Debras, P., 1997. Integrating emerging IT paradigms for the Virtual Enterprise: the VEGA platform, Proc. of the 4th International Conference on Concurrent Enterprising (ICE’97), Oct. 8-10, Nottingham, UK, p. 347-359, DOI: 10.13140/2.1.4027.7449
Zarli, A., and Poyet, P., 1999a. Distributed architectures and components for the virtual enterprises. Proc. 5th International Conference on Concurrent Enterprising (ICE'99), La Haye, Vol 1. p. 253-263, DOI: 10.13140/2.1.2848.0960
Zarli , A., and Poyet, P., 1999b. A Framework for Distributed Information Management in the Virtual Enterprise: The Vega Project. In: Camarinha-Matos, L. M., Afsarmanesh, H., (eds.) Infrastructures for Virtual Enterprises. PRO-VE 1999, IFIP - The International Federation for Information Processing, Vol 27, Springer, Boston, MA. https://doi.org/10.1007/978-0-387-35577-1_19
Zarli, A., and Poyet, P., 2017. A Quarter Century of Work to Revolutionize Architecture, Engineering and Construction Enterprise Information Systems. Journal of Civil Engineering and Architecture, Vol. 11, p. 715-735, DOI: 10.17265/19347359/2017.08.001
Zeebe, R. E., Sanyal, A., Ortiz, J. D., and Wolf-Gladrow, D. A., 2001. A theoretical study of the kinetics of the boric acid–borate equilibrium in seawater. Marine Chemistry, Vol. 73, p. 113–124, https://doi.org/10.1016/S0304-4203(00)00100-6
Zeebe, R. E., and Wolf-Gladrow, D. A., 2001. CO2 in Seawater- Equilibrium, Kinetics, Isotopes. Elsevier, Oceanography Series 65, Amsterdam, 2001, (Paperback) ISBN: 0444509461, http://geosci.uchicago.edu/~kite/doc/Zeebe_CO2_In_Seawater_Ch_1.pdf
Zelinka, M., et al., 2020. Causes of Higher Climate Sensitivity in CMIP6 Models. Geophysical Research Letters, Vol. 47, Issue 1, 12pp., DOI: 10.1029/2019GL085782
Zhai, Q., 2016. Evidence for the Effect of Sunspot Activity on the El Niño/Southern Oscillation. New Astronomy, Vol. 52, DOI: 10.1016/j.newast.2016.09.004.
Zhang, Z., Wang, H., Guo, Z., and Jiang, D., 2006. Impact of topography and land-sea distribution on East Asian paleoenvironmental patterns. Advances in Atmospheric Sciences, Vol. 23, Issue 2, p. 258-266, DOI: 10.1007/s00376-006-0258-0
Zhang, Z., Leduc, G., and Sachs, J. P., 2014. El Niño evolution during the Holocene revealed by a biomarker rain gauge in the Galápagos Islands. Earth and Planetary Science Letters, Vol. 404, p. 420-434, http://dx.doi.org/10.1016/j.epsl.2014.07.013
Zhang, L., Tinsley, B. A., and Zhou, L. 2020. Low Latitude Lightning Activity Responses to Cosmic Ray Forbush Decreases. Geophysical Research Letters, Vol. 47, Article: e2020GL087024, https://doi.org/10.1029/2020GL087024
Zhao, Q, et al., 2021. Global, regional, and national burden of mortality associated with non-optimal ambient temperatures from 2000 to 2019: a three-stage modelling study. The Lancet, Planetary Health, Vol. 5, Issue 7, E415-E425, https://doi.org/10.1016/S2542-5196(21)00081-4
Zharkova, V. V. , Shepherd, S. J., Popova, E., and Zharkov, S. I., 2015. Heartbeat of the Sun from Principal Component Analysis and prediction of solar activity on a millenium timescale. Nature Scientific Reports, Vol. 5, Article number: 15689, 11 pp., DOI: 10.1038/srep15689
Zharkova, V. V., Shepherd, S. J., Zharkov, S. I., and Popova E., 2019. Reinforcing a Double Dynamo Model with Solar-Terrestrial Activity in the Past Three Millennia. Proceedings of the International Astronomical Union 13(S335), DOI: 10.1017/S1743921317010912
Zharkova, V., 2020. Modern Grand Solar Minimum will lead to terrestrial cooling. Temperature, p. 217-222, https://doi.org/10.1080/23328940.2020.1796243
Zheng, X., Li, Q., Zhou, T., et al., 2022. Description of historical and future projection simulations by the global coupled E3SMv1.0 model as used in CMIP6. Geoscientific Model Development, Vol. 15, p. 3941–3967, https://doi.org/10.5194/gmd-15-39412022
Zhou, L., Tinsley, B. A., Chu, H., and Xiao, Z., 2016. Correlations of global sea surface temperatures with the solar wind speed. Journal of Atmospheric and Solar-Terrestrial Physics, Vol. 149, p. 232–239,https://doi.org/10.1016/j.jastp.2016.02.010
Zhu, J., Poulsen, C. J., and Otto-Bliesner, B. L, 2020. High climate sensitivity in CMIP6 model not supported by paleoclimate. Nature Climate Change, Vol. 10, p. 378-379, https://doi.org/10.1038/s41558-020-0764-6
Zhu, J., et al., 2021. Assessment of Equilibrium Climate Sensitivity of the Community Earth System Model Version 2 Through Simulation of the Last Glacial Maximum. Geophysical Research Letters, Vol. 48, Issue 3, Article e2020GL091220, https://doi.org/10.1029/2020GL091220
Zhu, Z., et al., 2016. Greening of the Earth and its drivers. Nature climate change. Vol. 6, n°8, p.791-795, DOI: 10.1038/NCLIMATE3004
Zickfeld, K., et al., 2007. Expert judgements on the response of the Atlantic meridional overturning circulation to climate change. Climatic Change, Vol. 82, p. 235-265, DOI: 10.1007/s10584-007-9246-3
Zielinski, G. A., Mayewski, P. A., Meeker, L. D., Whitlow, S. I., and Twickler, M. S., 1996. Potential atmospheric impact of the Toba mega-eruption 71,000 years ago. Geophysical Research Letters, Vol. 23, n°8, p.837–840, https://doi.org/10.1029/96GL00706
Zobin, V. M., 2018. An Overview of the Dynamics of the Volcanic Paroxysmal Explosive Activity, and Related Seismicity, at Andesitic and Dacitic Volcanoes (1960–2010). frontiers in Earth Science, Vol. 6, Article 46, 16 pp., https://doi.org/10.3389/feart.2018.00046
Zubrin, R., 2012. Merchants of Despair: Radical Environmentalists, Criminal Pseudo-Scientists, and the Fatal Cult of Antihumanism Encounter Books, (New Atlantis Books), ISBN: 9781594035692, 328 pp.
Zwally, H. J., et al., 2012. Mass Gains of the Antarctic Ice Sheet Exceed Losses. ISMASS (Ice-Sheet Mass Balance and Sea Level) Workshop of SCAR Scientific Committee on Antarctic Research, Portland. https://ntrs.nasa.gov/search.jsp?R=20120013495, accessed and archived on June 5, 2020.
Zwally, H. J., et al., 2015. Mass gains of the Antarctic ice sheet exceed losses. Journal of Glaciology, Vol. 61, No. 230, p. 1019-1036, https://doi.org/10.3189/2015JoG15J071
AABVAntarctic Bottom Water
AAMAtmospheric Angular Momentum
AAOAntarctic oscillation
ACCAntarctic Circumpolar Current
ACDAragonite Compensation Depth (see footnote p.177)
ACRAntarctic Cold Reversal
AIMAntarctic Isotope Maximum warm events
ALAeronomy Laboratory of NOAA, USA
AMOAtlantic Multidecadal Oscillation
AMOCAtlantic Meridional Overturning Circulation
AMSAccelerator mass spectrometry
AMSU-BAdvanced Microwave Sounding Unit
AOArctic Oscillation
ARCNASA Ames Research Center, USA
ARMAtmospheric Radiation Monitoring
ARTSAtmospheric Radiative Transfer Simulator
ATPAdenosine 5'-triphosphate. ATP is a “currency unit” for energy in cells.
BABølling–Allerød warm period
BAOBronze Age Optimum, warm period around1350 BC – 1200 BC
BCPBiological Carbon Pump
BHMBayesian Hierarchical Modelling
C3plants are plants in which the initial product of the assimilation of carbon dioxide through photosynthesis is 3-phosphoglycerate, which contains 3 carbon atoms
C4plants—including maize, sugarcane, and sorghum—avoid photo-respiration by using another enzyme called PEP during the first step of carbon fixation. This step takes place in the mesophyll cells that are located close to the stomata where carbon dioxide and oxygen enter the plant
CCC Climate Cult Complex (C3)
CCDCalcite (or Carbonate) Compensation Depth (see footnote p.177)
CDSClimate Derangement Syndrome
CCNCloud Condensation Nuclei
CCRClear Column Radiance
CDDCognitive Dissonances Disorders
CDTCognitive Dissonance Theory
CETCentral England Temperature record
CGCMComplex coupled Global Circulation Models
CMDLNOAA Climate Monitoring and Diagnostics Laboratory, USA
CMECoronal Mass Ejection
CMIPCoupled Model Inter-comparison Project
CNRSCentre National de la Recherche Scientifique, France
CRFCosmic Ray Flux
CRUClimatic Research Unit
CTMCretaceous Thermal Maximum
DALRDry Adiabatic Lapse Rate
DICDissolved Inorganic Carbon, DIC = [CO2] + [HCO3 ] + [CO3 2−] which is 90% in the form of bicarbonate ion HCO3 , 9% in carbonate ion CO3 2− and 1% in carbonic acid H2CO3 or CO2; see (Zeebe and Wolf-Gladrow, 2001) the rebalancing between these different forms is done rapidly when the temperature, DIC or TAlk parameters change.
DODansgaard-Oeschger Cycles
DOCDissolved Organic Carbon
DOEDepartment of Energy, USA
DOIDigital Object Identifier734
DREDense Rock Equivalent
DTRDiurnal Temperature Range
ECMWFEuropean Centre for Medium-Range Weather Forecasts
EECOEarly Eocene Climate Optimum
EHIMEarly Holocene Insolation Maximum
EIEmission Index
ELPSEuropean Late Pleistocene Shift
ENSOEl Niño Southern Oscillation (El Niño - La Niña)
EOSEarth Observing System (of NASA's global satellite system)
ERFEffective Radiative Forcing, see (IPCC, 2013a), p. 665, § 8.1 box 8.1 and Figure 8.1 p. 669
ETCWEarly Twentieth Century Warming
FDForbush Decrease
FWHMFull Width Half Maximum
GAOHC Global Average Ocean Heat Content
GECGlobal Electric Circuit, Earth interaction (through magnetosphere and ionized layers of the atmosphere) with the Solar wind.
GFGeothermal Flux
GHGGreenHouse Gase(s)
GISP2Greenland Ice Sheet Project II
GRIPGreenland Ice-core Project
GRUNZIDie Grünen sozialismus
Gt-Cgigatons of carbon or billion tonnes of carbon contained in carbon dioxide molecules
Gyr(Giga) i.e. Billion years
HCO Holocene Climatic Optimum
HITRANHIgh-resolution TRANsmission
IPCCIntergovernmental Panel on Climate Change
IPOInterdecadale Pacific Oscillation
IRAGInfra Red Absorption Gases
I/RAOIron/Roman Age Optimum, aka the Roman Warm Period between 250 BC and 400 AD
IRDIce-Rafted Debris
IRFImpulse Response Function, i.e. a transfer function (mostly used for CO2)
ITCZInter-Tropical Convergence Zone
KNMIKoninklijk Nederlands Meteorologisch Instituut
kyr(kilo) thousand of years
LAILeaf Area Index
LALIALate Antique Little Ice Age
LGMLast Glacial Maximum
LIALittle Ice Age
LISLast Interglacial Stage
LODLength Of Day
LSLower Stratosphere
LWLongwave radiation
Ma million years ago. See Myr for further explanations.
MALRMoist Adiabatic Lapse Rate
MASMicrowave Atmospheric Sounder
MBPMarine Biological Pump
MGWModern Global Warming, i.e. a warming supposed to be different than pasts, CO2 driven
MISMarine Isotope Stage
MLOMauna Loa Observations (or Observatory)
MOModern Optimum, equivalent meaning to MGW
MOCMeridional Overturning Circulation
MOSZSAMid-Ocean Spreading Zone Seismic Activity
MPAEMax-Planck-Institut für Aeronomie, Germany
MPTMid-Pleistocene Transition (MPT) or mid-Brunhes Climate Transition
734https://www.doi.org/index.html
mtDNAmitochondrial DNA
MSUMicrowave Sounding Unit
MiWPMinoan Warm Period (3400-3100 BP)
MSIEAG Monthly Sea Ice Extent Anomaly Graph
MWPMedieval Warm Period (920-1100 BP)
Myrmillion years. In geology a debate remains open concerning the use of Myr (duration) plus Ma (million years ago) versus using only the term Ma. In either case the term Ma is used in geology literature conforming to ISO 31-1 (now ISO 80000-3) and NIST 811 recommended practices. Traditional style geology literature is written: “The Cretaceous started 145 Ma and ended 66 Ma, lasting for 79 Myr”.
NADWNorth Atlantic Deep Water
NAMNorthern Annular Mode
NAONorth Atlantic Oscillation – The name was given by Sir Gilbert Walker who also named the Southern Oscillation (the Pacific Oscillation is basically part of the Southern Oscillation) https://en.wikipedia.org/wiki/Gilbert_Walker_(physicist).
NASANational Aeronautics and Space Administration, USA
NASDANational Space Development Agency, Japan
NBS-19a carbonate standard, which has a δ13C value of +1.95‰ (Friedman et al., 1982)
NCARNational Center for Atmospheric Research
NCEPNational Center for Environmental Prediction, USA
NDIRNon-Dispersive InfraRed method
NGONon Governmental Organization
NHNorthern Hemisphere
NIACNext Ice Age Challenge is what Nature has in store for Mankind (1,500-2,000 yrs from now)
NISTNational Institute for Standards and Technology, USA
NOAANational Oceanic and Atmospheric Administration, USA
NRLNaval Research Laboratory, USA
OCDObsessive Compulsive Disorder
ODPOcean Drilling Programme
OHCOcean Heat Content
OLROutgoing Longwave Radiation (or radiative flux) emitted towards the cosmos. OLR observations are made via the Advanced Very High Resolution Radiometer (AVHRR) instrument aboard the NOAA polar orbiting spacecraft
pcparsec=210,000 astronomical units, and equates to about 3.3 light-years
PDBPee Dee Belemnite (δ13C original standard)
PDOPacific Decadal Oscillation
PETMPaleocene Eocene Thermal Maximum
PFPolar Front
ppmnumber of CO2 molecules per million air molecules or parts per million
ppmvparts per million (by volume), i.e. 10-6
PVPotential Vorticiy
QBOQuasi-Biennal Oscillation
RCPRepresentative Concentration Pathway (IPCC)
RFRadiative Forcing (RF) see AR4 (IPCC, 2007a)
RHRelative humidity
RMSRoot-Mean-Square
RSSRemote Sensing Systems https://www.remss.com/research/climate/ RTRadiative Transfer
RWPRoman Warm Period (2200-1900 BP)
SBLStefan-Boltzmann Law
SDGSustainable Development Goals , see the (United Nations, 2017)
SEPSolar Energetic Particles (SEP)
SGMinSolar Grand Minimum
SGMaxSolar Grand Maximum
SHSouthern Hemisphere
SMOWStandard Mean Ocean Water
SOSouthern Oscillation - The name was given by Sir Gilbert Walker who also named the NAO https://en.wikipedia.org/wiki/Gilbert_Walker_(physicist). The Southern Oscillation is the atmospheric component of El Niño.
SOASchedule of Adjustments
SOISouthern Oscillation Index
SPICEStratospheric Particle Injection for Climate Change
SSESea Saw Effect
SSISolar Spectral Irradiance
SSTSea Surface Temperature
SSUStratospheric Sounding Unit
SWShortwave radiation
TAlkTotal Alkalinity, i.e. [HCO3 -] + 2 [CO3 2-] + [B(OH)4 ] + [OH ] + [HPO4 2−] + 2 [PO4 3-] + [H3SiO4 ] + 2[H2SiO4 2-] + [HS ] + 2[S ]+ [NH3 +]+ [Org ] − [H+] − [H3PO4] where Org− represents a collective term for organic acids (Hunt el al., 2011), simplified Talk = [HCO3 -] + 2 [CO3 2-] + [OH ] − [H+] + [B(OH)4 ]. Thus [HCO3 -] + 2 [CO3 2-] + bt[S] Kb / (Kb + [H+]) difference of the total charges of the major ions of the dissolved salts except carbonates and borates; Kb is the base dissociation constant, a measure of how completely a base dissociates into its component ions in water: Kb = [B+][OH ]/[BOH]; Salinity S=34.78 in calculations for pH; see e.g. Dickson et al. (2007), Millero (2007).
THCThermo-Haline Circulation
TIGRTOVS Initial Guess Retrieval
TIOTropical Intra-seasonal Oscillation
TL_TTTThin Layer (TL) at the high Troposphere up To the Tropopause (TTT) 300-100 mbar from which originate most of the emissions towards the cosmos
TOATop Of the Atmosphere
TOVSTIROS Operational Vertical Sounder
TSITotal Solar Irradiance
UAHUniversity of Alabama at Huntsville
UEAUniversity of East Anglia
UKMOUnited Kingdom Meteorological Office, UK
UTUpper Troposphere
UTHUpper Tropospheric Humidity
VEIVolcanic Explosivity Index
VGPVirtual Geomagnetic Pole
VSSIVolcanic Stratospheric Sulfur Injection
WCRPWorld Climate Research Program
WGCMWorking Group on Coupled Modelling
WEFWorld Economic Forum
WFCWorld Fuel Consumption
WMGGWell Mixed Greenhouse Gases
WMOWorld Meteorological Organization
WPNPWeather Prediction by Numerical Process, i.e. first formal description by Richardson (1922)
WSWWarm Salty Water
Figure 1. Central England Temperature (CET) 1659-2018, is the longest record of measured temperature available. It has of course only a regional scope, though it illustrates well the fast warming from 1700 to 1740, a stagnation until 1900, then a warming until 1950, a cooling until 1985 and finally the warming over 1950 to 2018, characterized by several strong El Niño years such as 1973, 1983, 1998 and 2016..............................................................................................13
Figure 2. The old lady of temperature datasets – HadCRUT, the only global dataset to reach back to 1850 – has released its revised monthly global mean surface temperature anomalies for 1850-2020. The earlier dataset that we use here (HadCRUT4) showed a least-squares linear-regression trend of 0.91°C on the monthly anomalies from 1850-2020 –only just over half a degree per century equivalent (Monckton of Brenchley, 2021)....................................................14
Figure 3. The Holocene (11,700 years) is displayed left, with the HadCRUT4 dataset right and corresponding variations reported at scale onto the Holocene graph.The total T anomaly reported is 1.1°C in between 1840 and 2020 (whereas the regression just gives 0.91°C), after Brown (2018a-b) modified. Data from (Alley, 2004; Vinther et al., 2009)........14
Figure 4. Europe during the Last Glacial Maximum some 23,000 years ago. The sea level is some -125 m lower, vegetation and habitat are dramatically changed and the extension of the Ice Cap is such that most of continental Europe is covered. Woolen mammouths were in Spain and 80% of the arable lands were lost as compared to present...........................15
Figure 5. Reconstructed global temperature over the past 420,000 years based on the Vostok ice core from the Antarctica (Petit et al., 1999, 2001). The record spans over four glacial periods and five interglacials, including the present. The horizontal line indicates the modern temperature. The red square to the right indicates the time interval shown in greater detail in Figure 174, p.523. After Ole Humlum, https://www.climate4you.com/.............................................16
Figure 6. Geological stratigraphic chart for the entire geological history of planet Earth. Modern time is indicated by the thin red line at the top of the left column. Please note that the time scale is highly compressed, and increasing so towards higher ages........................................ ......................17
Figure 7. Contrary to the oft-repeated deception that today’s CO2 concentration is unprecedentedly high, our current levels of carbon dioxide are at near-historic geological lows. The death line, i.e. when photosynthesis stops and all forms of lives stop to exist is drawn in red, around 150 ppm (Tripati et al., 2009). Time is given in million years with O (Ordovician), S (Silurian), D (Devonian), C (Cretaceous), P (Permian), T (Trias), J (Jurassic), K (Cretaceous), T (Tertiary or Cenozoic), similar reconstructions can be obtained from Berner and Kothavala (2001), Wrightstone (2017) https://co2coalition.org/facts/current-co2-levels-are-near-record-lows-we-are-co2-impoverished/. After Rothman (2002), modified................................... ...................18
Figure 8. “Nature” conducted an anonymous survey of the 233 living IPCC authors last month and received responses from 92 scientists — about 40% of the group about how much warming above pre-industrial times they expect by 2100 – the scattering of the answers is appalling, after Tollefson (2021)........................................................................................24
Figure 9. The “scientific method” is schematized left and should prevail over any consensus, whereas the “climate science method” as enforced by political bodies and the vested interests of the climate-research&industrial complex is at the right.This could look somehow caricatural, but alas is not............................................................................................29
Figure 10. Anthropogenic CO2 expressed as a % of the total atmospheric CO2 content for the period 1930-2020 computed using Equation 9 with 19 terms (i.e. a 19 years moving window over the exact man-made emissions) for (1-1/τ)=0.82. It culminates so far in 2018-2919 at 6%, with the very small Covid effect at the end.......................................................39
Figure 11. Estimating the relaxation time for a given emission (here the 52.15 Gt-C of anthropogenic origin left today in the atmosphere) with a function e-λt with λ=(1/τ)=0.198 and τ=1/λ =5.05yr over a 30 years time-scale............................40
Figure 12. Measured time series for atmospheric Δ14C in CO2 (a) (compare to the observed decrease past the emission peak to Figure11) and δ13C in CO2 (b). Annual mean values of Δ14C are provided for three zonal bands representing the Northern Hemisphere (30–90° N), the tropics (30°S–30°N) and the Southern Hemisphere (30–90° S). Annual mean, global mean values are provided for δ13C. Source Graven et al. (2017).......................................................................40
Figure 13. Reconstructed Suess effect δ13C, using the time series generated using Equation 9, that leads to Figure 10, and a mixing between the anthropogenic and the natural reservoir over the period 1930-2020. Note the perfect match with the measurements and previous Figure 12 b. The small blip in the end (bottom right) is the very small “Covid effect”. ..............................41
Figure 14. δ13C mismatch between the “Bern” model (blue line) and the measurements at MLO (in red). Source Veyres (2020e). ..............................45
Figure 15. Comparison of various deceitful IRFs (including Delmas et al., 2005) with that in orange that is given as per Equation (4) in exp(-t/5) which is valid both for natural degassing and for "fossil" emissions (of course). Source Veyres and Maurin ( 2020)...................................... ...................45
Figure 16. Cumulative anthropogenic CO2 emissions over 1900-2018 (blue curve) and what's left of them (1970-2018) (red curve) as computed by developing the series of emissions-absorptions according to Equation 9.................................46
Figure 17. Here are shown curves for Carbon species in solution Cs in mg.atoms/L at different temperatures and chlorinities in sea-water. They represent the amount of H2CO3, in milligram atoms of carbon per liter of sea water, in solution
under the designated conditions when the partial pressure of CO2 is 1 physical atmosphere. At 20°C and 19 ‰ Cl, Cs is 34.2. That is, a partial pressure of one atmosphere of CO2 would be in equilibrium with a solution containing 34.2 milligram-atoms of carbon as free CO2 + H2CO3. Source Sverdrup et al. (1942), fig 41, p. 202....................................52
Figure 18. Approximation of the decrease of the solubility as a function of the temperature Cs=f(Θ) according to the equation 28 proposed........................................................................................................................................................................53
Figure 19. Temperature variations (ΔT) as the cause of the changes in atmospheric CO2 concentrations throughout the last 423 kyr of the Vostok record and their control by Milankovitch insolation cycles. All data from Petit et al. (1999), including the insolation variations in watts per square meter (W m−2) shown at the top and reported for a reference value in midJune at 65◦ N. After Richet (2021)............................ .............................................56
Figure 20. The CO2 content of the air is a consequence of past inter-tropical temperatures, in fact their time-integral: in grey the time derivative of the ppm, in yellow-green a linear function of the inter-tropical UAH-MSU temperature anomaly TA(t), (Soares, 2010; Veyres, 2018). This also shows the extraordinary variability of the annual increments in ppm, from less than 0.5 in 1993 or even close to zero in 1959 (off the graph), to more than 3ppm in 2016 (El Niño), thus with inter-annual variations of more than 500% over the period, whereas man-made emission are regular and steadily increasing. Therefore, just from this simple observation, man-made emissions cannot explain the annual increments measured. Data from Spencer et al. (2015), after Veyres (2018)................................................................59
Figure 21. Carbon dioxide concentrations over the ocean, i.e. surface p(CO2) (µatm) essentially shows the outgassing from the warm intertropical oceans. Source: Barry et al. (2010) and data from Takahashi et al. (2009)......................................60
Figure 22. Annual anthropogenic emissions in Gt-C per year (1959-2018) (red) compared to the yearly annual [CO2] increment in ppm (blue) as measured at the MLO station show no relationship. Inter-annual ppm increases may vary enormously, e.g. 1973 (2.97), 1974 (0.09), 1997 (1.0), 1998 (3.28), 1999 (1.16) whereas emissions are regular with a steady progression. Nature drives the annual increase. Data are public and from: https://www.worldometers.info/co2-emissions/co2-emissions-by-year/.....................................................................61
Figure 23. The ppm increments δCO2 (t) can be mainly reconstructed using the Temperature Anomaly (TA) and the Sea Surface Temperature (SST) and proves that there exist only very little dependence on man-made emissions, after Veyres (2022)............................................. .........................62
Figure 24. Correlation between emissions (detrended) (X-axis) and MLO ppm increments (detrended) (Y-axis). Coefficient of determination R² = 0.01, after Veyres (2022 see note 87).............................................................................................63
Figure 25. Annual variations of the anthropogenic CO2 stock over the period 1930-2021 expressed in ppm. Note the blip at the end that corresponds to Covid time. ................ .......66
Figure 26. Annual variations of the total CO2 atmospheric stock over the period 1950-2021 expressed in ppm. Note the drop at the end that corresponds to Covid time.............. ....66
Figure 27. Annual variations of the anthropogenic CO2 sub-stock expressed as a percentage of the variations of the total CO2 atmospheric stock.................................. ..................67
Figure 28. Comparative dynamics of the World Fuel Consumption (WFC) and Global Temperature Anomaly (dT) 1861–2000 (checked against O18 ice-core content in Greenland). Thin line shows the annual dT; Bold line is a 13-years moving average; The thick gray line made of squares is the WFC (million tons of nominal fuel). From Klyashtorin and Lyubushin (2003)...........................................................................................................................................................68
Figure 29. Comparative dynamics of the temperature anomaly in red (as per NASA's GISS data) and CO2 from Law dome icecore proxies (Antarctica) and since 1958 from MLO direct IR measurements by spectroscopy. Same comment as for Figure 28.......................................... ........................69
Figure 30. Diagram P/T [0.1-3] bar. Using Equation 79 gives a very convenient way to display how the temperature (T) depends on the pressure (P), starting with a reference of 288°K, i.e. 14.85°C for 1 bar, with 0.1 bar increments. At a pressure of 0.5 bar (i.e. altitude of ~ 5600m) the temperature has gone down to -11.86°C, whereas at a pressure of 1.2 bar the temperature has already gone up 10°C at 25°C. Given the imbalance of 3.7 Wm-2 for a CO2 doubling (Myhre et al., 1998) it gives an ECS of 1.1°C (Equations 103 and 104), thus it would require nine (9) doubling of the [CO2] concentrations, an increase of 512 times (i.e. at 0,04% times 29 => 0.04*512=21%) to produce an equivalent warming to an increase of Patm of just 20%. This should have considerable impact on our understanding of paleo-climate variations as Patm has of course varied over geological times (mainly decreased) and explains T changes observed (e.g. PETM) that [CO2] variations cannot. A more accurate formula for Patm>1 (or negative height or e.g. depth in a shaft) is given by (Berberan-Santos et al., 2009) p. 999 eq. 16 but only marginally changes the results shown above.77
Figure 31. The enormous dispersion of the ECS and TCR values on this graph show (for a doubling of [CO2]), on the one hand, the lack of consensus on these two essential notions and, therefore, the major uncertainty regarding the amplitude of possible warming and, on the other hand, the inexorable tendency for these values to decrease, which leads to a projection of minimal anthropogenic warming, after Scafetta et al. (2017) with data from Knutti et al. (2017) and also after Gervais (2016a, 2018, 2022) in French. Latest values, e.g. (Coe et al., 2021) are well below 1°C..........................88
Figure 32. Planck radiation spectra for different temperatures in K (equal to T in °C +273 (thus, 288K=15°C; 0K= -273°C), in loglog representation. Abscissa= Wavelength in µm (left scale= Spectral Specific Radiation right scale=Spectral Radiation)......................................... .......................90
Figure 33. Optical thickness τ at infrared frequencies of water vapor (in blue), and CO2 in black (and methane in green) for an average value of 30 kg/m² of water vapor and 6 kg/m² of carbon dioxide and after doubling of ppm (in red), thermal infrared frequencies in THz. The orange and black curves are the radiation of a black body surface (π times the Planck function) as a function of the frequency, spectral density given in W/m²/THz (SI units), after Moranne (2020)...........91
Figure 34. Shows the net absorption and release of latent heat energy for the Earth's surface for January and July, respectively. The highest values of flux or flow occur near the subtropical oceans where high temperatures and a plentiful supply of water encourage the evaporation of water. Negative values of latent heat flux indicate a net release of latent energy back into the environment because of the condensation or freezing of water. From Climate Lab Section, University of Oregon......................................................................................................................................................93
Figure 35. The position (altitude expressed in pressure) of the bottom of the layer that makes 80% of the radiation from the air to the cosmos (TOA) at the different frequencies of the thermal infrared. The "Higher-Colder" for a doubling of the ppm of CO2 around 18 THz and 22 THz is the difference between the black and red curves!, visible between 0.4 atm and 0.2 atm; in blue the water vapor – layer at τ =1.07 for both CO2 and H2O (30 Kg/m2). For the record, 0.2 atm corresponds to an altitude of 12 km: it is also the altitude of the tropopause in temperate zones, at an average temperature of -60°C or 213K, after Moranne (2020).. ..............................................94
Figure 36. Pressure (in atm) of the level above which 80% of the photons radiated by the air and reaching the cosmos are produced. Location of the τ =1.07 layer from the top of the air for CO2, 2*CO2, and water w=25kg/m2 & w=50kg/m2. Solutions of τH2Omax P 4.5 = 1.07 and of τCO2max P 1.45 = 1.07 and 2* τCO2max P 1.45 = 1.07. In orange the Planck function for a black body at 255K (Veyres, 2020).... 95
Figure 37. Cooling of cloudless air by radiation for a tropical troposphere: O3 around 960 cm-1, CO2 around 666 cm-1 and water vapor across the spectrum. The considered spectral range is from 0 to 2500 cm-1. From (Brindley and Harries, 1998). The low areas in pale blue do not cool because the medium is opaque, the high areas in light blue do not cool because there is hardly any trace gas left (no water vapor capable of radiating)..........................................................97
Figure 38. A radiative transfer model simulation of the TOA zenith monochromatic radiance for a mid-latitude summer atmosphere. Smooth grey solid lines indicate Planck curves for different temperatures. The calculated quantity has to be integrated over frequency and direction to obtain total OLR (Buehler et al, 2006). The blue line is know as the Schwarzschild curve and absorption bands of H2O, CO2 and O3 ar erepresented. Similar OLR spectrum can be measured by Michelson spectrometers at the nadir of satellites. Also see the more detailed Figure 162, p 446. After Moranne (2020)..................................... ..................99
Figure 39. Atmospheric specific humidity at 300 mb (ca. 9 km altitude), 600 mb (ca. 4.2 km altitude), 1000 mb (near surface) over the period 1948-2016. Data from NOAA Earth System Research Laboratory, chart from https://www.climate4you.com/ClimateAndClouds.htm..... .......................................99
Figure 40. Global relative humidity, middle and upper atmosphere, from radiosonde data, NOAA Earth System Research Laboratory. These radiosonde measurements of relative humidity in the upper troposphere (1948-2012) show that increased temperature and CO2 did not increase humidity there - the opposite of the assumptions of both General Climate Models and the IPCC. Source: Gregory (2013). ............................................100
Figure 41. Specific humidity at 400 mb pressure level. Source: Gregory (2013)...........................................................................101
Figure 42. Average total radiation of the globe in thermal infrared (in W/m²) represented as a function of the carbon dioxide content of the air in ppm (Mauna Loa series). Note the seasonal cycles due to vegetation. Forty years of observations (1974-2014) show a slight growth (trend in red) and certainly not the trapping (or decrease in OLR) of 1 W/m² claimed to come from the greenhouse effect according to the decrease known as by the IPCC Myhre (1998) formula (black line)...................................................................................................................................................................102
Figure 43. Albedo of the northern (left) and southern (right) hemispheres from January 1984 to December 1997. Data from Hatzianastassiou et al. (2005) plotted by Veyres (2019) suggest that the maximum albedo in the northern hemisphere comes from the cloud cover and incidentally from the snow cover in winter of the mid and high latitudes of the northern hemisphere; the maximum of cloudiness in the southern hemisphere is in southern summer (displacement towards the south of the vertical meteorological equator) and in southern winter (clouding and extension of the Antarctic pack ice). They also clearly show a decrease of the Northern Hemisphere Albedo (left) over the 1984-1998 period............................................. .......................103
Figure 44. Evolution of the OLR in W/m2 over the timespan 1948-2021, automatically generated by the NOAA site as per the results of the NCEP/NCAR Reanalysis 40-year Project (Kalnay et al., 1996).................................................................104
Figure 45. Monthly global mean surface air temperature anomalies, December 1996 to July 2013 (Remote Sensing Systems, Inc.), showing no trend over 16 years and 8 months (200 months), notwithstanding a rising trend in carbon dioxide concentrations (grey line and curve) from 362 to 398 ppm at a rate equivalent to 200 µatm century-1 (NOAA, 2013), implying a radiative forcing of 0.47 W m-2 from carbon dioxide alone. From Legates et al. (2015). Another example is over the period 1950-1970 temperature anomalies (HadCRUT4.4) fell while [CO2] steadily increased, this is referred to as the “Big hiatus” (Fyfe et al., 2016).......................................................................................................................118
Figure 46. Spectral dependence of the absorbency for three values of the water vapor content of the atmosphere, here expressed in kg/m2. The carbon dioxide curve is reproduced for comparison. The wavelength is in microns in abscissa X and the absorption in Y. Since the concentration of water vapor varies greatly with altitude, we consider the integral of the mass of water vapor on a vertical. The variation with latitude is also large: from 4 kg/m2 at high latitudes to 45 kg/m2 near the equator. The concentration of CO2 is on the contrary very little variable for altitudes below 50 km, and therefore the integral of its mass along the vertical is directly proportional to its average concentration, quantity used here. Adapted from Dufresne and Treiner (2011).........................................................124
Figure 47. A sketchy global annual mean Earth’s energy budget expressed in PetaWatts (1015 Watts). SW radiations are represented in yellow (λ < 4 µm), LW radiations are in Red (λ > 4 µm) and energy transported by thermodynamical processes is in Blue (Sh= Sensible Heat, LH=Latent Heat). IR emissions toward space taking place at TL_TTT are figured
in vaporous red. As explained p. 93 the very thin red vaporous layer atop the ground shows that just 17 meters of air in tropical zone or 240 meters in temperate zone during winter (lower content of H20 vapor) are the thickness of the slice of atmosphere that will stop 80% of the radiative emissions originating from the ground. After an exchange with J.-C. Maurin (2021)................................. ...............126
Figure 48. Carbon Budget at a glance over the period 1900-2018 displayed on the graph over 1959-2018. Dark Blue = Cumulated man-made emissions Gt-C (same as Figure 16), Light Blue= Cumulated Degassing by the Oceans yr-1 of Total Gt-C in Atmosphere, Light Green = Cumulated Gt-C Budget (overall ppm atmospheric increase), Red = Anthropic Gt-C CO2 remaining (same as Figure 16), Green = Cumulated uptake by Land, Forest, and Biological Pump yr-1 of total Gt-C in Atmosphere. Based on a non linear model where all processes are dependent on the Temperature........................128
Figure 49. Representative plants of Abutilon theophrasti (C3) grown at glacial through future [CO2]. All plants were 14 days of age and were grown under similar water, light, and nutrient conditions. These plants were photographed during a study by Dippery et al. (1995). (Photograph is courtesy of Anne Hartley, Florida Gulf Coast University.). Modified after Gerhart and Ward (2010)............................ ...........134
Figure 50. The GIMMS LAI3g data set, which includes recent data up to 2015, shows the change of Leaf Area Index (LAI). After Myneni (2015) the third author of Zhu et al. (2016), work referenced by NASA (April 26, 2016)................................135
Figure 51. Global temperature and atmospheric CO2 concentration over the past 570 million years. Purple line is CO2 concentration (ppm); blue line is change in temperature (∆°C). Horizontal scale is not in constant units. CO2 scale derived from ratios to levels at around 1911 (300 ppm) calculated by Berner and Kothavala (2001). Source Idso et al. (2019) adapted from Nahle (2007), referencing Ruddiman (2001), Scotese (2003), Pagani et al. (2005)....................136
Figure 52. The Earth during the late Paleozoic ice age, i.e. “Karoo ice age” 360 to 260 Ma, the second major glacial period of the Phanerozoic. It is named after the tillite (Dwyka Group) found in the Karoo Basin of South Africa. From https://en.wikipedia.org/wiki/Late_Paleozoic_icehouse modified after Dimichele et al. (2005)................................138
Figure 53. All glaciations (blue spots) put in scale, from the latest at the right to the oldest left, the Quaternary (i.e. the current ice-age) then the Late Paleozoic (-360 to -260 Myr) formerly known as the Karoo ice age, the Andean-Saharan (-460 to -420 Myr), the Cryogenian (-720 Myr to -630 Myr) and the Huronian (-2,470 to -2,210)........................................138
Figure 54. Reconstruction of extra-tropical temperatures of the northern hemisphere in °C, deviating from the average for the period 1880-1960. The thin curves are the annual values, and the smoothed curve (in red) an average over 50 years, with dashed quantiles at 2.5% probability. The green curve shows the observed extra-tropical (>30° N) annual mean temperature. The yellow curve show the temperature average over grid-cells with accepted proxies. Both curves have been centered to zero in 1880–1960 AD. Source: Christiansen and Ljungqvist (2012). Other similar reconstructions by Moberg et al. (2005)............ ....143
Figure 55. The Little Ice Age (LIA), "cold" period from 1300 to 1860, ended, according to the glacier moraines, around 1860; observations on the great Aletsch glacier (Switzerland) also strongly suggest cycles of around 1000 years; before our era, around the Iron/Roman Age Optimum (I/RAO) (aka the Roman Warm Period) between 250 BC and 400 AD the glacier was somehow shorter than today, and around 1350 BC – 1200 BC i.e. Late Bronze Age Optimum (BAO) the glacier was 1000m shorter than today as per Schafer (2018), graph after Holzhauser et al. (2005)............................144
Figure 56. Departure of summer temperature (°C) from modern values for the Holocene climatic optimum optimum (5000 to 6000 years BP) as per Borzenkova and Zubakov (1984), (Budyko and Izrael, 1987) after Folland et al. (1990)...........147
Figure 57. Departure of annual precipitations from modern values for the Holocene climatic optimum optimum (5000 to 6000 years BP) as per Borzenkova and Zubakov (1984), (Budyko and Izrael, 1987) after Folland et al. (1990)....................149
Figure 58. Based on multiple climate proxy time series, the transition from a) Holocene Climatic Optimum to b) Neoglaciation. The climate patterns changed at the Mid-Holocene Transition (see Figure 59) due to orbitally-driven changes in insolation and a shift from solar to atmospheric-oceanic frequencies leading to the shift of the Inter-Tropical Convergence Zone (ITCZ) and led to the end of the Green-Sahara period, after Wanner and Brönnimann (2012) Source: Javier Vinós................................ ...............150
Figure 59. Holocene climate reconstruction from Vinós (2017c) “Major palinological subdivisions of the Holocene (names on top) match a 2450-yr regular spacing (grey arches on top). (a) The global temperature reconstruction has been rescaled resulting in the Holocene Climate Optimum being about 1.2°K warmer than LIA (b) The general temperature trend of the Holocene follows the Earth’s axis obliquity (purple), and significant downside deviations generally match the lows of the ≈2400-year Bray cycle of solar activity (grey bands labeled B-1 to B-5). (c) Significant negative climate deviations manifest also in global glacier advances - blue bars, Mayewski et al. (2004) and (d) strong increases in iceberg detrital discharges (red curve, inverted) Bond et al. (1992; 2001) that generally agree well with the lows in the ≈2400-year Bray cycle and ≈1000-year Eddy cycle (not shown) of solar activity”, Source: Vinós (2017c)...................151
Figure 60. Interglacial start and end dates (triangles) relative to the obliquity maximum. Light grey area indicates interglacial start for all interglacials except MIS 7e and MIS 11c that had an anomalous length due to starting too late and too early respectively in the obliquity cycle. Dark grey area indicates interglacial end for all interglacials. Circles indicate start and end of a typical interglacial with average 13.8 kyr length. Interglacials start when obliquity is high and end when obliquity is low. Source: Vinós (2018d)....... .154
Figure 61. The “Orbital decision” to end an interglacial is calculated as a function of the summer energy at 70°N with a 250 W/m2 threshold for the past 800 kyr. Diamonds mark the position 6 kyr before glacial inception as observed in the EPICA Dome C temperature proxy record for each interglacial except MIS 13. Dashed line marks the lowest value observed (4.96 GJ/m2). Six interglacials were very close to this value 6 kyr prior to glacial inception. The Holocene (MIS 1) is already below that value. Source: Vinós (2018d).........................................................................................156
Figure 62. Succession of the Dansgaard-Oeschger events (numbers atop) in the Greenland glacial archives and the Heinrich events (Hx below) in the marine sediments of the North Atlantic. The Bølling–Allerød event (D-O 1) is well visible and followed by the Younger Dryas - more details provided in Stuiver et al. (1995), Fig. 11, p. 348. The 8200 years event is recorded in Greenland ice-cores and zoomed (left). The D-O 19 ca. mentioned before at 70-71,000 BP is further right, out of scale of x-axis (age); y-axis is δ18O a proxy for the temperature, from Debret (2008)......................................158
Figure 63. Displayed are ice records from Antarctic and Arctic: (1) the EPICA project has provided two records in East Antarctica, one at Dome C (EDC, EPICA community members, 2004), and one in the Dronning Maud Land area (EDML, EPICA community members), (2) Byrd Station, West Antarctica (80°01'S, 119°31'W; 1530m elevation), (3) the NGRIP Northern Greenland Ice-core Project site. The synchronization between the two hemispheres reveals a coupling between the amplitude of hot Antarctic events and the duration of the equivalent stadial in Greenland. Note: Last Glacial Maximum (LGM), Antarctic Cold Reversal (ACR), Antarctic Isotope Maximum (AIM) warm events, Marine Isotope Stage 3 (MIS3), Antarctic warming A1, A2, from EPICA (2006), Parrenin et al. (2007) and Debret (2008)......160
Figure 64. Age model of Ocean Drilling Programme (ODP) Site 1233. Alkenone-based SST reconstruction at Site 1233 compared to the Byrd δ18O record over the last 70 kyr. The open arrows represent the correlation points to the core GeoB3313-1, the black arrows represent the 14C-AMS datings and gray arrows show the tuning points to the oxygen isotope record of the Byrd ice core. A1 to A5 are Antarctic warm events after Blunier and Brook (2001), MIS is marine isotope stages 1 to 4, from Kaiser et al. (2005)... ...161
Figure 65. Departures of (a) summer air temperature (°C) from modern values for the Eemian interglacial from Folland et al. (1990) and after Velichko et al. (1982, 1983, 1984). .................................................164
Figure 66. δ18O isotopic record from LR04 stack of 53 benthic cores from all over the world shows that from about 1.8 million years ago some interglacials continued reaching the previous average temperature, while others show a decreasing trend in interglacial average temperature, and are not considered interglacials. Periods of higher temperature more recent than MIS 23 that did not reach interglacial levels are usually not assigned an MIS number (asterisks). Source: Lisiecky and Raymo (2005).......................... ...........166
Figure 67. Temperature Anomaly in Antarctica over 800 kyr is displayed in Red, CO2 in Blue, CH4 in Green. No need for magnifying glasses to see that CO2 lags the temperature (e.g. at 650kyr, 430kyr, 240kyr, 130kyr)!...........................167
Figure 68. Two different paleoclimatic proxies from ODP Site 846 for temperature, the alkenone UK’37 in marine sediments (red), and δ18O isotope in benthic cores (blue), show the progressive cooling of the Earth through the Pliocene. At the early- Pleistocene, glaciations start to take place at 41 kyr intervals. As the cooling progresses, this interval lengthens to 100kyr in what is called the Mid-Pleistocene Transition. All data are correlated to the LR04 Stack, the early Pliocene is shaded yellow, a white background defines the interval of maximum Eastern Equatorial Pacific (EEP) plankton productivity, and the portion of the Pleistocene after the productivity maximum is shaded gray, after Lawrence et al. (2006)............................. ..............167
Figure 69. The average interglacial (grey curve and 1σ grey bands) and the average obliquity (grey sinusoid continuous line) and insolation at 65°N on 21 June (grey dotted line) are compared to Holocene temperature (smoothed, black curve), obliquity (black sinusoid continuous line), and insolation (black dotted line), Source: Vinós (2018b).........................170
Figure 70. Departures of (a) summer air temperature (°C) and (b) Departures of annual precipitation (mm) from modern values for the Pliocene climatic optimum (4.3 to 3.1 million years BP) from Budyko and Izrael (1987) after Folland et al. (1990)..........................................................................................................................................................................171
Figure 71. 40 Myrs ago, the Alps, the Himalayan mountain belts did not exist, the Tethys ocean was to disappear (except a remnant in the Eastern Mediterranean), India will collide with Eurasia, the northern motion of the African plate will entirely reshape the Mediterranean area, but some authors are obsessed by CO2 levels of the time!, map after “The Burgess Shale”, see also Scotese (2001, 2003), Boucot et al. (2013), Scotese and Wright (2018)...............................173
Figure 72. Evolution of the Climate over 65 Myears from Zachos et al. (2008). Global deep ocean δ18O. The climate curve is a stacked deep-sea benthic foraminiferal oxygen-isotope curve based on records from Deep Sea Drilling Project and Ocean Drilling Program (Zachos et al., 2001). As stated by Zachos et al. (2008) “The raw data were smoothed by using a five-point running mean. The δ18O temperature scale, on the right axis, was computed on the assumption of an ice-free ocean; it therefore applies only to the time preceding the onset of large-scale glaciation on Antarctica (about 35 million years ago). The figure clearly shows the 2-million-year-long Early Eocene Climatic Optimum and the more transient Mid-Eocene Climatic Optimum, and the very short-lived early Eocene hyperthermals such as the PETM (also known as Eocene Thermal Maximum 1, ETM1) and Eocene Thermal Maximum 2 (ETM2; also known as ELMO). ‰, parts per thousand”.....................................................................................................................................................174
Figure 73. 65 millions of Climate Change with Antarctic glaciations and thawing: Source Wikipedia..........................................176
Figure 74. There is a clear relationship that applies between the wing loading (in kPa or N / m2) and the weight that applies to all flying bodies from insects, birds and up to the B747. Prehistoric flyers like Quetsalcoatlus or Pteranodon do not fit into today's insects, birds and aircraft flight characteristics and require a higher atmospheric pressure to be given a chance to fly, but they flew ! After Levenspiel (2006)..................................................................................................183
Figure 75. Animation of 99942 Apophis's orbit – Close approach on April 13, 2029. Source: Wikipedia. Apophis is displayed on the left on April 23rd, 10 days after closest encounter, and visible on the right on April, 13th slightly past closest encounter at 39,828 km! (in fact will come no closer than 31,200 km), i.e. 1/10th of the distance between the Earth and the Moon, and will nearly also collide with the Moon, visible on the right, a few hours later on April 14th, 2029 around 17:00 UT.................................... ................185
Figure 76. 100 Myrs ago, the Alps and all the mountain belts eastward to the Himalayan did not exist, the huge Tethys ocean was to disappear, Middle East and Arabian plate did not exist, the Indian plate had just started it motion N, Africa and S. America were separating, and much more!, but if there is a problem with what you observe as a geologist, invoke CO2 !. See also Scotese (2001, 2003), Boucot et al. (2013), Scotese and Wright (2018)..............................................186
Figure 77. The parameter RCO2 is defined as the ratio of the mass of CO2 in the atmosphere at some time in the past to that at present (with a pre-industrial value of 300 parts per million) Berner (1997), see also Berner and Kothavala (2001) Fig. 6, p. 195, Berner (2006) Fig. 18, p. 5662......................................................................................................................187
Figure 78. The cryogenian is considered as probably the most severe episode of global glaciation, with two successive episodes: the Sturtian and Marinoan glaciations, thought to be global in extent, shown up clearly in this graph of carbon-13 (thought to be an indicator of biological productivity). The glaciations are at 710 and 650 Myr. A later glaciation at 580 Myr is also indicated, i.e. (Varanger or Gaskiers), although its nature remains elusive. The mantle value for δ13C is believed to be -5 to -6 ppm. When this actually was the sediment value, photosynthesis had nearly ceased. After Banik (2016)....................................... ....................188
Figure 79. δ18O of Phanerozoic low-Mg calcitic fossils (58,532 low-Mg calcite marine shells that cover almost the entire Phanerozoic eon). The temperature estimates are based on the Visser et al. (2003) transfer function, assuming the present day δ18O value of 0‰ Standard Mean Ocean Water (SMOW) for seawater. Time scale after Gradstein et al. (2012). After Veizer and Prokoph (2015)............. ..191
Figure 80. δ18O*(-1) over the entire Phanerozoic. Conversion to Temperature can be done using the scale displayed Figure 79. Moving averages, blue (3-6 Myr), green (5-10 Myr), black (10-20 Myr), and red (10-50 Myr) give the overall downard trend from high early Paleozoic to low Quaternary. The trend is due to a diminishing ground (sea-level) atmospheric pressure over geological eons, punctuated by excursions due to orbital parameter changes. Atmospheric composition and trace gases concentrations (except water vapor) play a minor role. Modified after Davies (2017)......................192
Figure 81. The Solar activity as monitored by 400 years of direct observations counting Sunspot numbers, with the Maunder and Dalton Minimum and Modern Maximum well visible. After Wikipedia, modified.......................................................193
Figure 82. The great winter 1683-1684 Thames frost fare took place while the seas of southern Britain were frozen solid for up to two miles from shore. After https://www.historic-uk.com/HistoryUK/HistoryofEngland/The-Thames-Frost-Fairs/ ............................194
Figure 83. Solar irradiance since 1610 as reconstructed by Lean et al. (1995) and Lean (2000). The thin line indicates the annual reconstructed solar irradiance, while the thick line shows the running 11 average. The values shown include a background component. See Lean (2000) for discussion of the amplitude of the background component. Last year included in the Lean (2000) analysis: 2000. After Ole Humlum, https://www.climate4you.com/...............................195
Figure 84. A periodogram shows how periodicities (either of orbital or solar origin) dominate climate change at all temporal scales. The 150 Myr Ice Age cycle has produced four Ice Ages in the last 450 million years. It is proposed to be caused by the crossing of the galactic arms by the Solar system (Veizer, 2005). The 32 Myr cycle has produced two cycles during the Cenozoic era, the first ending in the glaciation of Antarctica and the second in the current Quaternary Ice Age. It is proposed to be caused by the vertical displacement of the Solar system with respect to the galactic plane. The orbital cycles are well visible (eccentricity, obliquity, precession). The millennial climate cycles (grey band) regroup most of the known solar cycles aforementioned. Short term climate variability is dominated by the El NiñoSouthern Oscillation. Adapted by Vinós (2017c) from Maslin et al. (2001)..................................................................199
Figure 85. Time series of the sunspot number as reconstructed from 10Be concentrations in ice cores from Antarctica (red) and Greenland (green). The thick black curve shows the observed group sunspot number since 1610 and the thin blue curve gives the (scaled) 14C concentration in tree rings, corrected for the variation of the geomagnetic field. The horizontal bars with attached arrows indicate the times of Great Minima and Maxima: Dalton minimum (Dm), Maunder minimum (Mm), Spörer minimum (Sm), Wolf minimum (Wm), Oort minimum (Om), and Medieval Maximum (MM). From Usoskin et al. (2018)........... .................................................200
Figure 86. Evolution of the eccentricity and angular position of the perihelion for Jupiter's orbit for the last 650,000 years; this is a polar plot with the radial coordinate equal to the eccentricity (abscissa) and the angular coordinate equal to the longitude of the perihelion (ordinate), after Brouwer and Clemence (1961b)............................................................205
Figure 87. Earth's orbital eccentricity and direction of perihelion for one million years beginning in 1900; this is a polar plot with the radial coordinate equal to the eccentricity (abscissa) and the angular coordinate equal to the longitude of the perihelion (ordinate), after Brouwer and Clemence (1961b).......................................................................................206
Figure 88. Effect of the ~2500-year Bray(Hallstatt) solar cycle on the climate organization, with the shift of the ITCZ. As long as the ITCZ remains shifted South the Earth remains in a neoglacial regime. Source: Javier Vinós public data...............210
Figure 89. The flow of mass, momentum, and energy from the Sun’s interior through the interplanetary space into the Terrestrial Environment (TE) after (Baker, 2000). Some of the effects of this flow within the coupled system reveal the effect of solar variability on the atmosphere (i.e. Down from the Ionosphere to the Surface), Both normal solar wind flows and transient events are indicated. Source: Vinós (2018a)................................................................................212
Figure 90. Dynamical overview of the QBO during northern winter. The propagation of various tropical waves is depicted by orange arrows (in the middle), with the QBO driven by upward propagating gravity, inertia-gravity, Kelvin, and Rossby-gravity waves. The propagation of planetary-scale waves (red arrows) is shown at middle to high latitudes. Black contours indicate the difference in zonal-mean zonal winds between easterly and westerly phases of the QBO, where the QBO phase is defined by the 40- hPa equatorial wind. Easterly anomalies are light blue, and westerly anomalies are pink. The Mesospheric QBO (MQBO) is shown above ~80 km. Source: Baldwin et al. (2001)..............213
Figure 91. Summary of proposed top-down solar variability effects on climate. Only the Northern Hemisphere is represented, with the left and right halves showing the differences between summer and winter. The ITCZ, the Inter-Tropical Convergence Zone, is the climatic equator, ENSO, El Niño Southern Oscillation. Source: Vinós (2018a).....................215
Figure 92. The typical January–March weather anomalies and atmospheric circulation during moderate to strong (top) El Niño and (bottom) La Niña natural variability patterns. These influences over the United States often occur most strongly during the cold season. From (USGCRP, 2017)............................................................................................................219
Figure 93. Temperature, pressure, wind, sea ice, ocean current and precipitation changes related to a positive and negative NAO phase (KLIMET, Grüppe fur Klimatologie/Meteorologie, Geography, University of Bern, Switzerland). Source: Rombaut (2010)..................................... ................222
Figure 94. North–south vertical cross section of ocean temperature with depth in the Atlantic Ocean, showing its huge heat storage capacity given the very high specific heat capacity of water and that most of the ocean (95%) is below 5°C. Source: Spencer (2016)............................. .............223
Figure 95. Earth rotation and sea surface temperature anticorrelation. Continuous line, detrended yearly values of ∆LOD with a 5-year running mean smoothing, shifted ahead 4 years. Dotted line, detrended yearly values of Northern Hemisphere SST, from HadSST3 with a 5-year running mean smoothing. Source: Mazzarella (2013).............................................225
Figure 96. Schematic of the ocean circulation associated with the global Meridional Overturning Circulation (MOC), with special focus on the Atlantic section of the flow (AMOC), in the Atlantic, warm and saline waters flow northward all the way from the Southern Ocean into the Labrador and Nordic Seas. By contrast, there is no deep-water formation in the North Pacific, and its surface waters are fresher. Deep waters formed in the Southern Ocean become denser and thus spread in deeper levels than those from the North Atlantic. Note the small, localized deep-water formation areas in comparison with the widespread zones of mixing-driven upwelling. Wind-driven upwelling occurs along the Antarctic Circumpolar Current (ACC). After Kuhlbrodt et al. (2007)............................................................................................226
Figure 97. Large surfaces of equal density represented by rising yellow–red arrows widely circulate over the main ocean basins and the upwelling around Antarctica is mainly due to the action of wind and eddy processes. In the northern Atlantic basin, warm water initially traveling broadly towards the East is cooled in the subpolar gyre and eventually becomes dense enough to sink under the thermocline in the polar seas and Labrador Sea convection regions, with blue arrows representing the down-welling of dense water flowing southwards in the deep branch of the South Atlantic current (green arrow), before joining the ACC system. After Marshall and Speer (2012)........................................................227
Figure 98. Average monthly levels in Brest since 1807: the big maximums are in Dec. 1821 (7225 mm), Nov. 1852 (7233 mm), Dec. 1876 (7322 mm), Feb. 1966 (7422 mm) and Dec. 2000 (7426 mm). The 18.6-year lunar cycle is visible on the annual averages while the monthly values mainly show the effect of winter storms. In yellow moving average over 5 years. http://www.psmsl.org/data/obtaining/rlr.monthly.data/1.rlrdata ..................................................................231
Figure 99. a) Time series of yearly global sea level calculated from 1023 tide gauge records corrected for local datum changes and glacial isostatic adjustment. Time variable trend detected by Monte-Carlo-Singular Spectrum Analysis with 30year windows. Grey shading represents the standard errors. b) The evolution of the rate of the trend (black line) showing multidecadal variability and especially the 60 years cycle (Gervais, 2016). Blue line corresponds to the linear background sea level acceleration that corresponds to a sea level acceleration of 0.01 mm/yr2. Red line, IPCC calculated total anthropogenic radiative forcing. As one can see the blue trend started long before emissions were significant and despite the acceleration of the red-curve, the blue trend remains stable. Source: Jevrejeva et al. (2008)............................................. .......................232
Figure 100. Time series of sea level anomalies (blue) Jevrejeva et al. (2014). Million tons of carbon emitted from burning fossil fuels (red) from the Carbon Dioxide Information Analysis Center (CDIAC 2014). Source: (Curry, 2018; 2019a). As one can see there is simply no relationship, SLR (blue) started long before significant anthropogenic emissions and did not accelerate with the massive increase of emissions since the late 1950s. Another culprit will have to be found...233
Figure 101. Left: The V atop an horizontal bar Ɣ visible inside the ellipse (near center-left) which stands a bit less than one meter above the water is a mark 50 cm across (tidal range is less than a meter) that was etched by Capt. Sir James Clark Ross in 1841 to indicate the mean sea level and is still perfectly visible in this picture made by Daly in 2004 at the Isle of the Dead (Tasmania) showing that no significant SLR has occurred since 1841, < 0.8±0.2 mm/yr as per Hunter et al. (2003), Fig. 1 and 2, p.54-2 and 54-3, for the complete story refuting the SLR altogether, see Daly (2003a-b-c). Right: the Mörner Tree of the Knowledge of Good and Evil shows that no SLR occurred either in the Maldives, from Monckton of Brenchley (2020c)...................... .......235
Figure 102. Zoom on the etched benchmark displayed in the ellipse (near center-left) of Figure 101, that was engraved under the order of Capt. Sir James Clark Ross in 1841 to indicate the mean sea level at the Isle of the Dead (Tasmania). After Hunter et al. (2003)......................................................................................................................................................236
Figure 103. Sea-level change over the last 14.000 years (Holocene) in the “Golfe du Lion” as per Aloïsi et al. (1978) showing a constant SLR of +1mm/year over 8000 years, stopping at -4,500 years ago. This reconstruction matches that of Lambeck and Bard (2000), Fig. 3. Since the top observed at -4,000 the sea level has been pretty stable as reported by Morhange et al. (2001). After Aloïsi et al. (1978). See also O'Brien et al. (1995), Fig. 2 (center-down), p. 1963..........237
Figure 104. Sea-Level Rise (SLR) since the end of the last glacial maximum occurred in a sequence of various pulses, Robert Rohde (2005) produced the above illustration from various sources mainly showing MWP1a, mostly based on a data collection compiled by Fleming (1998, 2000) with a few additions from Milne et al. (2005).......................................238
Figure 105. The Kilimanjaro on March 30, 2018 does not want to cooperate with the anthropic global warming narrative and due to some atmospheric circulation change (westerlies) benefit of the greatest snowfall in years. This anecdotal glacier
will keep receding as it has done since its discovery in 1848 and will probably disappear but for other reasons than evil man-made emissions. Source: (Hardy, 2018)..... ................................................243
Figure 106. CO2 hydrate phase diagram from Genov (2005), Fig.I.8 p. I-8. The black squares show experimental data (Sloan, 1998). The lines of the CO2 phase boundaries are calculated according to the International thermodynamical tables (1976). The H2O phase boundaries are only “guides to the eye”. The abbreviations are as follows: L - liquid, V - vapor, S - solid, I - water ice, H – hydrate................................................................................................................................246
Figure 107. Clathrate hydrates are inclusion compounds in which a hydrogen-bonded water framework—the host lattice—traps “guest” molecules (typically gases) within ice cages. The gas and water don’t chemically bond, but interact through weak van der Waals forces, with each gas molecule—or cluster of molecules in some cases—confined to a single cage. Clathrates typically crystallize into one of the three main structures illustrated here. As an example, structure I is composed of two types of cages: dodecahedra, 20 water molecules arranged to form 12 pentagonal faces (designated 512), and tetrakaidecahedra, 24 water molecules that form 12 pentagonal faces and two hexagonal ones (51262). Two 512 cages and six 51262 cages combine to form the unit cell. The pictured structure I illustrates the water framework and trapped gas molecules (from Mao et al., 2007), see also (Brook et al., 2008) and (Everett, 2013).............................................. ........................249
Figure 108. CO2 concentrations in the bubbles and total carbonate content of: a, the Camp Century core; b, the Byrd core. The CO2 concentrations are presented with the lowest, highest and median values for each depth. The dashed lines indicate depths were drill fluid was observed in the large sample. Maximum CO2 values of 500 ppm at 500m (~300 years) for the Byrd Core. Modified after: Fig.1 in (Neftel, 1982) with anomalies as pink ellipses ~7,000-year BP added. ............................252
Figure 109. Antarctica monthly sea ice extent anomaly as per https://nsidc.org/data/seaice_index shows a +0.8 ± 1.1% increase per decade over the period (1979-2020). Methodology described at https://nsidc.org/sites/nsidc.org/files/G02135V3.0_0.pdf...................................................................................................................................................................255
Figure 110. The monthly Sea Ice Index provides a quick look at Antarctic-wide changes in sea ice. It is a source for consistently processed ice extent and concentration images and data values since 1979. Monthly images show sea ice extent with an outline of the 30-year (1981-2010) median extent for that month (magenta line), as per https://nsidc.org/data/seaice_index Source: National Snow & Ice Data Center - University of Colorado, Boulder....256
Figure 111. CO2 curve (red) from Antarctic Ice Cores Revised 800 kyr CO2 Data (to 2001). Source: NOAA, contributed by Bereiter et al., (2015); and from NOAA annual mean CO2 data (2002–2017). Due to the logarithmic effect of CO2 on temperatures, the comparison is more appropriately done with the Ln(CO2). Temperature curve (blue) for the past 200 years from 5 high resolution Antarctic ice cores. Source: Schneider et al. (2006). No temperature change is observed in response to the massive increase in CO2, over the period 1800-2000 (despite the conclusion from Schneider et al. (2006), who by cherry-picking the data, says slightly otherwise). Source: Vinós (2018b)..................256
Figure 112. Temperature(s) T and CO2 concentration: The graph displays the global proxy temperature stack (blue) TG as deviations from the early Holocene (11.5–6.5 kyr ago) mean, an Antarctic ice-core composite temperature record (red) TA, and atmospheric CO2 concentration (EPICA Dome C ice core). The pink ellipses show clearly where TA starts rising before CO2 which keeps lagging all along except for the degassing hysteresis oceanic effect when T stabilizes (between -15 and -13kyr). The Holocene, Younger Dryas (YD), Bølling–Allerød (B–A), Oldest Dryas (OD) and Last Glacial Maximum (LGM) intervals are indicated. Modified after: Shakun et al. (2012)................................................257
Figure 113. Lithosphere thickness in Antarctica from thermal isostasy, both the thinning of the lithosphere associated with high heat fluxes and the positioning of the young volcanoes (red triangles) show the new volcanic province identified. After Artemieva (2022)............................. .............259
Figure 114. Arctic monthly sea ice extent anomaly as per https://nsidc.org/data/seaice_index shows a -7.2 ± 0.9% decrease per decade over the period (1979-2022), https://nsidc.org/data/seaice_index/images/n_plot_hires.png . Methodology described at https://nsidc.org/sites/nsidc.org/files/G02135-V3.0_0.pdf....................................................................261
Figure 115. The Sea Ice Thickness and extent provides a quick look at Arctic-wide changes in sea ice, here for April 15, 2020, somewhere around its maximum yearly extension as displayed in the superimposed sinusoid. Source: from the Danish Meteorological Institute (DMI), as per http://ocean.dmi.dk/arctic/icethickness/images/, see also http://polarportal.dk/en/greenland/surface-conditions/ and http://nsidc.org/arcticseaicenews/............................262
Figure 116. GISS Surface Temperature Analysis (in Blue), Station Data: Reykjavik (64.1 N, 21.9 W) Iceland and Atlantic Multidecadal Oscillation (AMO) (in Red) “ESRL AMO index” superimposed. Eastern Arctic temperatures closely track the Atlantic Multidecadal Oscillation, and show no correlation with atmospheric CO2. Source: https://realclimatescience.com/arctic-sea-ice-unchanged-from-60-years-ago/.........................................................263
Figure 117. a) ~-7,000 years with significantly higher NH summer insolation than today, whereas it was lower in the SH (opposite in winter) led to a shift of the ITCZ, located north of its present position, with the PF also displaced well to the north in the North Atlantic sector. These conditions may be representative for the average conditions between -6,000 and -8,000. b) Modern atmospheric systems of the North Atlantic region (may also represent average conditions for the period 0–3,000 years BP, where an overall ‘neo-glacial’ regime with more frequent meridional atmospheric circulation patterns. PF, atmospheric Polar Front; ITCZ, Inter-Tropical Convergence Zone. The yellow arrows indicate the dominant wind directions and explain why it rained 7,000 years in the Green Sahara, whereas dry Trade winds prevail today. After Ting et al. (2008)............ ........264
Figure 118. Differences among the GCM projections of the rate of Arctic sea ice loss. Timeline toward seasonally ice-free Arctic Ocean conditions indicated by Northern Hemisphere September sea ice extent during the twenty-first century scaled
by the 1980–2000 mean September value for each model. See Peng et al. (2020) for a forecast of the first ice-free Arctic summer year (FIASY). From Eisenman et al. (2011)...........................................................................................266
Figure 119. Global monthly average lower troposphere temperature since 1979 for the North Pole region, based on satellite observations (University of Alabama at Huntsville, USA). This graph uses data obtained by the National Oceanographic and Atmospheric Administration (NOAA) TIROS-N satellite, interpreted by Dr. Roy Spencer and Dr. John Christy, both at Global Hydrology and Climate Center, University of Alabama at Huntsville, USA. Thick lines are the simple running 37 month average, nearly corresponding to a running 3 yr average. After Ole Humlum's https://www.climate4you.com/....................... .....268
Figure 120. The graph above shows Arctic sea ice extent as of August 16, 2022, along with daily ice extent data for four previous years and the record low year. 2022 is shown in blue, 2021 in green, 2020 in orange, 2019 in brown, 2018 in magenta, and 2012 in dashed brown. The 1981 to 2010 median is in dark gray. The gray areas around the median line show the interquartile and interdecile ranges of the data, from http://nsidc.org/arcticseaicenews/ ........................269
Figure 121. Climate-related death risk has decreased 99.6% since the 1920s. From Lomborg (2020b).........................................273
Figure 122. pH of ocean water and rain water versus concentration of CO2 in the atmosphere. Calculated with (7f) ; Ocean alkalinity [Alk] = 2.3 × 10⁻³ M. Rain alkalinity [Alk] = 0. Temperature T = 25°C. After Cohen and Happer (2015).......279
Figure 123. Inorganic carbon in ocean water: bicarbonate [HCO3−], carbonate [CO32−] and total [C]= Total Dissolved Inorganic Carbon= ∑unchargedCO2 + [HCO3−] + [CO32−] versus concentration of CO2 in the atmosphere. Calculated with (7f), (7d), (7b) and ∑CO2 = α PCO2, under the assumption of complete chemical equilibrium. The ocean alkalinity is [Alk] = 2.3 × 10⁻³ F/kg (or M) and the temperature is T = 25°C. After Cohen and Happer (2015)..........................................279
Figure 124. Bjerrum plot of inorganic carbon in ocean water: DIC species met at 25°C and constant salinity as a function of pH with uncharged species [CO2(aq)] + [H2CO3] , bicarbonate [HCO3−], carbonate [CO32−]. Source Wikipedia............280
Figure 125. 550 Myr of Paleolatitudinal distribution of 2910 reef sites through pre-Quaternary Phanerozoic time. Shaded area indicates modern reef zone, and enveloping pair of lines demarcates inferred width of ancient tropical reef zone. Thick-line ellipses indicate distinct high-latitude reef provinces, dashed-line ellipses refer to isolated reefs of problematic affinity, and angular blocks indicate significant reef gaps in low latitudes. Straight dashed lines demarcate major mass-extinction events. Note that, compared to today, the ancient reef zone was often more confined. After Kiessling (2001)................... ..........281
Figure 126. Monthly SSTA (dashed line) with respect to a 47-year-long record of sea surface temperature (SST) derived from Sr/Ca and U/Ca analysis of a massive Porites coral which grew at ~-4150 B.P. in Vanuatu (southwest tropical Pacific Ocean) and 24-month running annual amplitude (solid line) according to (Corrège et al., 2000)...............................286
Figure 127. No trend for more then 330 years of pH reconstructions based on Diploastrea heliopora coral proxy records (δ11B-pH reconstruction). New Caledonia D. heliopora annually resolved records over the period 1689–2011 CE from precisely dated 230Th/U-age. a Coral δ11B signature (left y axis) with estimated seawater pH (pHSW) on the right y axis using the δ11BSW = 39.61‰ and isotopic fractionation factor (α[B3-B4]) of 1.0272. After Wu et al. (2018).......................289
Figure 128. Global surface ocean pH on the total hydrogen scale (pHT) at in-situ temperature, shows the Hot zones with a pH < 8 and Cold zones with a pH > 8.25 as explained, based on the 6th version of the Surface Ocean CO2 Atlas (SOCATv6, ~23 million observations). After Jiang et al. (2019)......................................................................................................291
Figure 129. Seawater pCO2 as a function of temperature (T). Source: Zeebe and Wolf-Gladrow (2003), Fig. 1.4.18, p. 64...........291
Figure 130. Total heat flux (dashed) versus total O2 flux from Bopp et al (2002) model (solid line). Inter-annual variations of total O2 flux and total heat flux are smoothed with a 10-year running mean. The two variables are linearly correlated (R2 = 0.95), with an out-gassing of 0.195 mole O2 m-2 yr-1, for a warming of 1 W m-2. This slope is similar for 1860 – 1960 (0.192 with R2 = 0.56) and for 1960 – 2100 including model projections (0.204 with R2 = 0.97). Adapted from Bopp et al (2002).......................................... .......................291
Figure 131. Global surface ocean CO2 flux computed from ΔpCO2 NH winter (top) and NH summer (below). The wide area located between the bold lines 0 and broadly covering the surface spanning from one tropic to the other represent where the warm oceans out-gas whereas the high latitudes NH and SH beyond the isoline 0 represent natural sinks where cold waters absorb CO2. After Bopp and Le Quéré (2009)...............................................................................292
Figure 132. Ice-core records of sulfur to infer atmospheric deposition (yellow circles) from two ice cores in Greenland and two ice cores in Antarctica. More than 100 individual eruptions are reconstructed based on the timing of sulfate deposition over the ice-sheets. Notice the Temperature anomaly and the Roman Warm Period (RWP) which compares with modern temperatures and and the MWP. After Sigl et al. (2015b).............................................................................295
Figure 133. Global volcanic aerosol forcing and Northern Hemisphere temperature variations for the past 2,500 years. a) Treegrowth anomalies and reconstructed summer temperature anomalies for Europe and the Arctic with the 40 coldest single years and the 12 coldest decades. b) Reconstructed global volcanic aerosol impact from bipolar (NH/SH) sulfate composite records from tropical (bipolar), Northern Hemisphere, and Southern Hemisphere eruptions. The 40 largest volcanic signals are indicated, with ages for events stronger than the Tambora 1815 eruption. After Sigl et al. (2015b). ............................301
Figure 134. a) left: The West European Rift Zone with its Tertiary grabens and the thickness of the lithosphere. Square: West Eifel volcanoe field. b) right: The West and East Eifel volcanic field. The NW-SE trends of both field and the tectonic structures underlying the Middle Rhine River follow the maximum compressive component of the present day stress field. Laacher See is just left (West) of Neuwied, upper-right corner. After Lorenz and Zimanowski (2008)...............306
Figure 135. MODTRAN is used to simulate the upward IR heat flux for varying conditions: a-c) top-left and bottom-left gives the reference: no Cloud or rain 400 ppm Upward IR Heat Flux 298.52W/m2. b) No Cloud or rain 800 ppm Upward IR Heat
Flux 295.19W/m2 - notice how hardly discennable it is from the reference a and d) Cumulus Cloud Base @ .66km Top @ 2.7km Upward IR Heat Flux 269.82W/m2. The flux difference between a-b is 3.33 W/m2 and between c-d is 28.7W/m2. Thus adding a cumulus cloud base has an effect that is 8.62 times more important than doubling CO2!328
Figure 136. Massive dispersion of ECS values from abrupt 4xCO2 for 20 CMIP6 models (with time-varying feedbacks), Blue bars: ECS extrapolated from 150yrs Gregory regression. Grey bars: ECS extrapolated from the last 130yr. After Yue Dong from Schmidt (2019)....................................................................................................................................................337
Figure 137. CMIP6 GCM surface temperature simulations (red, models with ECS > 3; blue, models with ECS ≤ 3) against the temperature observations (green): UAH MSU v.6.0 Tlt. From Scafetta (2021c)..........................................................338
Figure 138. Large Ensemble Models: selection, with choices from the Max Planck Institute Grand Ensemble (MPI, 100 members & four forcing scenarios, only large ensemble available that includes RCP 2.6 and a 1% CO2 scenario) from Maher et al. (2019), the Geophysical Fluid Dynamics Laboratory (GFDL SPEAR, 30 members from the RCP 8.5) from Delworth et al. (2019), the Community Earth System Model (CESM) Large Ensemble Project (NCAR – 42 members for RCP 8.5 & 15 members RCP 4.5) from Kay et al. (2015) and the CanESM2 are 50-member perturbed initial condition ensembles from 1950 to 2020, simulations were run to 2005 using CMIP5 historical forcings and then to 2020 using RCP 8.5 forcings. Next is the Demiurgic project of Zheng et al. (2022).....................................................................................342
Figure 139. Skills of weather forecast for the 36 and 72 hour forecast up to 2004, since 1955, giving the trends of the improvement of these forecast since the birth of the Numerical Weather Models, ca. 1955. After Lynch (2008)......344
Figure 140. ECMWF lead time of anomaly correlation coefficient (ACC) reaching multiple thresholds, High resolution (HRES) 500 hPa height forecasts............................... ...............345
Figure 141. Dramatic Mesoscale Convective System that struck six countries starting from Barcelona over the night of 17 to 18 August 2022 landing over Corsica with winds up to 224 km/h without any weather forecast or warning issued by "Meteo France"...........................................................................................................................................................345
Figure 142. The dramatic cold spell that left dozens of people dead in Texas alone, show the abysmal failure of “seasonal forecast” (top figure) made on Jan 21, 2021 @ 1:16 PM as compared to real “temperature map only” observed on Feb 13, 2021 @7:35 AM.............................. ..........348
Figure 143. >95% of the models have over-forecast the warming trend since 1979, whether use is made of their own surface temperature dataset, i.e. HadCRUT4 (Morice et al., 2012), or of UAH satellite dataset of lower tropospheric temperatures. After Spencer (2014)................. .....355
Figure 144. Global average mid-tropospheric temperature variations (5-year averages) for 32 models (lines) representing 102 individual simulations. Circles (balloons) and squares (satellites) depict the observations. The Russian model (INMCM4) was the only model close to the observations (Christy, 2016)...........................................................................356
Figure 145. Computer models and chaotic results: Lorenz effect. 30 results of the same program which ran with initial conditions different from one thousandth of a degree Celsius: the trends over 1963-2013 of the surface temperatures in North America are represented, between -5°C (blue) and + 5°C (red). Down on the right EM (Ensemble Mean is the mean of the 30 runs) OBS is observed conditions. Image from Kay et al. (2015) and Snider (2016), also see Buizza (2002).....357
Figure 146. IPCC-AR5 Figure 11.9 | (a) Projections of global mean, annual mean surface air temperature 1986–2050 (anomalies relative to 1986–2005) under RCP4.5 from CMIP5 models (blue lines, one ensemble member per model), with four observational estimates: Hadley Centre/Climate Research Unit gridded surface temperature data set 3 (HadCRUT3); European Centre for Medium range Weather Forecast (ECMWF) interim reanalysis of the global atmosphere and surface conditions; Goddard Institute of Space Studies Surface Temperature Analysis; National Oceanic and Atmospheric Administration for the period 1986–2011 (black lines). Note that UAH data series are not among the data sets used. Source (IPCC, 2013a), p. 981......... 361
Figure 147. IPCC-AR5 Figure 11.19 | Projected changes in annual averaged, globally averaged, surface ocean temperature based on 12 Atmosphere–Ocean General Circulation Models (AOGCMs) from the CMIP5 (Meehl et al., 2007b) multi-model ensemble, under 21st century scenarios RCP2.6, RCP4.5, RCP6.0 and RCP8.5. Shading indicates the 90% range of projected annual global mean surface temperature anomalies. Anomalies computed against the 1986–2005 average from the historical simulations of each model. Source (IPCC, 2013a), p. 993..............................................................362
Figure 148. Panel (A), SRES scenarios from IPCC AR4 WGI Figure SPM.5 (IPCC, 2007) p.14, with uncertainty bars representing, the±1 standard deviation range of individual model annual averages. Panel (B) the identical SRES scenarios showing the ±1σ uncertainty bars due to the annual average ±4 Wm−2 CMIP5 TCF long-wave tropospheric thermal flux calibration error propagated in annual steps through the projections. After Frank (2019).........................................364
Figure 149. Tropical average mid-tropospheric temperature variations (5-year averages) for 32 models (lines) representing 102 individual simulations. Circles (balloons) and squares (satellites) depict the observations. Source: Christy (2016)....382
Figure 150. Data Tampering Past The Climate Tipping Point (Goddard, 2019). Three versions of the NASA GISS Global Land Surface Temperature Anomaly. Source: Goddard (2019) https://www.youtube.com/watch? v=8tODIRhhV80&feature=youtu.be ..................... .384
Figure 151. The derivate of the increase dt2019/dt2017 of the NASA GISS Global Land Surface Temperature Anomaly. Source: Goddard (2019) https://www.youtube.com/watch?v=8tODIRhhV80&feature=youtu.be ..........................................384
Figure 152. Resulting UAH v6.0 Global Average Temperature time series of LT (lower-troposphere), MT (mid-troposphere, from MSU2/AMSU5), TP (our new “tropopause level” product, from MSU3/AMSU7) and LS (lower stratosphere, from MSU4/AMSU9) from Spencer et al. (2015)............. ..................................................387
Figure 153. Globally averaged SSTAs from ERSSTv5 (solid red line), ERSSTv4 (dotted blue line), HadISST (solid black line), and COBE-SST2 (dashed green line). For an analysis of the warming spanning 1910-1940 see Egorova et al. (2018b). Source: Huang et al. (2017)........................ ............387
Figure 154. NZ Temperature anomaly (unadjusted) as per TNZCSC (2009), b) After Salinger's undocumented adjustments: Mean annual temperature over New Zealand, from 1853 to 2008 inclusive, based on between 2 (from 1853) and 7 (from 1908) long-term station records. The blue and red bars show annual differences from the 1971-2000 average, the solid black line is a smoothed time series, and the dotted [straight] line is the linear trend over 1909 to 2008 (0.92°C/100 years) NIWA (2007), c) period 1909-2015 NIWA (2020) as per Wratt et al. (2020)..................................391
Figure 155. NZ Temperature anomaly: revised trend analysis (Gray, 2011), showing a very slight downward trend from 19091943, a sudden rise from 1945-50 and a slow rise from 1950 to 2010; after a private communication with Leyland, B., 2010. ............................................. ........................392
Figure 156. April 1st at Paris-le Bourget (now a well known airport) 1900-2019 series. It ranges between -2°C and +13°C; Source knmi-explorer. After Veyres (2020e).................. ...394
Figure 157. 1920-2020 Time-series of max and min temperatures in January at Lyon (Bron), France, green vertical lines: for each year give the range between the average of the min and the average of the max; blue and red dots extreme temperatures in January of the year considered; source: www.infoclimat.fr, After Veyres (2020e)...........................395
Figure 158. 1921-2019 July precipitations at Lyon (Bron) with a mean of 62.21 mm/month with the monthly precipitations in blue and the max precipitations for one day represented as violet dots. After Veyres (2020e)..........................................395
Figure 159. 1900-2010 Ocean Heat Content (OHC) 0-300m between 60S-60N, in ordinates the unit is 100 106 J/m2 (or 100 MJ/m2). The two periods of accelerated warming correspond to change of phases of PDO (-) and AMO (+) From Boisséson de (2017).....................................................................................................................................................397
Figure 160. Leatherman (1990), Director of the Laboratory for Coastal Research, University of Maryland, forecast a large breach in northern Assateague Island in his “Environmental Implications of Shores Protection Strategies along Open Coasts” paper, with the projected year 2020 shoreline. The 2022 Google Earth image shows how wrong he was.................416
Figure 161. USS Skate (SSN-578) was the third nuclear submarine commissioned, the first to make a completely submerged transAtlantic crossing, and the second submarine to reach the North Pole and the first to surface there..........................418
Figure 162. Effects of changing concentrations of carbon dioxide, CO2 on the filtered spectral flux Ž{i} (ν, zmp, f) at the ⟨⟩ mesopause altitude, zmp = 86 km, obtained line by line calculations (300klines) based on HITRAN. Below Planck's blue curve (area 394W/m2 for T0 = 288.7 K) is a jagged black curve, known as the Schwarzschild curve. It shows how much less the Earth radiates infrared radiation to space with the current concentration of greenhouse gases (GHG), i.e. water vapor H2O, nitrous oxide N2O, carbon dioxide CO2, ozone O3, and methane CH4. Because of the greenhouse gases, the Earth radiates 277 W/m2 to space, the area under the black curve, i.e. 70% (277/394) of what it would radiate without its oceans, its atmosphere and all the GHGs. The green line is with CO2 removed and the red curve is the radiation emitted to space if CO2 concentrations were to be doubled from 400 to 800 ppm. As can be seen, the difference is hardly noticeable, a decrease of radiation to space of about 3 W/m2, thus down from 277 to 274 W/m2, a minuscule decrease of 1.1% for a 100% increase of CO2 ! It is not hard to understand why IPPC do not want this to be shown.After van Wijngaarden and Happer (2019, 2020)....................................................................446 Figure 163. Not only contrary to what Onians (2000) stated it keeps snowing in temperate and northern regions but the whimsical climate doing what it pleases has started to surprise everybody by repeatedly snowing in unusual places where it had not for 40 years or simply ever (down-left), like the Moroccan or Algerian desert, and even in Saudi Arabia! It surely is because of global warming, isn't it? Upper left is Aïn Séfra, Algeria (Dec. 21 2016), upper/middleright is the Moroccan desert in Ouarzazate, Riad Dar Chamaa (Jan. 20 2017), (Photo credit: Christina Angell Ait Daoud), down-right is Merzouga snow-dunes early 2018 and the background picture is in Saudi Arabia (Jan 12 2020), where the Dahr Mountains and Jabal Al-Lowz in Tabuk Province were blanketed by large quantities of snow, but also Al-Lowz rural Center, Al-Abyad Valley (Al-Wadi Al-Abyad), Wadhil, Al-Uluw, Al-Mahraq and Maklaha......................463
Figure 164. Eight alternative reconstructions of the mean temperature over all land north of 20°N (observations shown by dotted line for 1871-1994). The preferred reconstruction based on principal component regression is shown by the thick line for 1402-1994. Source: Briffa et al. (2001)........ .....470
Figure 165. Comparison of Briffa et al 2008 superstick to yamal_trw chronology of Briffa et al 2013. Both in z-scores. Source: McIntyre (2013)..................................... ................471
Figure 166. % of days for all United States Historical Climatology Network (USHCN1) stations over 90 degrees F. Source: Steven Goddard (Heller, 2016)................................................................................................................................................472
Figure 167. Landesanstalt für Medien NRW, i.e. State Agency for Media NRW, slogan: Der Meinungsfreiheit verpflichtet, i.e. Committed to freedom of expression (sic!), Orwell would not believe his nightmares have become everyday truth as per his dystopian social science fiction novel, see Orwell, G., (i.e. Blair, E. A.) 1949....................................................494
Figure 168. Tropical Cyclone Tracks, since 1949 in the pacific and since 1851 in the Atlantic. Mark Hertsgaard must tell the deniers which one they are responsible of? Which cyclone must the scapegoats be accountable of? Does Mark Hertsgaard believe that even if mankind were to disappear entirely from this planet, tropical cyclones would suddenly cease to exist? How come? Appalling........ ................................................496
Figure 169. Image of the calculated Table for the ECS of 0.84°C, that gives for each country its emissions in MtCO2/yr, the % of the total emissions (35881 MtCO2/yr) that it represents, its annual contribution to the yearly warming and its contribution to the warming until 2050 if emissions keep going unabated until then.................................................499
Figure 170. Science made by IPCC during a Summary for Policymakers (SPM) writing meeting (Lynn, 2016). In February 2022, the Intergovernmental Panel on Climate Change (IPCC) took an unprecedented step, citing mis- and disinformation and the “politicization of science” as key barriers to action. King et al (2022) report “For the first time, a document accepted by all Member Governments stated that rhetoric from “vested economic and political interests… undermines climate science”. Who politicized and trashed science? It is the pot calling the kettle black!................510
Figure 171. Detailed monthly mean carbon dioxide measured at Mauna Loa Observatory over 2017-2022, Hawaii, After https://gml.noaa.gov/ccgg/trends/.............................................................................................................................515
Figure 172. Fraction of all-cause mortality attributable to moderate and extreme hot and cold temperature by country. Extreme and moderate high and low temperatures were defined with the minimum mortality temperature and the 2.5th and 97.5th percentiles of temperature distribution as cutoffs. From Gasparrini et al. (2015)............................................519
Figure 173. Sequence of dated past neoglaciation events at high-elevation locations in the Alps. Note the general correspondence between glacier maximum age and its altitude. The blue shaded area indicates the period of continuous ice cover. Also shown are the tree line reconstruction from Kaunertal (Nicolussi et al., 2005). After Bohleber et al. (2020)............................. ...............522
Figure 174. One reconstruction of the air temperature of the Northern Hemisphere, i.e. at the summit of the Greenland ice sheet, derived from Greenland ice cores, GISP-2. It provides a brief context to show the wider natural range of temperature over the last 11,000 years, some variations exceeding ±3°C over a century or so (e.g. 8.2 kyr event). Also notice that at the beginning of the Holocene, the Central Greenland ice core record shows 10°C (18°F) of warming in 144 years, from 11,755 BP to 11,611 BP (May, 2020a). The drop at 5480 BP corresponds to an extreme solar minima (Miyake et al., 2017, 2021) and a global climate change regime known as the 5.2 kyr event (Thompson et al., 2006). From climate4you.com but also matches perfectly Fig. 5, p. 1219 given by Akasofu (2010) and Ball (2016b). Data from ftp://ftp.ncdc.noaa.gov/pub/data/paleo/icecore/greenland/summit/gisp2/isotopes/..............................................523
4.2 ka BP mega drought...................15, 147 sv, 164, 526
8.2 ka Cold Event..................................15, 153, 165, 526
Airborne Fiction...........................................................61
Akkadian Empire....................................147 sv, 164, 526
Albert Arnold Gore Jr......23, 187, 240, 268 sv, 434, 443, 452, 455, 459 sv, 473, 491
Albert Einstein..................................................................
quote............................................................................654
Alfred Wegener............................21, 118, 174, 328, 488
Aristarchus of Samos..............................................21, 26
Aristotle........................................................................21
Atlantic Meridional Overturning Circulation (AMOC)...... response to freshwater inputs & IRD............................159 weakening of................................................................258
Bølling–Allerød..158 sv, 165, 253, 257 sv, 286, 447, 527
Carl Sagan........................................................29 sv, 490
Catastrophic Anthropic Global Warming (CAGW)30, 51, 81, 96, 103 sv, 112, 114, 116, 121, 125, 127, 132, 139, 159, 165, 171, 184 sv, 190, 211, 238 sv, 247, 251 sv, 259, 263, 271, 358, 371, 390, 392 sv, 396 sv, 399 sv, 417, 420, 424, 439, 442, 447, 449 sv, 454 sv, 460 sv, 464, 467, 487 sv, 490, 492 sv, 496, 518, 524 sv, 528 sv, 534 sv
consensus.........................................................................
Cook et al. (2013)...........................................................30
consensus wreckers.................................
Alfred Wegener..............................................................22
Barbara McClintock........................................................22
Galileo Galilei..................................................................21
Giordano Bruno..............................................................21
Rudolf Virchow...............................................................22
Dansgaard-Oeschger..................................158, 163, 438
event 19.......................................................................163
solar origin (of).............................................................158
deglaciation......................................................................
sequence of events.......................................................257
Earth..............................................
solar flux.....................................................30, 70, 79, 529
Earth System Sensitivity (ESS)..........................................
definition........................................................................88
equations............................................
Catastrophic Anthropic Global Warming (CAGW)........115
Equilibrium Climate Sensitivity (ECS)............................... definition............................................................16, 88, 96
Eratosthenes of Cyrene..........................................21, 26 fact-checkers (confusers).................................................
Ottmar Edenhofer........................................................430
Reuters.........................................................................494
François-Marie Bréon................................117, 455, 479
Fred Singer.....................................................19, 29, 491
Freeman Dyson.....18, 20, 80, 118, 128, 328, 334, 355, 398, 439, 457, 466 sv, 517, 538, 654
George Stokes..........................................................375 glaciation.............................................
Andean-Saharan.................................136, 181, 188, 282
Cryogenian.................................................................188
Cryogenian188...........................................................136 extinctions (trigerred by)....................................189, 282 global (snowball Earth)..............................................189
Huronian................................................................187 sv
Huronian187..............................................................136
Karoo.........................................................................282
Late Paleozoic............................................................188
Late Paleozoic190......................................................136
Marinoan...................................................................282
Mi-1...........................................................................282
mid-Brunhes (Climate Transition)..............................168 next (to come)......................................................27, 156 Oi-1....................................................................176, 282 Oi‐2b..................................................................176, 282 Oligocene...................................................................175
Ordovician..................................................................454
Quaternary.........................................................137, 169 termination..................................................................55
green Sahara.......121, 136, 147 sv, 165, 220, 264, 512, 523, 526, 533
half-life...........................................................39, 41, 46
Hans Suess........................................... effect......................................................................36, 43 Harrison Schmitt........................................................23
Heinrich............................................ event..................................................................158, 228 mode..........................................................................229 stadial.........................................................165, 286, 527 stadial 1 (H1)......................................................149, 159
Henry Louis Le Chatelier..........................................137
Henry Navier............................................................375
Henry-Louis Mencken..............................................520
Henry's law...............................292, 436, 460, 529, 533
Hvalsey Church........................................................262
Inter Tropical Convergence Zone (ITCZ)........................ neoglacial regime.......................................................523 shift South of (during Holocene)................................150 southward displacement of.......................................159 isopycnic surfaces.................................... definition......................................................................37
Ivar Giaever, Nobel Laureate in Physics (1973).........23
James Hansen..............19, 38, 417, 439, 473, 484, 532
Jean-Pascal Van Ypersele.......................23, 422 sv, 473 Johannes Kepler...........21, 26, 321, 356, 381, 443, 474 Laschamps event...........................................................
consequences...............................................................152
Last Glacial Maximum.....14, 137, 158, 160, 238 sv, 527, 533
lifetime or residence time......................................39, 46
logical fallacies........................................
ad-hominem............................................27, 244, 431, 513 argument from adverse consequences........................512 argument from authority...22, 26, 130, 247, 389, 426, 443 confusion of correlation and causation..51, 137, 389, 423, 443
post hoc ergo propter hoc....................................283, 529 statistics of small numbers.............................................24
lysocline............................................
lysocline (definition).....................................................177
Mars................................................
atmosphere....................................................................71
ground pressure.............................................................71
solar flux...................................................................30, 79
Maurice Strong..................402 sv, 411, 433 sv, 439, 441
Near-Earth Objects (NEO)................................................
Apophis........................................................................185 collision with................................................................534 definition........................................................................43
neoglaciation.......................................... high-elevation glaciers..................................................523
Nicolaus Copernicus.......................................21, 26, 487 periodogram..........................................
definition......................................................................199
Potentially Hazardous Objects (PHO)..................... inventory......................................................................185 resonance (orbital)........................197, 204 sv, 521, 525
Richard Lindzen..19, 27, 180, 267, 310, 398 sv, 465, 537
Richard Lindzen736,...................................................653
Richard P. Feynman.....................................
quote..............................................................25, 451, 654
Roger Pielke Sr...................................... resignation letter to IPCC..........................................9, 437
Sadi Carnot...............................................................7, 21
tachocline...................................................204, 206, 525
Tim Ball.......................................................................410
Transient Climate Response (TCR)...................................
definition........................................................................88
Tycho Brahe...............................................................381
United Nations Framework Convention on Climate Change (UNFCCC)..................................... creation..................................................................27, 403 mission, objective.........................................................436
Strong, M. - Earth Summit............................................433
UNFCCC........................................................................437
Venus................................................................................
atmosphere....................................................................71
ground pressure.....................................................71, 453
solar flux.................................................................30, 79 surface temperature..................................................453 volcanic eruptions.......................................................... 536-540 CE.................................................................305
Agung.........................................................................296
Askja..........................................................................297
Cosigüina....................................................................297
Deccan.......................................................................184
Deception Island........................................................303
El Chichón...........................................................294, 296
Eldgjá.........................................................................300
Etna....................................................................293, 302 Fujiyama.....................................................................141
Grímsvötn..................................................................298
high-latitude stratospheric eruptions........................304
Huaynaputina.............................................................299
Hunga Tonga–Hunga Ha'apai.....................................295
inatubo.......................................................................295
Kolumbo.....................................................................302
Krakatau.....................................................................297
Ksudach..............................................................297, 301
Kuwae........................................................................299
La Garita.....................................................................178
Laki.....................................................................294, 298
Large Igneous Provinces.............................................307
Mount Gamkonora....................................................299
Mount Pinatubo.............................................157, 294 sv Mt St Helens...............................................................296
Novarupta..................................................................296
Okataina.............................................................297, 300
Paektu Mountain.......................................................300
Parker.........................................................................299
Phlegraean Fields...............................................161, 303
Piton de la Fournaise..................................................141
Rabaul........................................................................301
Samalas......................................................................300
Santa Maria................................................................297
Santorini.....................................................................141
Serua/Banda Api........................................................299
Tambora.....................................................................298
Tarawera....................................................................302
Tarawera / Taupo.......................................................302
Toba...........................................................................303
Vesuvius.............................................................141, 302
Yellowstone...............................................................307
William Happer......................19, 187, 465, 491 sv, 537
William Happer734..................................................652
William Henry..........................................................456
Henry's law...47, 51 sv, 86, 129, 131, 137, 155, 160, 166, 172, 176, 180, 218, 258, 278, 280, 374 Henry's law constants..................................................51
Younger Dryas149, 158 sv, 161, 165, 253, 257 sv, 286, 305, 447, 527, 533 ......................328, 334
I am grateful for the reviews and support I received and I have deeply appreciated them. Let me mention the following:
“I have never seen a more thorough and complete book on the Earth's climate than this extensive work. Patrice, congratulations!” — personal communication, September 19, 2022. Dr. Ir. A.J. (Guus) Berkhout735. Pr. Berkhout accepted in 1976 a Chair at Delft University of Technology in the field of geophysical and acoustical imaging. During 1998 –2001 he has been a member of the University Board. Pr. Berkhout has developed a large number of geophysical concepts and algorithms. He has written several hundred scientific papers and a number of books in the field of geophysics and innovation. In 1997, he was invited by the OECD to advice on science and technology issues. Professor Guus Berkhout is a member of the Royal Netherlands Academy of Arts and Sciences (KNAW), of the Netherlands Academy of Engineering (AcTI), honorary member of the Society of Exploration Geophysicists (SEG) as well as honorary member of the European Association of Geoscientists and Engineers (EAGE).
“Your book looks terrific. :-) I truly hope it receives wide readership, Patrice. From the news, it seems the entire world is reaching 'peak-stupid' as regards climate. Your book shows a path back to sanity. Very best, Pat.” — personal communication, September 14, 2021. Dr. Patrick Frank736 is a scientific affiliate, Stanford Synchrotron Radiation Lightsource/SLAC, National Accelerator Laboratory, Stanford University, CA, USA.
“Dick Lindzen brought your work to my attention a few months ago. We both think it is excellent. Your book has an immense amount of material, all of it with good literature citations. The historical discussions of Arrhenius and other pioneers is very well done. It is clear that you haver personally read what these people wrote, and are not repeating second-hand sources. I like the rigor of your discussions of key issues with crisp and appropriate equations. For example, even in very good text books on radiative transfer, it is unusual to see a discussion like yours on how exponential-integral functions can be used to efficiently account for the contribution of slant rays to the vertical flux through the atmosphere. I hope you will continue your work in this area. The world needs you. Best wishes, Will.” personal communication, March 13, 2021 — Pr. William Happer737, is the Cyrus Fogg Brackett Professor of Physics, Emeritus, at Princeton University, NJ, USA, and a long-term member of the JASON advisory group, where he pioneered the development of adaptive optics. From 1991 to 1993, Will Happer served as director of the Department of Energy's Office of Science as part of the George H.W. Bush administration. William Happer is a fellow of the American Physical Society. Happer was elected as a member of the American Academy of Arts and Sciences in 1995 and a member of the National Academy of Sciences in 1996
“Dr. Patrice Poyet, the author of “The Rational Climate e-Book” is one of the rare individuals of a species under risk to become extinct, i.e., that of scientists with broad knowledge, neat thought and adherence to reason. He is also a seeker of truth irrespective of other interests, which means that he serves real science and philosophy, as it was imagined and defined by Plato and Aristotle, who also distinguished it from sophistry. The book is an excellent alloy of physics, mathematics, climatology, geosciences, scientific reasoning, and review of concepts, including their historical development. Its fascinating style of writing makes its reading both enjoyable and enlightening.” personal communication, September 15, 2022 — Pr. Demetris
735https://www.aj-berkhout.com/bio/
736https://www.researchgate.net/profile/Patrick-Frank-4
737https://en.wikipedia.org/wiki/William_Happer and https://phy.princeton.edu/people/william-happer
Koutsoyiannis - Professor (retired) of Hydrology and Analysis of Hydrosystems in the National Technical University of Athens738, Greece. Demetris has served as Dean of the School of Civil Engineering, Head of the Department of Water Resources and Environmental Engineering, and Head of the Laboratory of Hydrology and Water Resources Development. He has been awarded the International Hydrology Prize – Dooge medal (2014) by the International Association of Hydrological Sciences (IAHS), UNESCO and World Meteorological Organization (WMO), and the Henry Darcy Medal (2009) by the European Geosciences Union (EGU).
"Your book is amazing. I may not agree with everything in it, but the intensity of your research is beyond anything that I've seen. Best wishes for a better 2021, Dick", personal communication, December 15, 2020 — Pr. Richard Lindzen739, Professor of Earth, Atmospheric, and Planetary Sciences, Emeritus, Alfred P. Sloan Professorship in Atmospheric Sciences, Massachusetts Institute of Technology, Cambridge, MA, USA. Richard Lindzen was a lead author of the AR3's Chapter 7, "Physical Climate Processes and Feedbacks" of the IPCC, he is also a member of the US National Academy of Sciences.
"I really enjoyed the holistic approach of your analysis. In another sense, this text is a very sharp knife, rare to find, in today's mediocre world of science. This is as valuable as the evidence presented by the calculations in the text.", personal communication, July 22, 2022 — Prof. Dr. Juan José Neiff740 - Senior Researcher at Center for applied Ecology (CECOAL - National Council for Scientific and Technical Research), Universidad Nacional del Nordeste, National University of the Northeast, Argentina. His interest involve the dynamic and sustainable use of river and wetland systems, especially those that allow to analyze the dependence of the ecological structures and processes regarding the hydrological regime. He has worked in river and wetland systems since 1970 and Neiff's team has developed the software PULSE (http://www.neiff.com.ar)
“Dear Patrice, Congratulation with a monumental work of great value.“ email to Clintel discussion list, September 21, 2022 — Pr. Jan-Erik Solheim741, Professor Emeritus of The Institute of Theoretical Astrophysics at University of Oslo, and studies Ionosphere, Ecosystem Functions and Services, and Environmental Systems Analysis. Jan-Erik is also Professor at The Arctic University of Norway (UiT) and was the head of the Scientific and Technical Committee for the Nordic Optical Telescope, which was built on La Palma, Canary Islands. He participated in the organization of an international astronomical observation network — The Whole Earth Telescope.
“Dr. Patrice Poyet is a generalist as all good scientist should be. He has produced a very much needed comprehensive review of climate science bringing in the broadest possible ranges of expertise including geological science, planetary orbital dynamics, computer modeling to detailed knowledge on radiative transfer as well as the deeper understanding and application of thermodynamics. I admitted to not having the time to fully master Dr. Poyet's magnum opus but I would recommend those that wish to hear from a truly independent and unbiased view on climate science to study his e-book offered freely to all who wish to learn. This a true labor of love that I, for one, deeply appreciate Dr. Patrice Poyet's contribution to the discussion and debate.” personal communication, September 7, 2022 — Dr. Willie Soon742, astrophysicist and geoscientistAstrophysicist at the Solar, Stellar and Planetary Sciences Division of the HarvardSmithsonian Center for Astrophysics (CfA) since 1997 and former Astronomer at the Mount Wilson Observatory, CA, USA (1992-2009).
738http://www.itia.ntua.gr/dk/ Demetris Koutsoyiannis retired as of September 1, 2022.
739https://en.wikipedia.org/wiki/Richard_Lindzen and https://eapsweb.mit.edu/people/rlindzen
740https://www.researchgate.net/profile/Jj-Neiff and https://en.unne.edu.ar/
741https://www.researchgate.net/profile/J-E-Solheim
742https://www.ceres-science.com/willie-soon and https://lweb.cfa.harvard.edu/~wsoon/
“In the modern world, science and society often interact in a perverse way. We live in a technological society, and technology causes political problems. The politicians and the public expect science to provide answers to the problems. Scientific experts are paid and encouraged to provide answers. The public does not have much use for a scientist who says, “Sorry, but we don’t know.” The public prefers to listen to scientists who give confident answers to questions and make confident predictions of what will happen as a result of human activities. So it happens that the experts who talk publicly about politically contentious questions tend to speak more clearly than they think. They make confident predictions about the future, and end up believing their own predictions. Their predictions become dogmas which they do not question. The public is led to believe that the fashionable scientific dogmas are true, and it may sometimes happen that they are wrong. That is why heretics who question the dogmas are needed.”
— Freeman Dyson, Professor Emeritus in the Institute for Advanced Study in Princeton and a member of the Board of Sponsors of the Bulletin of the Atomic Scientists, excerpt from “Frederick S. Pardee Distinguished Lecture” (Oct 2005), Boston University. Collected in 'Heretical Thoughts About Science and Society', A Many-Colored Glass: Reflections on the Place of Life in the Universe (2007), 43-44.
“The whole point of science is to question accepted dogma.”
― Freeman Dyson
“ Unthinking respect for authority is the greatest enemy of truth.”
― Albert Einstein, Nobel Prize in Physics in 1921
“I would rather have questions that can't be answered than answers that can't be questioned.”
― Richard P. Feynman, Nobel Prize in Physics in 1965 jointly with Julian Schwinger and Shin'ichirō Tomonaga.
“No government has the right to decide on the truth of scientific principles, nor to prescribe in any way the character of the questions investigated.”
― Richard P. Feynman in “The Meaning of It All” (1998), p. 57
“The global warming scam, with the (literally) trillions of dollars driving it … has corrupted so many scientists … It is the greatest and most successful pseudoscientific fraud I have seen in my long life as a physicist.” (October 6, 2010 resignation letter to the American Physical Society)
― Harold W. Lewis, Emeritus Professor of Physics and former department chairman at the University of California, Santa Barbara (UCSB)
“This IPCC report [The Science of Climate Change 1995], like all others, is held in such high regard largely because it has been peer-reviewed. That is, it has been read, discussed, modified and approved by an international body of experts. These scientists have laid their reputations on the line. But this report is not what it appears to be -- it is not the version that was approved by the contributing scientists listed on the title page. In my more than 60 years as a member of the American scientific community, including service as president of both the National Academy of Sciences and the American Physical Society, I have never witnessed a more disturbing corruption of the peer-review process than the events that led to this IPCC report”.
― Frederick Seitz, 4th president of Rockefeller University from 1968–1978, and the 17th president of the United States National Academy of Sciences from 1962–1969. Seitz was the recipient of the National Medal of Science, NASA's Distinguished Public Service Award, and other honors

The second edition of “The Rational Climate” has been significantly improved and extended and aims, as the first, to address all aspects of climate and paleo-climates, from atmospheric physics, to astronomical influences and geological and geochemical drivers. It covers the computer models claiming to simulate the climate and the policies that are projected from them.
Climate science has reached a tipping point, where it has become a requirement to be rational again. One cannot stay idle, twiddling his thumbs when our most fundamental freedoms are going to be threatened by an unfounded climate urgency.
The worse predictions have been made for 50 years and none of them has ever happened to become true. Time to revisit and analyse the scare mongers strategies. For example, despite the unsupported claims that the Maldive islands will be submerged by 2050, 97% of them have grown so far, for various reasons having nothing to do with "climate change".
Do not forget that in 1970, quite exactly 50 years ago, the first Earth Day promoted ice age fears, and environmentalist Nigel Calder warned "The threat of a new ice age must now stand alongside nuclear war as a likely source of wholesale death and misery for mankind" and C. C. Wallen of the World Meteorological Organization said "The cooling since 1940 has been large enough and consistent enough that it will not soon be reversed".
Science is a never ending journey, how could it be settled?
https://patricepoyet.org/
e-ISBN 978-99957-1-929-6 delivered by Malta's NBC/CPL National Book Council Central Public Library – Floriana MALTA