5 minute read
9.4.2. Accuracy of the individual records of PSV

The NRM intensities of both Spanish and Chinese speleothems were low. These
low NRM intensities are common in speleothems and have been reported by several
Advertisement
workers (Latham et al, 1986, 1989; Perkins and Maher, 1993; Lean et al, 1995 amongst
others). The NRM intensity will be a function of the type(s) of magnetic mineral and of their concentrations. These increased errors (derived from magnetometer noise and
incompletely nulled field during measurement and demagnetisation) coupled with the measurement of the low NRM intensities have decreased the precision of the directions
obtained from some sub-samples. In this study precision was indicated by the MAD (095
in the case of SC01). It was noted that an increase in directional scatter occurred during
demagnetisation of the weakest sub-samples and during the later stages of
demagnetisation in the stronger sub-samples. Despite this directional scatter the majority
of directions trended towards the origin of the Zijderveld plots after the removal of any VRM. This was interpreted to be the primary remanence in each case.
Unfortunately, none of the Chinese speleothems were of sufficient width to allow
double sub-sampling i.e. two parallel vertical slices. This method of sample preparation
would allow at least two adjacent coeval sub-samples to be taken from the drip-cap of one central vertical slice (Figure 5.4). A second set of coeval sub-samples could be taken
from the drip-cap of the second slice (a method used by Latham et al, 1989 for example).
Thus, four directions may be obtained per horizon. Records produced from sampling in
this fashion would have allowed a) inter-central slice comparisons b) intra-horizon
directional consistency checks and c) a potential reduction in the measurement errors by
allowing directions to be combined using Fisher statistics (Fisher, 1953). Limited double sub-sampling of this nature was possible with TR02. The second set of sub-samples were
taken from the single vertical slice where the drip-cap was of sufficient width.
Unfortunately, because of the weak magnetic signal no reliable directions were obtained.
Tests for the presence of inclination errors within the Chinese and Spanish
speleothems were not exhaustive, primarily due to a lack of sufficient lateral material
after sub-sampling. However, the tests performed (Chapters 6 and 7) indicated that there
suggests that errors due to surface effects were less the measurement errors. Differences
in the directions obtained from coeval central and lateral sub-samples may be explained by the inclusion of some non-coeval material. However, despite the directional similarity
between coeval sub-samples, the majority of Chinese records exhibited mean inclinations that were shallower than the GADF. The cause of this shallowing was thought originate
from the cutting of each speleothem on the rock saw as discussed previously.
Good correlations existed between the individual speleothem PSV records
(Figure 6.30) and with other contemporaneous records (Figures 6.31a and b). This
illustrates that each speleothem has recorded PSV with reasonable accuracy. In some
respects the fact that the individual PSV records from the Xingwen speleothems
compared closely made up for the inability to obtain directions from multiple sub
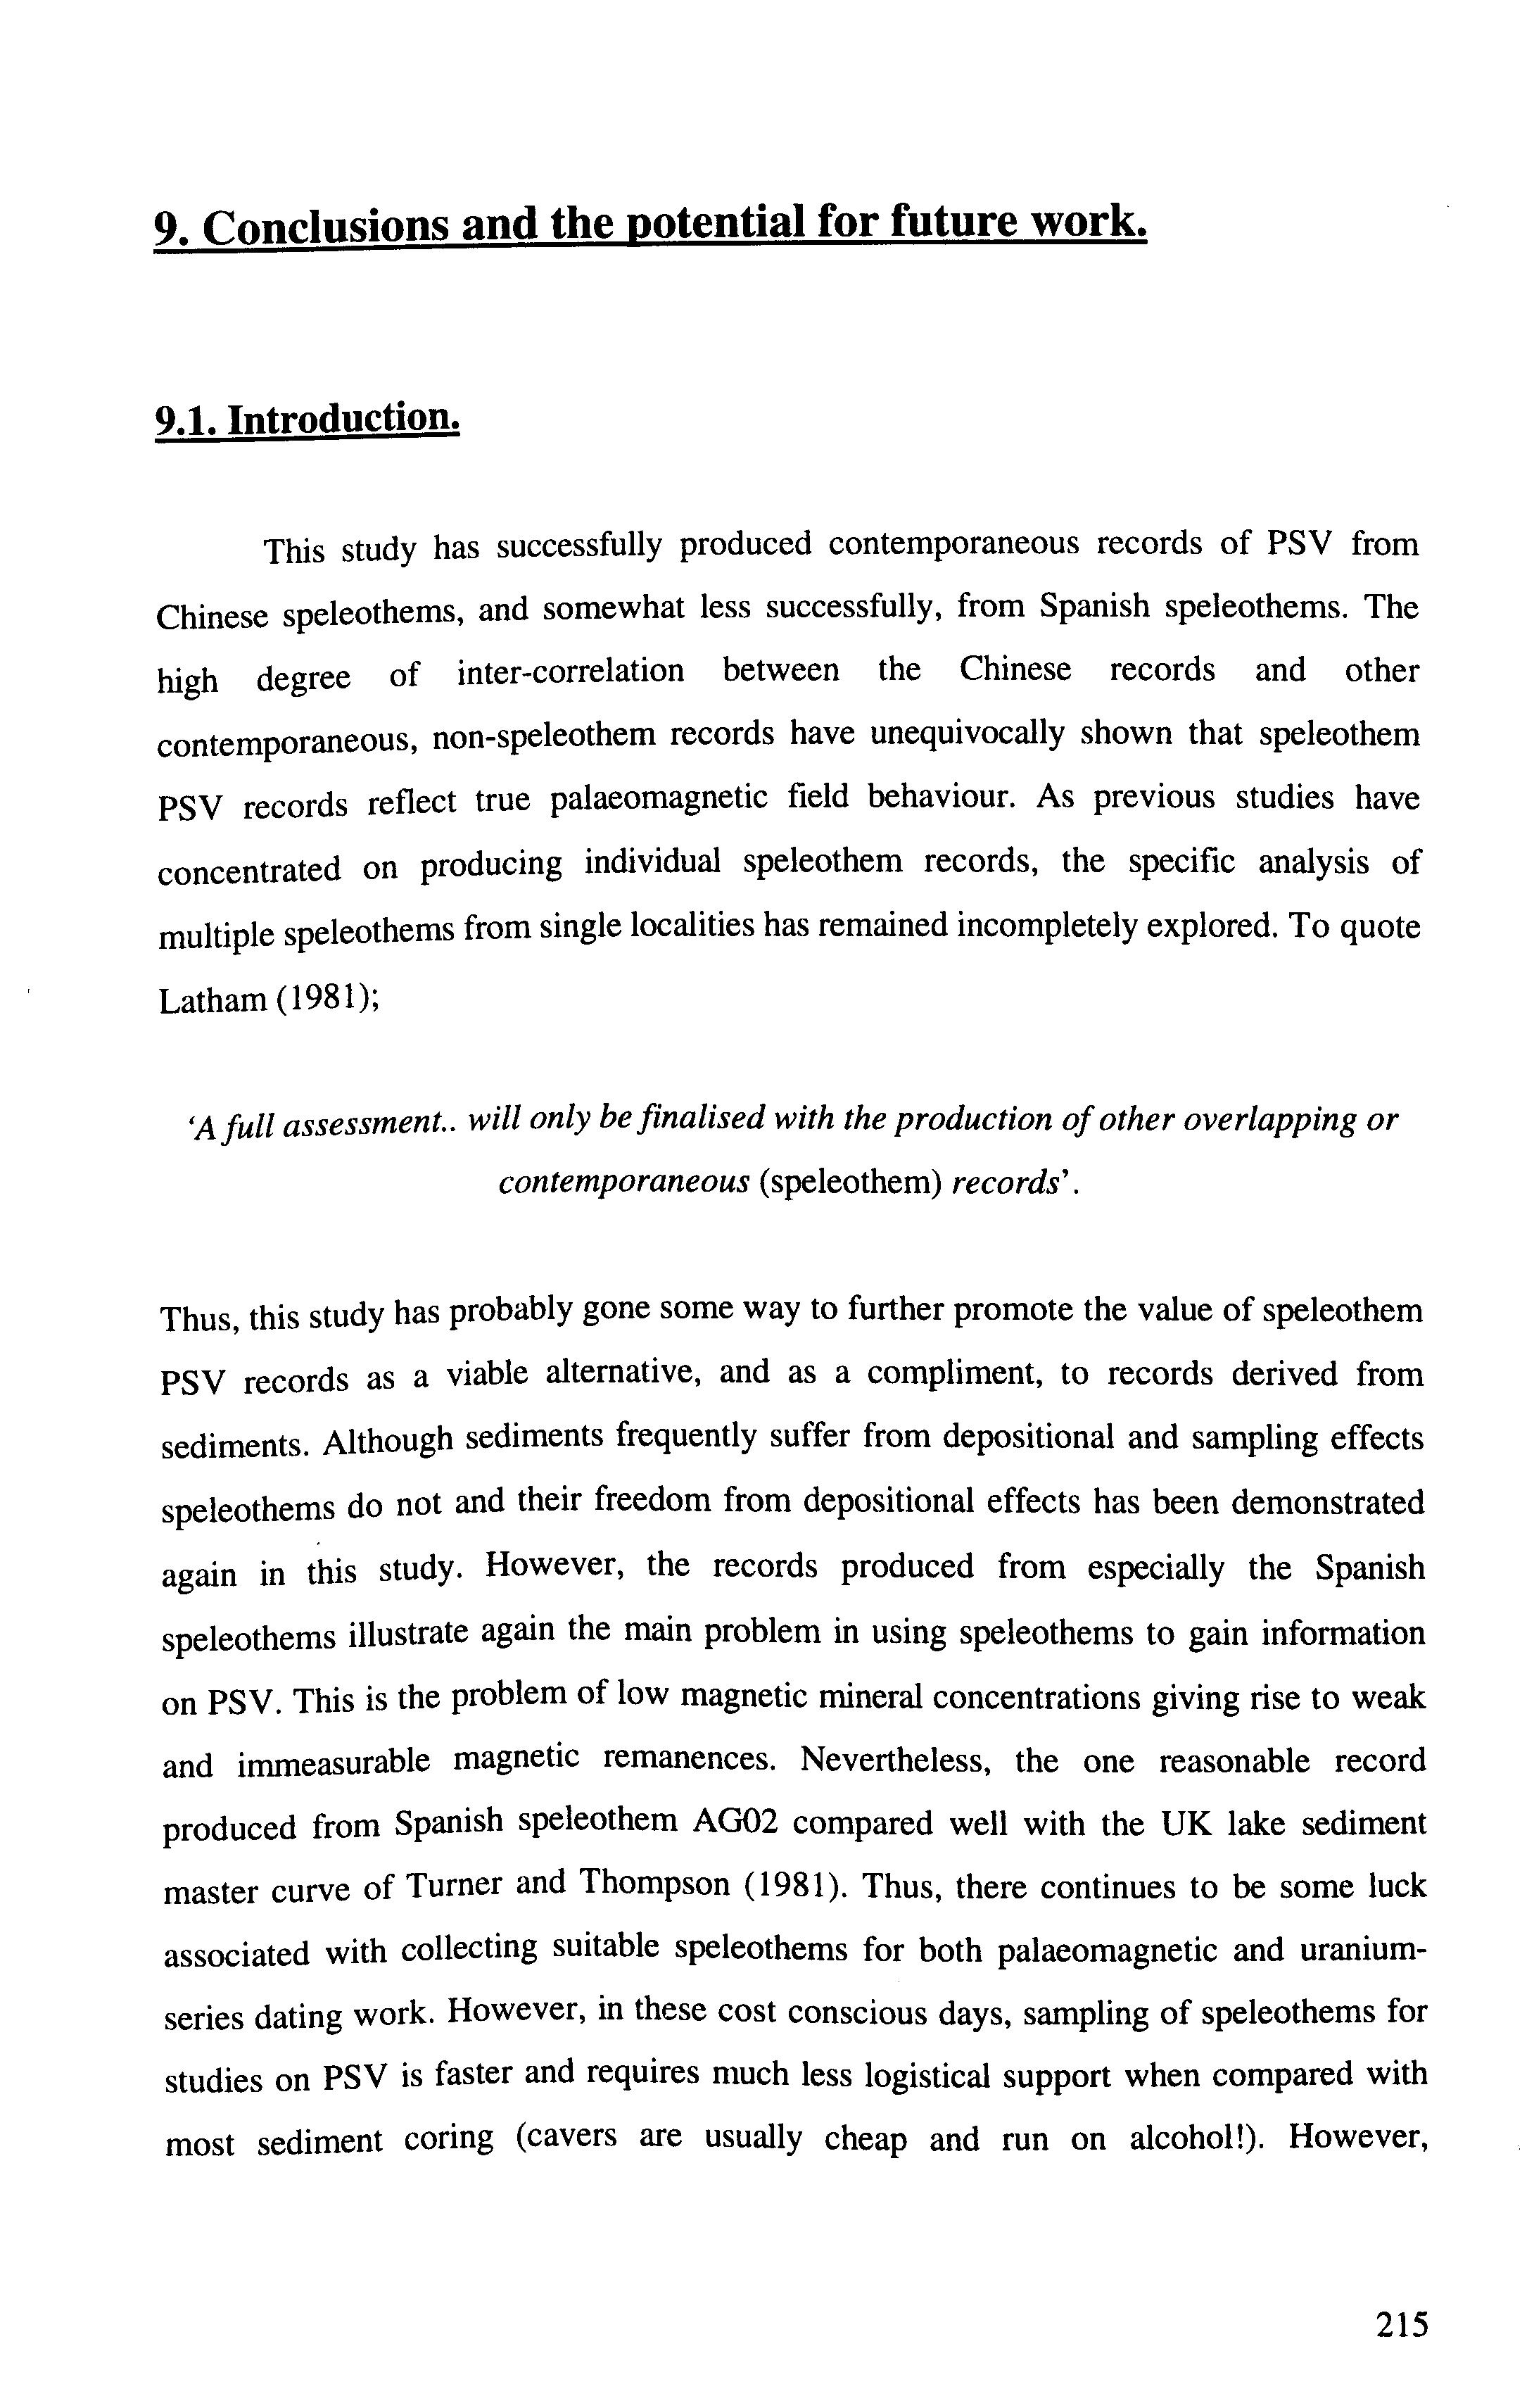
samples from each horizon. In addition, this study has shown that the time resolution of
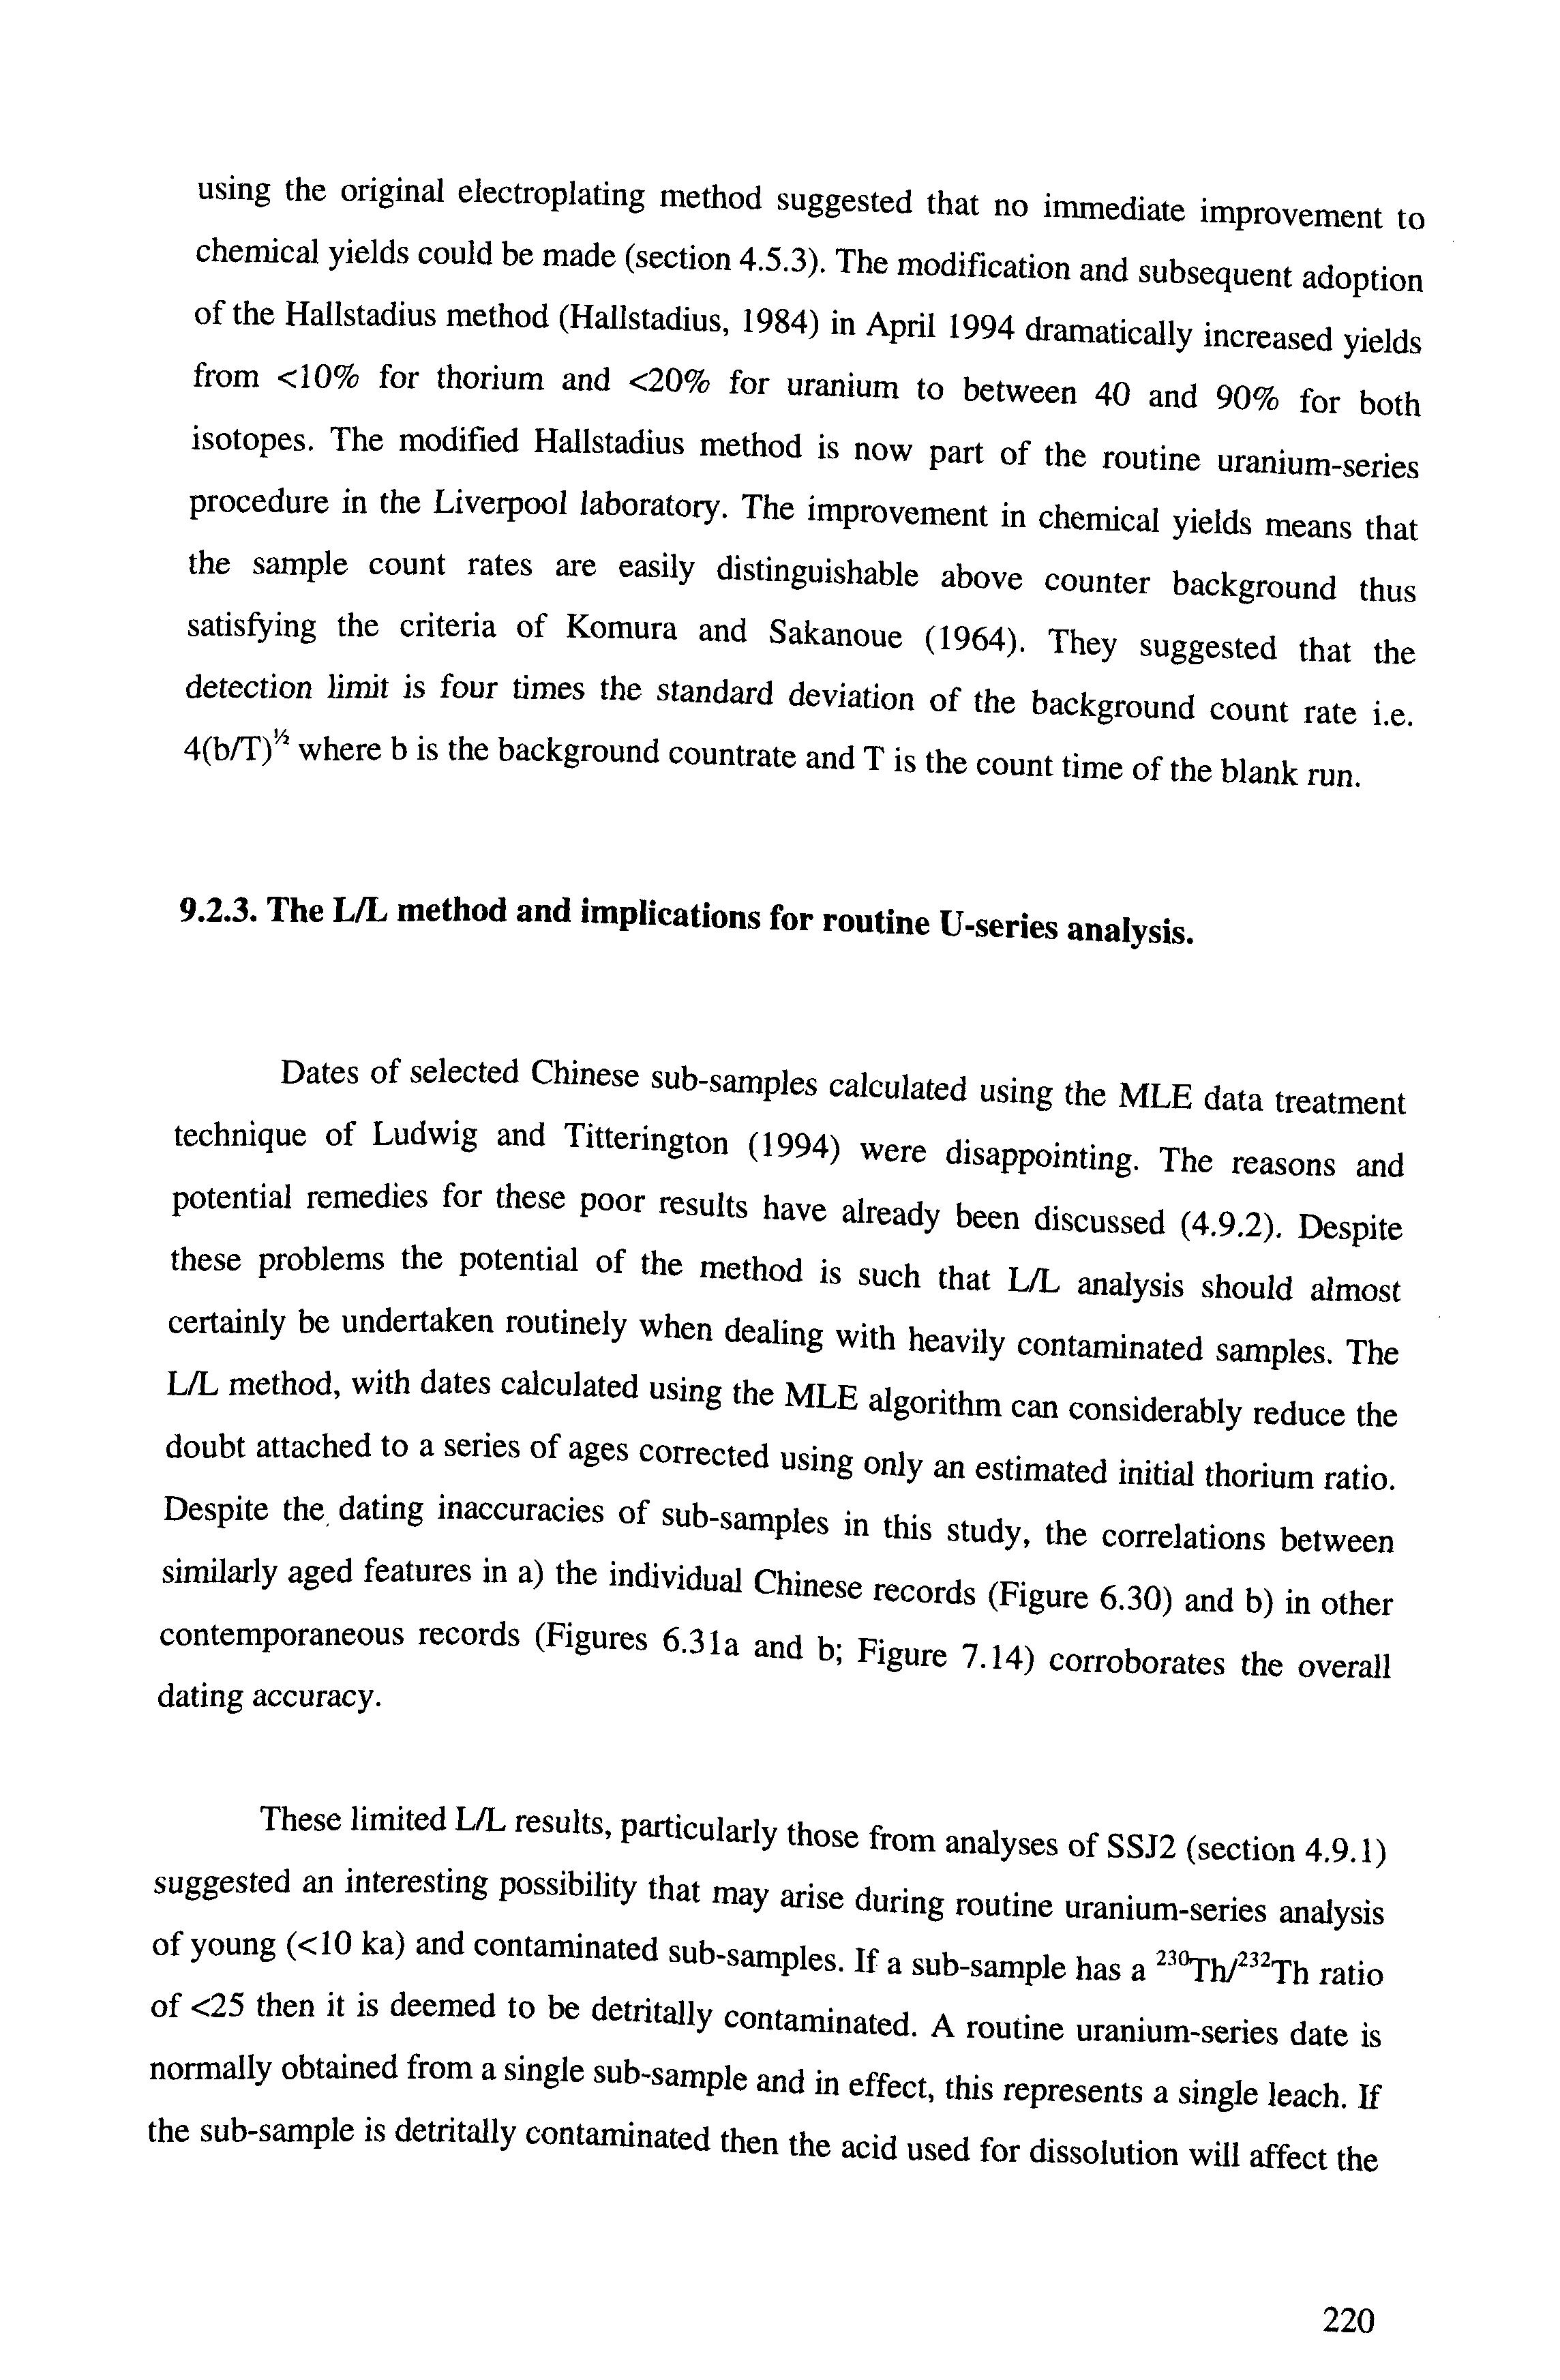
recorded PSV is affected by speleothem growth rate. This relationship is shown in Figure
9.3 by comparing the sub-sample resolution against growth rate and VGP dispersion.
< O ~o

Q. W-
X3 (D
52. O =3 Figure 9.3. The relationship between sub-sample resolution, speleothem growth rate and VGP dispersion. ° 225

records which are contemporaneous but which have differing sub-sample resolutions.
Thus, the detail in a high resolution record should be represented in a lower resolution record but with the latter having decreased amplitude and detail. In order to assess the effects of a slower growth rate and hence a lower resolution of recorded PSV, the higher
resolution records of PT02 and PT04 have been smoothed using a cubic spline approximation and then time-averaged over 400 year intervals using a 9-point smoothing
filter. This has the effect of lowering the resolution of PSV recorded in sub-samples of PT02 and PT04 to approximately that in SC01 and SC02 (respectively 335 and 404
years per sub-sample). From Figure 9.4 the time-averaged data of PT02 and PT04
compare reasonably well in detail, amplitude and timing of recorded directions,
particularly in declination. However, feature v in the inclination record of PT04 is more
difficult to correlate with the other records and appearing approximately 0.5 ka earlier.
However, these comparisons suggest that SC01 and SC02 are indeed recording the same
features of PSV as PT02 and PT04 but with a lower resolution.
Figure 9.4 also compares the 1995 IGRF model values of declination and
inclination at latitude 28 N taken at intervals of 20° in longitude as if the present day

field at this latitude had drifted westwards past Xingwen at a rate of 0.13° yr'1 equivalent
to one full cycle of westward drift. This rate of non-dipole drift is similar to those
reported by several authors for Asia (Hyodo et al, 1993; Yang et al, 1993 and Aitken et
al, 1989). Thus, the topmost values of declination and inclination of the IGRF in Figure
9.4 are the present day values at Xingwen. The agreement between directions of these
records are good particularly for declination. The amplitudes of variation in the IGRF
record are of the same order of magnitude as the speleothem records (±~25°) and the timing of recorded features are quite close considering dating inaccuracies associated
with each speleothem record. This suggests that some features of declination and inclination result from the passage of non-dipole sources which have drifted westward
past Xingwen.

Inclination


A comparison with the drifted IGRF mnH»i , ,lUKh model has also been made for the Spanish record of AG02 (Figure 9.5). The PSV rpmrriV record also m ashes the general pattern of the IGRF model values a, 43°N however, ,he c o n a tio n is less convincing ihan for ihe
equivalent comparison using the Chinese speleothems. This is partly due to the iack of detail in the record of AG02 and also nartu, a,, t . . .so partly due to the lack of data from Matienzo in general. Greater difficulty was also e n c o u n te r i„ comparing the UK master curve (Turner and Thompson, 1981) especialiy in i„clination. There „ ^ significant ^ the timing of what appear to be the samp • .u . r^ ^ same matures in the UK record and in the AG02 record and the IGRF construction. This is mnct i;^ i, * . ,i ms is most likely to be due to the -10° latitudinal separation between Matienzo and the UK flparh,nearly, when more records are available from Matienzo a better interpretation may be possible