9 minute read
Analysis of Production Process, Miroslav Pristavka, Veronika Hrda, Hristo Beloev, Pavol Findura, Vladimir Krocko

from Agricultural, Forest and Transport Machinery and Technologies (ISSN: 2367– 5888) vol VI, 2019
by kangalov

Analysis of Production Process
Miroslav Pristavka, Veronika Hrda, Hristo Beloev, Pavol Findura, Vladimir Krocko
Advertisement
Abstract: In the paper we will deal with analysis and consequent application of statistical methods in quality management. We will describe adequate methodology and quality management by detection of a meter competence, production process and finding out the reasons of nonconforming steps in a production. The given suggestions of methods can significantly contribute to lower economic production aspects and individual position solutions of quality management in the Kongsberg Automotive s.r.o Vráble organization. Kongsberg Automotive has established quality management according to IATF 16949 norm by which they provide trust in competence of their processes, product quality and provides continuous improvement. Keywords: statistical method, quality, analysis
INTRODUCTION
Competition on the market tis huge and that is why every organization must resist threats from other organizations. If we want an organization to prosper on the market, we have to provide continuous management according to primary norms of quality management systems. Priority task of an organization is to perceive the needs of a customer, whether present or future and try to meet their requirements, or even surpass their expectations [2,5]. To produce quality, it is necessary to use statistical methods which help us to evaluate defectiveness of the given product. Statistical methods are nowadays very sought-after as they are important within various researches.
MATERIALS AND METHODS
The objective of the paper is to find out the reason of error occurrence on a component of a cylinder form, used within a control lever assembly produced in Kongsberg Automotive s.r.o Vráble. Organization focuses on spraying plastic parts and consequent production of a control lever [1]. Error evaluation will be performed based on found quantity by simple statistical methods, indexes of competence CP and CPK and by Minitab program as well [6,8].
Process of spraying is automatic. Technology is adequate for small series as well as large series production and belongs to wasteless technologies. Processed plastic is molten in a melting chamber and a melt of plastic is injected by piston into closed cool form.
Procedure of spraying: melting, injection of a part, cooling, ejection of a part.
Pareto diagram
Procedure within creation of Pareto diagram: 1. Selection of severe issue 2. Selection of a time span of its occurrence to get a real image of a reality 3. Collection of data on the issue 4. Searching for possible causes of the issue by Ishikawa diagram 5. Quantification of a number of causes into a table 6. Drawing data into a bar graph: y axes - number of cases expressed by the height of a bar, x axes reasons descending from the number of cases 7. On the right side of the graph, creation of the second y axes with a cumulative relative multiplicity in % 8. Drawing the cases into a graph by cumulative curve 9. Documenting the results of the analysis and informing the interested [3,4].
Regulation diagram for average and range ( , R)
Regulation diagram will be established 100% under control of fifty individual consecutive components the same cavity.
To construct it, we need to compute average value of a symbol in a sub-group and range in a sub-group. Average value of a symbol [7] in a sub-group is computed according to an equation:
= (1)
where: i – serial number of a sub-group = 1, 2, ... k j – serial number of a measured value in a sub-group = 1, 2, ... n k – number of sub-groups n – range of a sub-group – measured value in an i sub-group Range of a sub-group is computed according to an equation: = MAX ( ) – MIN ( ) (2) where: MAX ( ) and MIN ( ) are maximum and minimum measured value in an i subgroup.
It is important to compute average range and an average of process , as they create central straight lines (Control Line) – CL. In the graph they are displayed as full horizontal lines.
where: and are ranges and averages in an i sub-group.
Computing upper and lower regulation line for an average: = + .
= Computing upper and lower regulation line for a range: =
= . where: A2, D3 and D4 are constants changing in relation to a range of sub-groups.
Standard deviation „sigma“ is computed according to equation:
where: is average range in sub-groups d2 is a constant changing in relation to range of a sub-group
Indexes of competence of a process and are given by relation:
where: – index of competence of a process – corrected index of competence of a process T – difference between lower and upper tolerance line (3) (4)
(5) (6)
(7) (8)
(9)
(10)
(11)
(12)
– upper regulation line – lower regulation line – standard deviation „sigma“
Minimum requirements on ≥ 1,33 and ≥ 1,33.
RESULTS AND DISCUSSION
Nowadays processing of plastic is very popular in all the branches of engineering industry. The most used way of processing is spraying, using adequate granulate from which we prepare a melt. This one is transported into a shape cavity of a spraying form. After cooling of a molding a component falls out thanks to a bouncer on a form onto a belt. After controlling of quality, a selected worker continues in the next process [4].
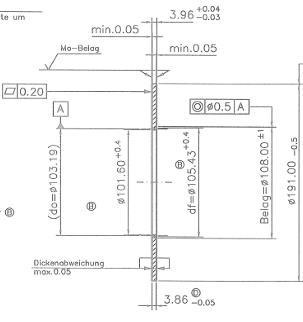
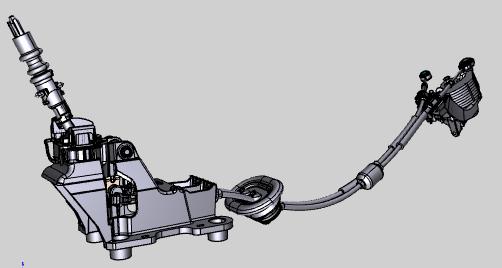
A component (Fig. 1) is a part of a control lever and serves for a reverse gear. In the Fig. 2 a visualisation of a component is displayed.
Fig. 1 A component 1000 601 797
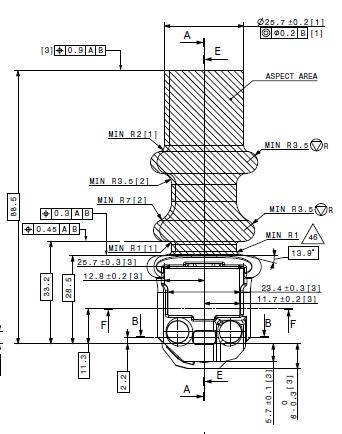
Fig. 2 Visualisation of a component 1000 601 797
Evaluation of Pareto diagram
Table 1. Dependences of activities on mismatches
Reason
Silver lines, spots
231 231 70 70
Cracks 43 274 13 83
Scratches 21 295 6 90
Technological waste 16 311 5 94 Unfinished mold 10 321 3 97
Faulty material 5 326 2 99
Burn 2 328 1 100
Based on table 1 we created Pareto diagram (Fig. 3), according to percentage evaluation. Pareto analysis is an effective way of a detection of the most severe mismatches, which need to be monitored, it helps to decrease faults of a component and find the reason of a fault creation. The most common errors are silver lines and spots and we will solve this issue by the method of brainstorming.
In the Fig. 4 a component is displayed with the most common error, i.e. silver spot.
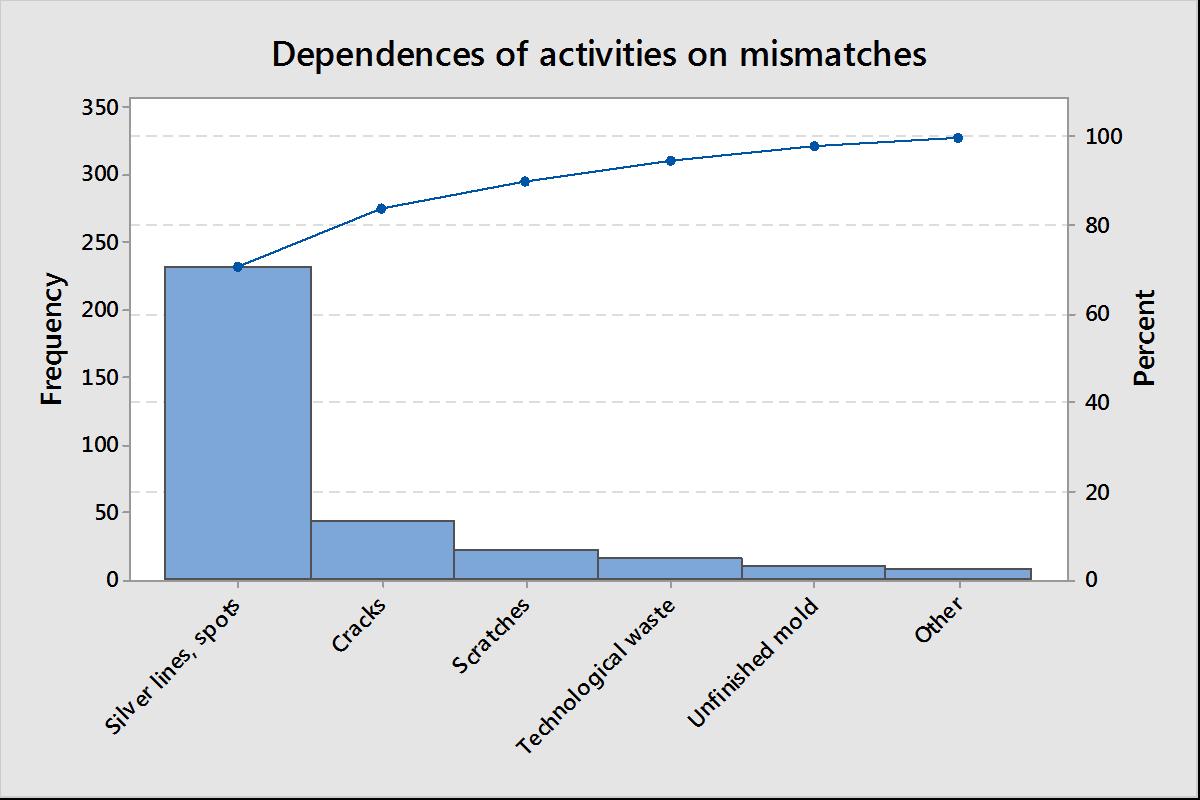
Fig. 3 Pareto diagram
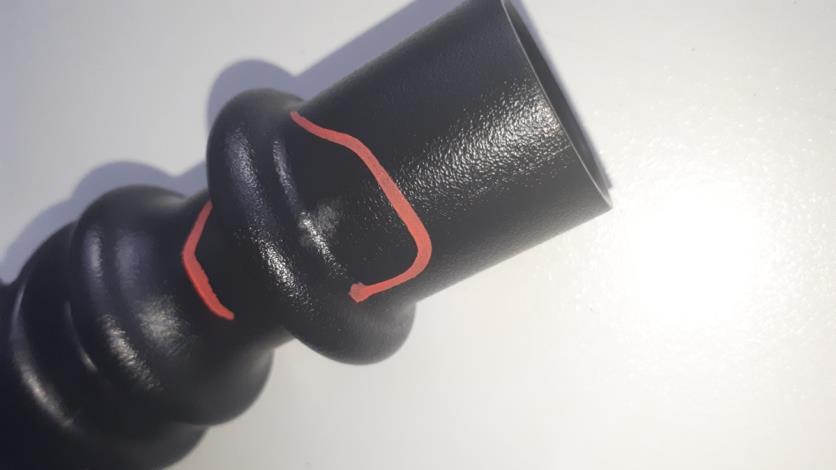
Fig. 4 Display of silver spot
We performed measurements of 50 pieces of cavity number one, the measured values were recorded in the table 2.
Table 2. Measured values; mm
Cavity 1 Measures Values Measures Values
1 25.72 26 25.71 2 25.72 27 25.71 3 25.64 28 25.65 4 25.63 29 25.65 5 25.6 30 25.64 6 25.64 31 25.72 7 25.71 32 25.77 8 25.57 33 25.72 9 25.56 34 25.71 10 25.55 35 25.66 11 25.68 36 25.63 12 25.76 37 25.69 13 25.73 38 25.71 14 25.69 39 25.65 15 25.77 40 25.67 16 25.71 41 25.6 17 25.68 42 25.72 18 25.7 43 25.64 19 25.7 44 25.68 20 25.64 45 25.66 21 25.71 46 25.67 22 25.73 47 25.63 23 25.7 48 25.66 24 25.72 49 25.59 25 25.72 50 25.69
To construct regulation diagrams it is important to compute average value = 25,6762 mm and average range = 0,0439, as they form central lines in the graph. To create a graph, it is necessary to compute upper and lower regulation lines according to the determined equations. = 25,7929 and = 25,5595. For a range there are regulation lines = 0,1434 and = 0.
After computing all the values necessary for creation of a graph, we create a regulation diagram in a Minitab programme for average, in the figure 5 and for a range (Fig. 6).
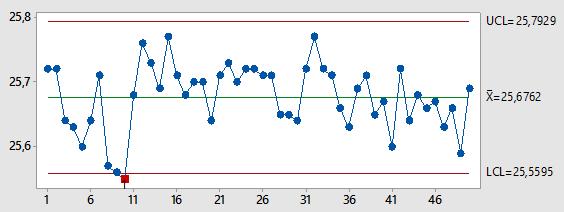
Fig. 5 Regulation diagram for an average
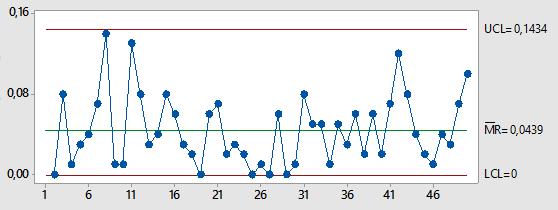
Fig. 6 Regulation diagram for a range
To find a competence of a process it is necessary to compute index of a process competence a . = 2,57 and = 2,37. As the indexes are ≥ 1,33, we may state that a process is competent, thus, it is under a statistic control [4].
CONCLUSION
Nowadays, every organization should realize, how important it is to produce quality components and provide quality service, as competition on the market is huge.
The objective of the paper was to evaluate fault on a plastic component of a cylinder form, serving for a reverse gear, especially because of common visual errors. As a visual control and measurement of a component are needed often, we suggested and produced a calibre for measuring this hole, which is timely effective.
ACKNOWLEDGEMENT
This paper was created with financial support of the grant project Vega no. 1/0718/17 " Study about the effect of technological parameters of the surface coating in agricultural and forestry techniques for qualitative parameters, safety and environmental acceptability."
REFERENCE
[1] Bujna, M., Prístavka, M., Polák, P., Žitňanský, J., Prístavková, M., (2017). Application of fault tree analysis at selected process. In: Bezpečnosť, Kvalita, Spoľahlivosť. Košice. 2017. pp. 37-42 ISBN: 978-80-553-3115-7. [2] Bujna, M., Prístavka, M., Žitňanský, J., Polák, P., (2016). Safety assessment of selected systems. In: Quality, technologies, diagnostics of technical systems. 1st ed., Nitra:
Slovenská poľnohospodárska univerzita, 2016, pp. 21-26. ISBN 978-80-552-1506-8. [3] Hrubec, J. (2018). Inžinierstvo kvality produkcie. 1. Vyd. Nitra: ES SPU.2018, 174s
ISBN 978-80-552-1793-2. [4] Chudivániová, Z., (2019). Využitie štatistických metód v riadení kvality. [bakalárska práca], Nitra, 2019. [5] Kangalov, P., (2012). Failure theories and fault detection. Ruse: Angel Kanchev
University of Ruse, 2012. ISBN 978-619-90013-5-6. [6] Kangalov, P., (2013). Methods and diagnostic tools. Ruse: Angel Kanchev University of
Ruse, 2013. ISBN 978-619-90013-3-2. [7] Prístavka, M., Beloev, H., Kročko, V., (2014). Quality Control in Production Processes. : scientific monograph. 1. vyd. Ruse : Angel Kanchev University of Ruse, 2014. ISBN 978-619-7071-62-7. [8] Prístavka, M., Beloev, H., (2015). Engineering of Products Quality. 1. vyd., Ruse: Angel
Kanchev University of Ruse, 2015. 186 s . ISBN 978-954-712-655-8.
CONTACTS
Miroslav Prístavka, Department of Quality and Engineering technologies, Faculty of Engineering, Slovak University of Agriculture in Nitra, Slovakia, Tr. A. Hlinku 2, 949 76 Nitra, Slovakia, miroslav.pristavka@uniag.sk
Veronika Hrdá, Department of Management, Faculty of Economics and Management, Slovak University of Agriculture in Nitra, Slovakia, Tr. A. Hlinku 2, 949 76 Nitra, Slovakia, veronika.hrda@uniag.sk
Hristo Beloev, Department of Agricultural Machinery, Agrarian and Industrial Faculty, University of Ruse, 8, Studentska Str., 7017 Ruse, Bulgaria, e-mail: hbeloev@uni-ruse.bg
Pavol Findura, Department of Machines and Production Biosystems, Faculty of Engineering, Slovak University of Agriculture in Nitra, Slovakia, Tr. A. Hlinku 2, 949 76 Nitra, Slovakia, pavol.findura@uniag.sk