


BY ERIN ESKEW HERALD CORRESPONDENT
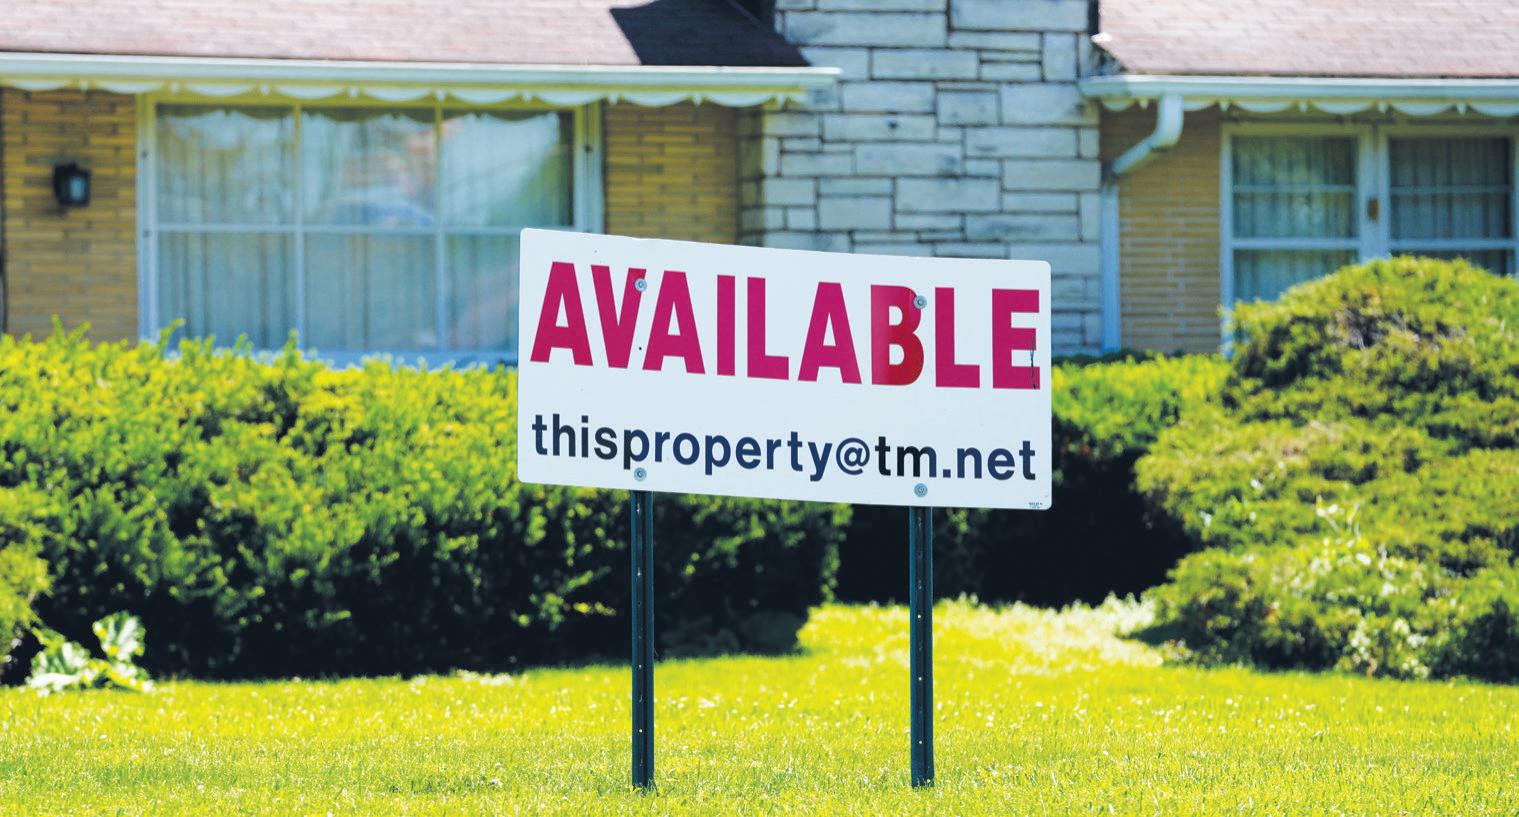
As the nation faces a housing shortage — which researchers trace to COVID-19 shortages — the local housing market is beginning to boom.
The current national housing shortage is estimated to be between 4 million and 7 million homes, according to research by Construction Coverage, a website that compares construction software and insurance.
“In the 10 years following the Great Recession, the United States constructed fewer new homes than in any other decade since the 1960s,” according to the study. “Simply put, the nation has not built a sufficient number of homes to meet demand — though this lack of housing affects certain areas more severely than others.”
Bell County had 4.6 months of inventory in May, which is double what was reported to the Fort Hood Area Association of Realtors for the same time in 2023. This translates to a 2.6-month increase in the Harker Heights inventory to 3.9 months, and a 2.2-month increase in Killeen for a total of 3.5 months of inventory, the association data shows.
Construction Coverage noted the average housing inventory for Killeen for the first quarter of 2023 at 2 months even, but reported an increase to an av-
erage of 3.9 months for the first quarter of 2024. The increase in inventory is the 5th largest among all mid-size cities across the country, and the eighth largest increase across all cities regardless of
metro size, the study concluded. Even with a decrease in inventory of just more than half a month’s inventory, Nolanville reports one of the highest inventories in the area with 5.3 months of housing inventory.
Texas inventory has increased by 1.5 months, making the average inventory across the state just under that of Bell County at 4.3 months, according to the Fort Hood Area Association of Realtors. Louisiana, Mississippi, South Carolina, South Dakota, Tennessee, and Texas each have more than four months of inventory, but less than 4.5 months. These six lag behind only Florida and Montana, which each have more than five months of inventory.
Using similar metrics as are used to calculate the monthly inventory of the housing market, Construction Coverage researchers ranked locations based on the percentage change in the average monthly housing inventory — or how long it would take existing inventory to sell out if no new homes enter the market — between the first quarter of last year and the first quarter of this year. Their data showed the national average plummet from a high of 7.5 months in 2012 down to 1.1 month in 2022. Inventory has been on the rise lately, but with just a tenth of a month increase from last year, the national average is now 2.9 months.
For more information about the Construction Coverage story, go to: https:// constructioncoverage.com/research/ cities-with-the-biggest-increase-in-housing-inventory


BY ERIN ESKEW HERALD CORRESPONDENT
The housing market in the Bell County area echoes trends across Texas, according to data provided by the Fort Hood Area Association of Realtors. Bell County reported an increase of 1.9% in median price of homes in May, compared to May of last year, with the median listing price of $281,193. This is a full percentage point more than the increase reported across the state, the data shows.
The 463 closed sales in May of this year reflect a 21% decrease in sales from the previous year, which contributed to the reported 2.3% decrease in closed sales across the state, according to the FHAAR.
Meanwhile, active listings have skyrocketed by 73.1% — almost double the reported increase in active listings across the state of 45.4%. The 1,897 listings in Harker Heights reflect 4.6 months’ worth of inventory, which is 2.3% higher than May of 2023, and almost directly mirroring the 1.5% increase in statewide inventory to 4.3 months.
Homes in Bell County are staying on the market about 20 days longer than they did in 2023 for an average of 72 days, research by the FHAAR shows.
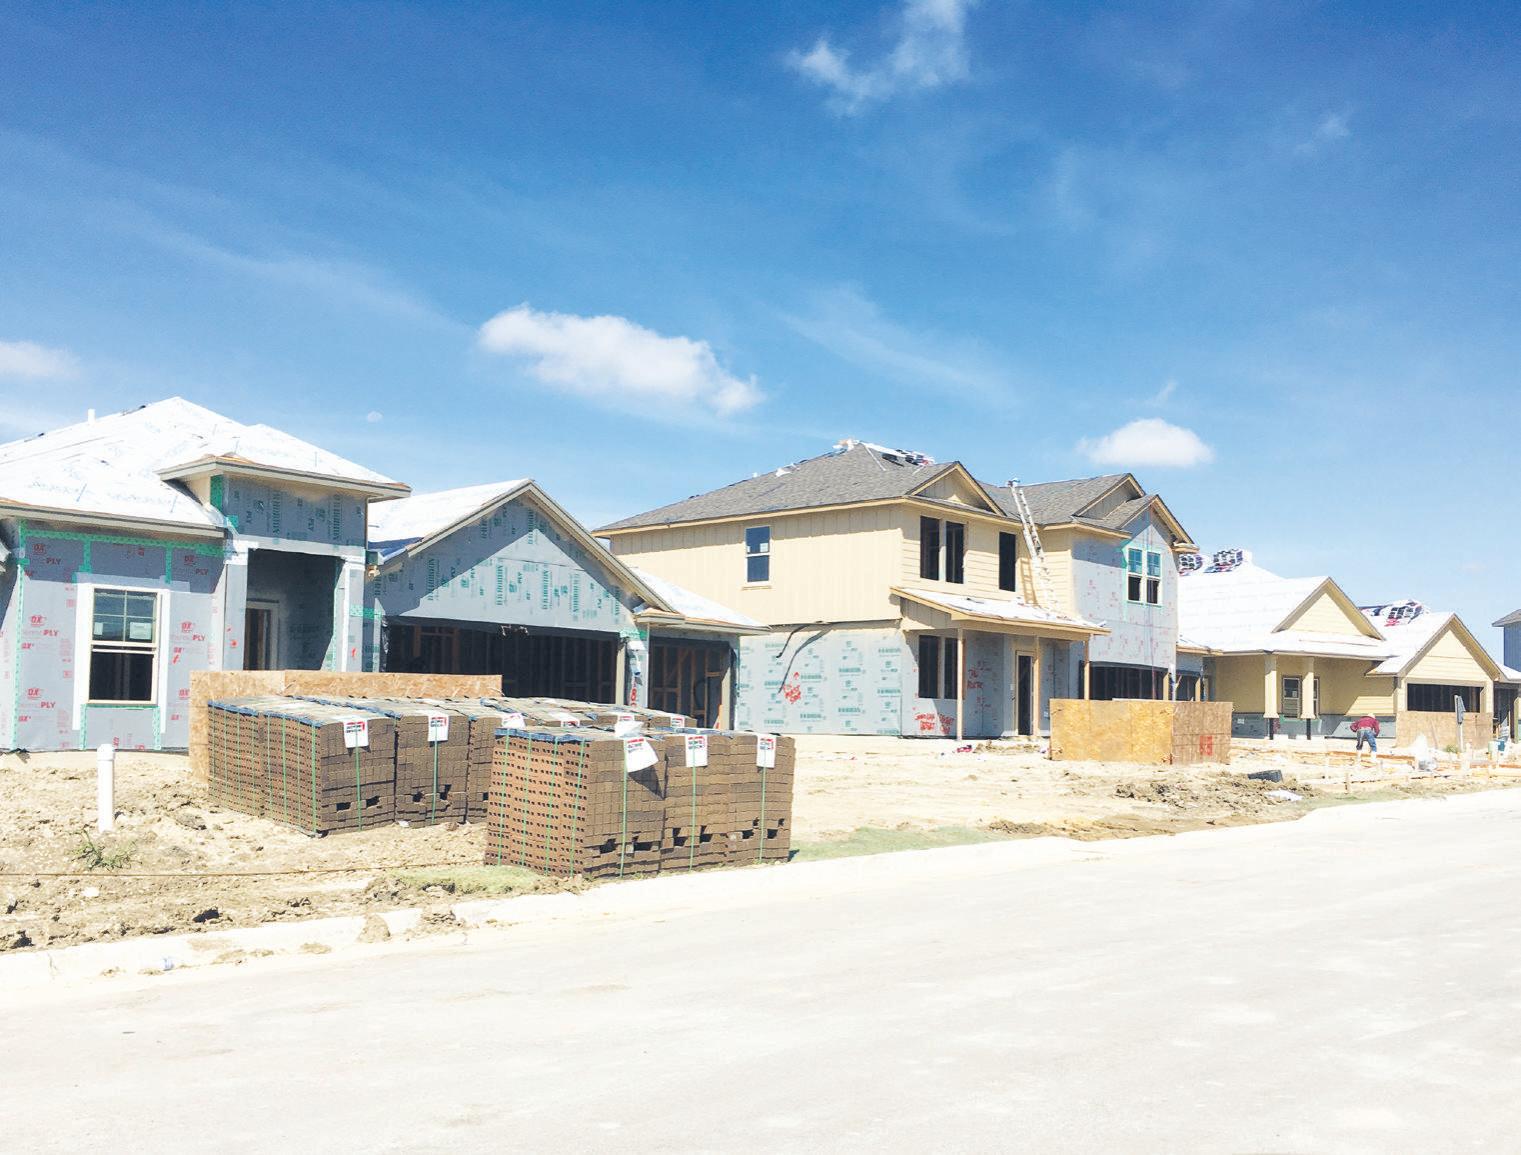
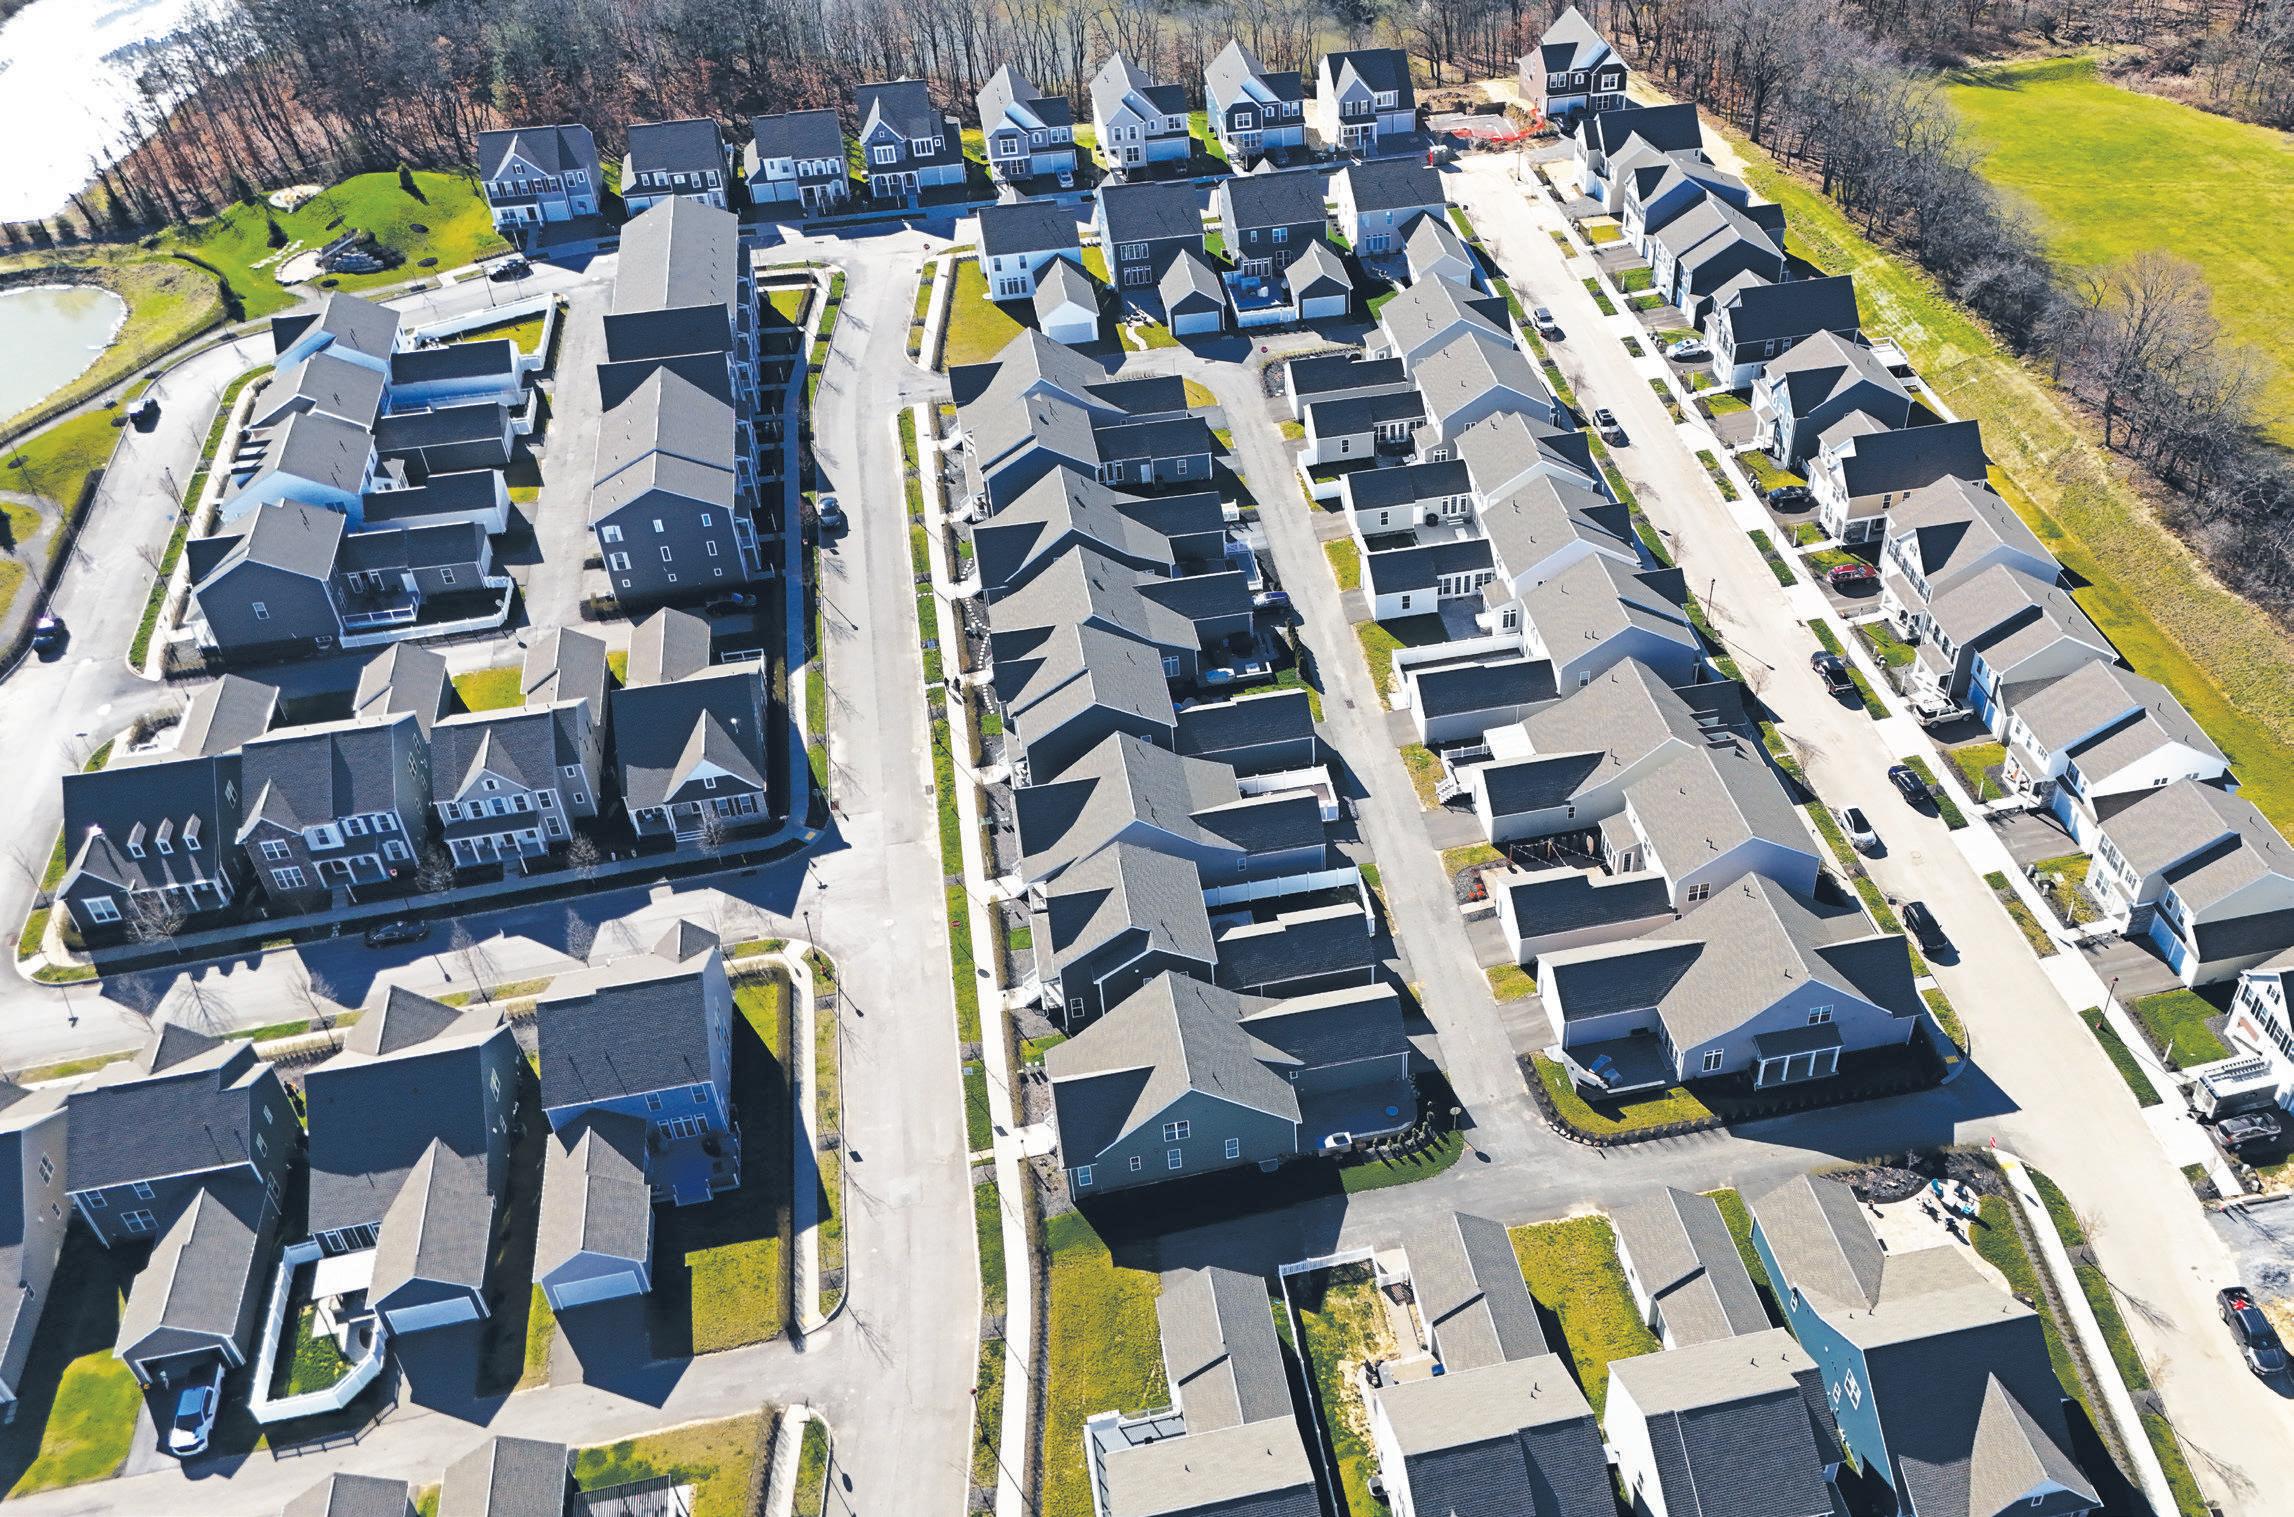
DAVE MILLER | HERALD
Homes in Harker Heights are staying on the market for about 23 days longer than in May of 2023. After about 59 days on the market, closing has decreased from 29 to 28 days in the city, the data shows.
The median price per square foot of $156.38 represents a 2.8% increase over last year.
Nolanville has seen a 9.1% increase in the price of homes with a median sale price of $300,900, according to data from the FHAAR.
NOLANVILLE
Contrary to other municipalities across the county, Nolanville has seen a 275% increase in closed sales with 15 homes selling in May. Nolanville also has an increase in active listings of about 82%. The 62 active listings represent 5.3 months of inventory, which is a decrease of less than one percent over last year.
Once they sell, it takes about 31 days to complete closing. State numbers for days on the market have not wavered from last May.
The median price of homes in Bell County is at $160.20 per square foot, which is up 2.9% from 2023. Homes across the state have increased by a full percentage piont in median price to $178.88, according to the FHAAR.


The median listing price for Harker Heights homes has decreased by 7.4% to $311,000. The number of closed sales has dipped by almost 47%, with only 32 homes closing in the month of May, according to the FHAAR.
The number of active listings in Harker Heights has climbed by 85% over May 2023 to 111, representing 3.9 months of inventory — a 2.6% increase.
Homes in Nolanville stay on the market for about 90 days, which is almost double the length of time they stayed on the market in May of last year. Sales have taken 32 days to close, which is 9 days more than reported in 2023. The median price per square foot reported to the FHAAR for Nolanville has increased by 15.9% to about $170.88 per square foot.


SPECIAL TO THE HERALD
When it comes to home renovations, trust and reliability are paramount. That’s why Re-Bath Temple, located in Temple, stands out as a beacon of quality and dedication. Owned and operated by veterans, Re-Bath Temple brings the values of discipline, integrity, and commitment to every project they undertake. Whether you’re looking for safetyand accessibility updates or a complete bathroom overhaul, Re-Bath is there for you every step of the way—from design to demo to done.
A LEGACY OF SERVICE AND COMMITMENT
At Re-Bath Temple, we understand the importance of service. Our team, composed of dedicated veterans, carries the ethos of their military service into their work. This means you can expect the highest standards of professionalism, punctuality, and respect. We know that your home is your sanctuary, and we treat every project with the care and attention to detail that it deserves.
COMPREHENSIVE REMODELING SOLUTIONS
Our approach to bathroom remodeling is holistic and customer-centric. We offer a full range of services, ensuring that you have a seamless and stress-free experience from start to finish. Here’s how we guide you through the remodeling journey:
1. DESIGN: CRAFTING YOUR DREAM BATHROOM
The journey begins with our expert design team. We take the time to understand your vision, preferences, and needs. Our designers will work closely with you to create a bathroom that is not only functional but also aesthetically pleasing.
2. DEMO: PREPARING FOR PERFECTION
We ensure that the existing bathroom is carefully and efficiently removed, minimizing disruption to your daily life. Our team handles all aspects of the demolition process, including debris
removal and site preparation, setting the stage for the installation phase.
3. DONE: BRINGING YOUR VISION TO LIFE
With the old bathroom removed, our installation experts get to work. Using high-quality materials and meticulous craftsmanship, we transform your space according to the approved design. Our team coordinates every detail, from the shower surround and fixtures to the flooring and cabinetry. The result is a beautiful, durable bathroom that you’ll enjoy for years to come.
WHY CHOOSE RE-BATH?
End-to-End Service: We manage every aspect of the remodel, so you don’t have to worry about coordinating multiple contractors or schedules. We are your single point of contact throughout the project.
Customer Satisfaction: Your satisfaction is our top priority. We pride ourselves on delivering exceptional results that exceed your expectations. Our numerous satisfied customers can attest to the quality and reliability of our services.
Quality Materials and Workmanship: We use only the best materials and employ highly skilled professionals to ensure that your new bathroom is not only beautiful but also built to last.
At Re-Bath, your bathroom is important to us–long after we’ve completed your project. Each Re-Bath job comes with a one-year warranty on workmanship and installation, as well as warranties on the products Re-Bath manufactures and installs.
CONTACT INFO:
Ready to transform your bathroom with the help of Re-Bath? Contact us today to schedule a free in-home design consultation and take the first step towards your dream bathroom. Re-Bath Temple can be reached at 254-781-0518 or through the company’s website at rebath.com.
BY ERIN ESKEW HERALD CORRESPONDENT
The housing market in Central Texas is generally consistent with trends across the state, with slight fluctuations between the data reported to the Fort Hood Area Association of Realtors in Coryell County as compared to Copperas Cove city limits.
Coryell County reported a decrease of 2.6% in median price of homes over May of last year, with the median listing price of $251,190, while prices in the city limits of Copperas Cove have seen a 2.1% increase in median price to $245k, according to the FHAAR. The increase within the city limits echoes the almost full% increase reported across the state for a median price of $348k.
The 80 closed sales across Coryell County in May 2024 reflect a decrease of just more than 10% from the previous year, which contributed to the reported 2.3% decrease in closed sales across the state, according to data from the FHAAR. In contrast, within the city limits, 55 sales closed for an increase of 3.8%. Active listings in the central Texas area have surpassed the state average, the FHAAR data shows. Active listings are up by 61.1% in Coryell County, compared to the 45.5% increase in listings across the state. Copperas Cove reported
a 110% increase, for a total of 147 active listings in May.
The 298 active listings in Coryell County reflect 4 months’ worth of inventory which is 1.9% higher than May of 2023, and almost exactly mirroring the 1.5% increase in statewide inventory to 4.3 months, according to the FHAAR. Copperas Cove reported an increase of 2.1% in inventory for a total of 3.3 months.
Homes in both Copperas Cove and across Coryell County are staying on the market about 5 days longer than they did in 2023 for an average of 75 days in the county and 67 days in the city, the FHAAR data shows.
Once they sell, it takes about 34 days to complete closing in the county — which is almost a week longer than the same time last year. Closings for homes in Copperas Cove take an average of 35 days, which is 10 days more than the same time last year. State numbers for days on the market have not wavered since last May, the FHAAR reports.
The median price of homes in Coryell County is at $147.11 per square foot, which is down almost half a percent from 2023. Meanwhile, the median price of homes in the city has increased by 6% to $143.28 per square foot, the FHAAR reports. Homes across the state have increased by a full percent in median price to $178.88.

BY ALEX VEIGA AP BUSINESS WRITER
LOS ANGELES — The nation’s housing slump deepened in June as sales of previously occupied homes slowed to their slowest pace since December, hampered by elevated mortgage rates and record-high prices.
Sales of previously occupied U.S. homes fell 5.4% last month from May to a seasonally adjusted annual rate of 3.89 million, the fourth consecutive month of declines, the National Association of Realtors said Tuesday.
Existing home sales were also down 5.4% compared with June of last year. The latest sales came in below the 3.99 million annual pace economists were expecting, according to FactSet.
Despite the pullback in sales, home prices climbed compared with a year earlier for the 12th month in a row. The national median sales price rose 4.1% from a year earlier to $426,900, an all-time high with records going back to 1999.
Home prices rose even as sales slowed and the supply of properties on the market climbed to its highest level since May 2020.
“Right now we’re seeing increased inventory, but we’re not seeing increased sales yet,” said Lawrence
Yun, the NAR’s chief economist.
All told, there were about 1.32 million unsold homes at the end of last month, an increase of 3.1% from May and up 23% from June last year, NAR said.
That translates to a 4.1-month supply at the current sales pace. Traditionally, a 4- to 5-month supply is considered a balanced market between buyers and sellers.
While still below pre-pandemic levels, the recent increase in homes for sale suggests that, despite record-high home prices, the housing market may be tipping in favor of homebuyers.
“The latest data is implying that maybe we’re seeing a slow shift away from what had been a sellers’ market and slowly moving into a buyers’ market,” Yun said. For now, sellers are still benefiting from a tight housing market inventory.
Homebuyers snapped up homes last month typically within just 22 days after the properties hit the market. That’s up from 18 days in June last year. And 29% of those properties sold for more than their original list price, which typically means sellers received offers from multiple home shoppers.
The U.S. housing market has been


mired in a slump dating back to 2022, when mortgage rates began to climb from pandemic-era lows. Existing home sales sank to a nearly 30-year low last year as the average rate on a 30-year mortgage surged to a 23-year high of 7.79%, according to mortgage buyer Freddie Mac.
The average rate has mostly hovered around 7% this year — more than double what it was just three years ago —- as stronger-than-expected reports on the economy and inflation have forced the Federal Reserve to keep its short-term rate at the highest level in more than 20 years.
One reason home sales have kept declining this year even as the inventory of properties on the market has increased is that many Americans may be holding out for mortgage rates to come down.
Mortgage rates are influenced by several factors, including how the bond market reacts to the central bank’s interest rate policy decisions. That can move the trajectory of the 10-year Treasury yield, which lenders use as a guide to pricing home loans.
Recent signs of cooling inflation have raised expectations that the Federal Reserve will cut its benchmark rate in September. If bond yields decline in anticipation of a Fed rate cut,
that could lead mortgage rates to ease.
Most economists expect the average rate on a 30-year home loan to remain above 6% this year.
“Maybe people are waiting for interest rates to be lower before getting back into the market,” Yun said.
Lower mortgage rates could also help spur more homeowners to sell. Many who bought or refinanced a home more than three years ago are reluctant to sell now because they don’t want to give up their fixed-rate mortgages below 3% or 4% — a trend real estate experts refer to as the “lock-in” effect.
First-time homebuyers who don’t have any home equity to put toward their down payment continue to have a tough time getting into the housing market. They accounted for 29% of all homes sold last month, which is down from 31% in May, but up from 27% in June last year. They’ve accounted for 40% of sales historically.
Homebuyers who can afford to sidestep mortgage rates and pay all cash for a home accounted for 28% of sales last month, up from 26% in June last year. And about 16% of homes sold last month were bought by individual investors or homeowners looking to buy a second home, down from 18% a year earlier, NAR said.

BY ALEX VEIGA AP BUSINESS WRITER
LOS ANGELES — Mortgage rates inched higher this week, keeping the average rate on a 30-year mortgage essentially flat and near the 7% range it’s been in most of this year.
The rate rose to 6.78% from 6.77% last week, mortgage buyer Freddie Mac said Thursday. A year ago, the rate averaged 6.81%.
Borrowing costs on 15-year fixed-rate mortgages, popular with homeowners refinancing their home loans, also edged up this week, pushing the average rate up to 6..07% from 6.05% last week. A year ago, it averaged 6.11%, Freddie Mac said.
“Mortgage rates essentially remained flat from last week but have decreased nearly half a percent from their peak earlier this year,” said Sam Khater, Freddie Mac’s chief economist. “Despite these lower rates, buyers continue to pause, as reflected in tumbling new and existing home sales data.”
After jumping to a 23-year high of 7.79% in October, the average rate on a 30-year mortgage has mostly hovered around 7% this year — more than double what it was just three years ago.
The elevated mortgage rates, which can add hundreds of dollars a month in costs for borrowers, have discouraged home shoppers, extending the nation’s housing slump into its third year. Sales of previously occupied U.S. homes fell in June for the fourth month in a row. And sales of new single-family homes fell last month to the slowest annual pace since November.
Mortgage rates are influenced by several factors, including how the bond market reacts to the central bank’s interest rate policy decisions. That can move the trajectory of the 10-year Treasury yield, which lenders use as a guide to pricing home loans.
Recent signs of cooling inflation have raised expectations that the Federal Reserve will cut its benchmark rate in September. If bond yields decline in anticipation of a Fed rate cut, that could lead mortgage rates to ease.
Still, most economists expect the average rate on a 30-year home loan to remain above 6% this year.