
Q2 2022
LOCAL REAL ESTATE GUIDE Q4 2024
HINSDALE
HINSDALE LOCAL REAL ESTATE GUIDE


Q2 2022
LOCAL REAL ESTATE GUIDE Q4 2024
HINSDALE
HINSDALE LOCAL REAL ESTATE GUIDE
CLOSED:closed transaction reflecting the final sales price (does not include any seller credits)
CONTRACTED:contingent or pending transaction reflecting the latest asking price
CONTRACT TIME:number of days between the first list date and the contracted date (does not include time from contract to close)
HOME INVENTORY:number of homes currently available for sale
MEDIAN:middle value of a given dataset (all report values are medians, which are less impacted by outliers than averages)
PRICE DISCOUNTS:percentage difference between the initial list and recorded sale price
PRICE PER SQ. FT:ratio of the median price to the median sq. footage of a closed transaction as a relative price measure
(Rte. 83 to N. York Rd. / N. Garfield St. and Ogden Ave. to W. Chicago Ave.)
(Rte. 83 to S. Garfield St. and W. Chicago Ave. to W. 55th St.)
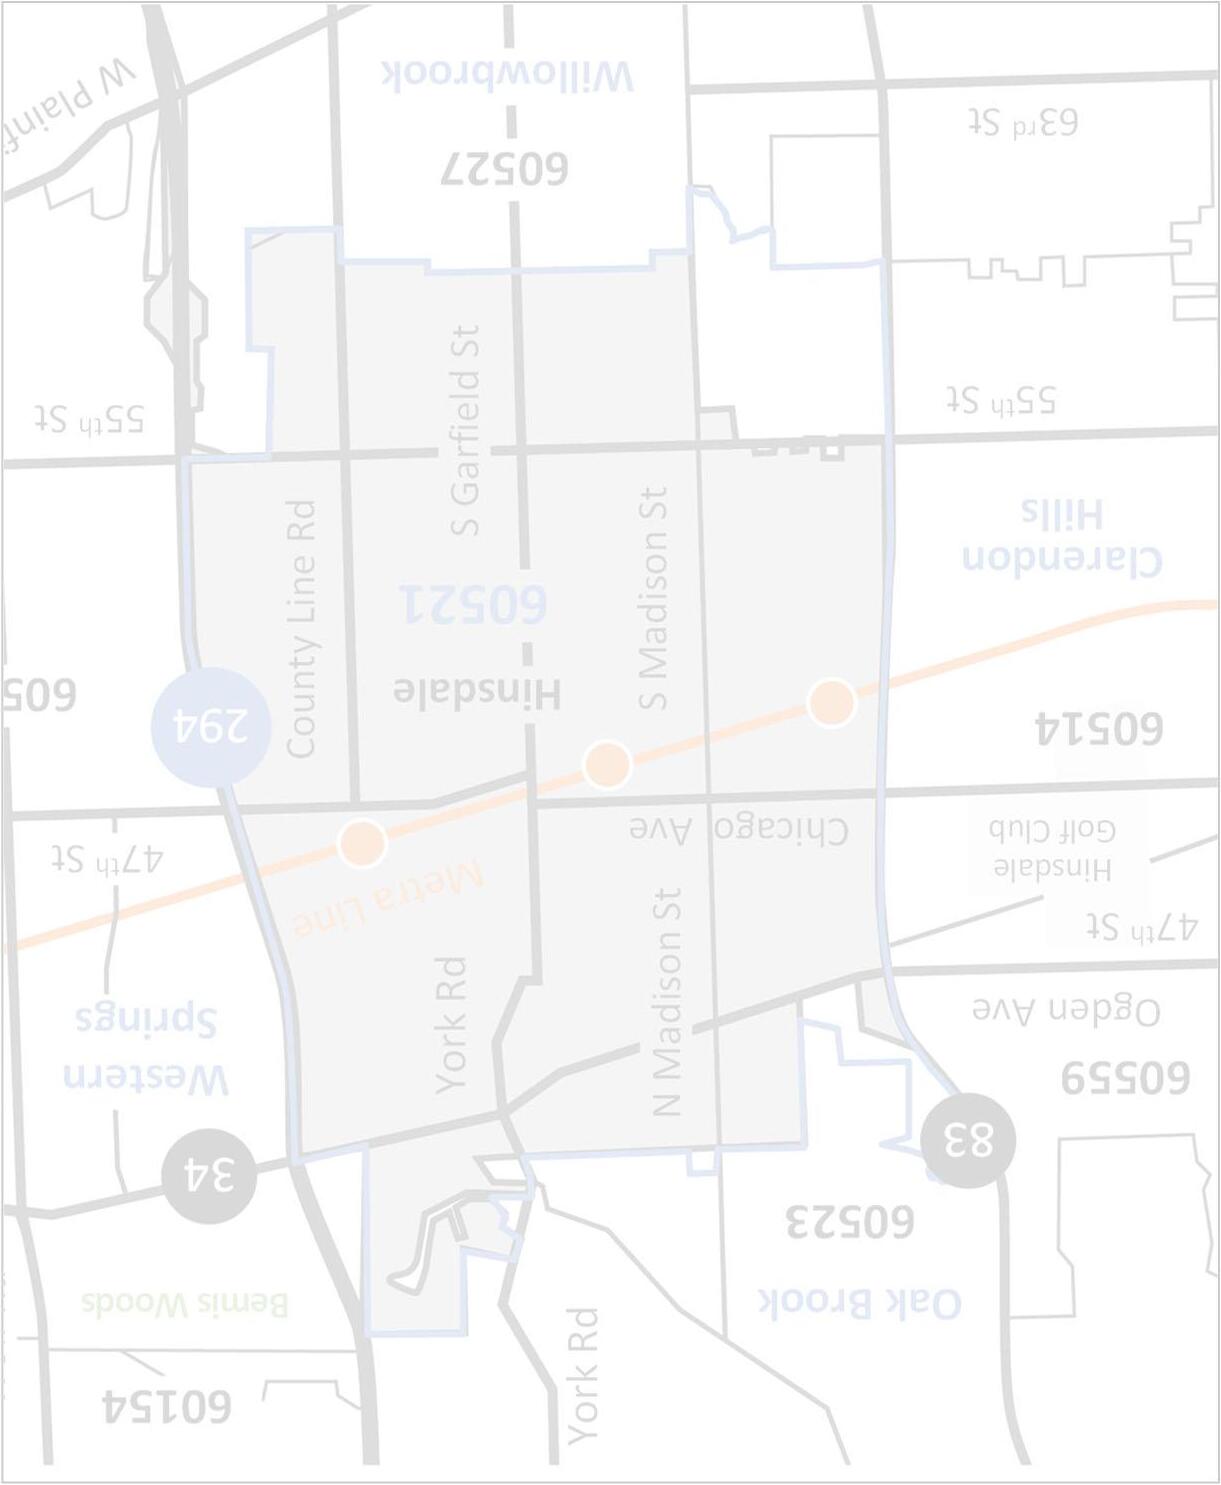
(Hwy. 294 to N. York Rd. / N. Garfield St. and Ogden Ave. to E. Chicago Ave.)
Hwy. 294 to S. Garfield St. and E. Chicago Ave. to E. 55th St.
(South of 55th St.)
“Seller’s Market” Remains with Increasing Market Activity with Less Inventory


By Price Range
Listings were up almost 5% in Q4; homes priced
$1.5M –$2M saw the largest increase (more than doubled, but still only 6 additional listings)
October and December listings were down around 15% with November increasing over 40% in between those months

Mixed finish going into year end; seasonal trends should support an increase in listings
Oct. –Dec. (YoY%)
Price Range'24'23%
<$500K 42100%
$500K - $999K 18176%
$1M - $1.49M 1012-17%
$1.5M - $1.99M 104150%
$2M - $2.99M 56-17%
$3M+ 27-71%
Hinsdale submarkets were mixed during the quarter; Central areas moved in opposite directions
Only Northeast and Central West areas are higher over the last 12 months (both had a strong Q4)
South listings are ~1/3 or less of other submarkets during the last 12 months
Northwest Northeast Central West Central East South
Contracts increased over 5% during the quarter with activity mixed (higher ranges had a few more contracts)
Only homes priced $500K –$1M showed contract declines over the last 12 months

More contracts will require additional listings given the low inventory environment
–Dec. (YoY%)
Price Range'24'23%
<$500K 20N/A
$500K - $999K 810-20%
$1M - $1.49M 811-27%
$1.5M - $1.99M 10825%
$2M - $2.99M 4333%
$3M+ 4333%
Contract activity was also mixed across submarkets in Q4 (3 up / 2 down)
Central East remains up more than 30% over the last 12 months despite a softer Q4
Central West chart-topping increases began in 2019 and continued to mid-2021 before large declines (recently bottomed)
Northwest Northeast Central West
Central East South
Closed homes increased over 20% during the quarter mostly driven by homes priced $2M+
Closings were higher each month in Q4 (November and December up 25%+); only $500K –$1M price range showed declines over the last 12 months (same as contracts)

With strong Q4 finish, closings are likely to start slow this year until seasonal uptick
Price Range'24'23% <$500K 10N/A $500K - $999K 78-13% $1M - $1.49M 12120% $1.5M - $1.99M 910-10%
$2M - $2.99M 8560%
$3M+ 71600%
Closed activity was higher across all submarkets in Q4, except Northwest
Central East had another strong quarter and is now up 55% over the last 12 months
South area is lower than other submarkets, but experienced a stronger second half of the year (back-to-back quarters)
Northwest Northeast Central West Central East South
By
Available homes declined 55% on already very low inventory
Overall home inventory across price ranges is down over 90% from December 2019

Limited inventory expected to continue driving “seller’s market” conditions
Home inventory is down substantially across Hinsdale submarkets
All areas had a half dozen or fewer homes available at year end
Low inventory expected to persist over the coming months, but seasonal trends should create more availability
Northwest Northeast Central West Central East South
Northwest Northeast Central West
Central East South
Days between listing date and contract signing varied by price range, but overall time was faster (especially above $1M)
Homes priced $500K –$1M took a little longer in Q4, but all price ranges are down over the last 12 months

Expect contract times to remain short with very limited home availability
Price Range'24'23%
<$500K 7N/AN/A $500K - $999K 281947% $1M - $1.49M 933-73% $1.5M - $1.99M 1163-83% $2M - $2.99M 1130-63%
$3M+ 1036-72%
Contract times were mostly shorter in Q4, except Northeast saw a sharp increase (only 7 contracts during the quarter)
Central West was under 5 days for the quarter and over the last 12 months
Most areas have shorter contract times over the last 12 months (Northeast now flat)
Northwest Northeast Central West Central East South
By
Closed price discounts narrowed slightly overall in Q4 (despite some variability)
Homes priced $500K –$2M showed less negotiability during the quarter; only homes priced $1M –$1.5M sold at full price over the last 12 months

Price discounts expected to remain narrow due to limited home availability
Price Range'24'23%
<$500K 97%N/AN/A
$500K - $999K 100%95%4%
$1M - $1.49M 97%96%2%
$1.5M - $1.99M 97%95%2%
$2M - $2.99M 98%100%-2%
$3M+ 96%100%-4%
Price discounts narrowed during the quarter in most areas, except South
Central East normalizing some in Q4 from a soft last year (only 5 closings then); discounts in this area are more consistent with others over the last 12 months
Transactions mostly closing with a small discount (but some cases full asking price)
Oct. –Dec. (YoY%)
Northeast Central West Central East South
Relative prices increased overall (driven by homes priced under $1M and mix) during the quarter with meaningful variability
Price ranges above $1M all showed lower price per sq. ft. in Q4; increase in closings provided more data points (especially $2M+)

Relative pricing has been supported by limited home inventory and buyer demand
Oct. –Dec. (YoY%)
Price Range'24'23% <$500K $438N/AN/A
- $999K $294$2863%
- $1.49M $286$305-6% $1.5M - $1.99M $351$373-6% $2M - $2.99M $400$419-5% $3M+ $477$568-16%
Hinsdale areas experienced mixed relative price trends in Q4 (3 higher / 2 lower)
Central submarkets showed a strong quarter and are up the most during the last 12 months (including both $350+ per sq. ft.)
South area normalizing some over the last 12 months with more closings
East South
Overall sale prices were up over 10% across Hinsdale submarkets; Central East growth in particular offset other declines
Central East was up dramatically in Q4 (but only 7 closings) and over the last 12 months (now at levels not seen in almost 15 years)

Closed sale prices should be reviewed with price per sq. ft. to gauge overall trends
Last 12 Months (YoY%)
Northwest Northeast Central West Central East South
By
Overall closed sale volume for single-family homes increased 50%+ in Q4 and is now up nearly 40% over the last 12 months
Central East was up tremendously for the quarter and last 12 months; South also jumped in both timeframes

Central East distancing from all other areas after a significant recovery
Oct. –Dec. (YoY%)
Northwest Northeast Central West Central East South
Analyzing Hinsdale Home Types for Q4 2024


Home TypeSingle-Family HousesTown HousesCondos

from
off-market sales, all property types, from 1/1/ 24-12/31/24.


