Audit of Carbon Emissions and Action Plan
For Kingston Grammar School

Registered company number: 3883748
Registered charity number: 1078461

SIC: 85310
For the period 1st August 2021 to 31st July 2022
1
Project Sponsor:
Alison Williams
Go Green Experts supports organisations in the measurement and reduction of their carbon footprint. We have a wealth of experience supporting companies and non-profits in their drive to reach a lower environmental impact. We ensure that our work is in line with the latest science and standards.


Kingston Grammar School is an independent coeducational day school in Kingston upon Thames, England. The school was founded by royal charter in 1561 but can trace its roots back to at least the 13th century.


The buildings include the Lovekyn Chapel which is the only remaining free-standing chantry chapel in England and, dating back to 1309, is the oldest complete building in Kingston. Although it is no longer used for religious services, it's the most popular venue in the Royal Borough for civil ceremonies and civil partnerships. As an elegant and bright space with excellent acoustics, it is also frequently used for musical performances and readings
Co-Authors (Go Green Experts Ltd)
Dominic Lavelle – Managing Director
Richard Bromley – Consultant
2


3 Contents Foreword ..............................................................................................................................................4 1. Executive Summary 5 2. Context..........................................................................................................................................6 3. Carbon Footprint Calculations: Summary 7 4. Footprint Baseline & Scope ......................................................................................................7 4.1 Data Quality and Assumptions 9 4.2 CO2e Emissions - Total Carbon Footprint .......................................................................10 4.3 Carbon Intensity 11 4.4 CO2e Emissions – Breakdown of Business Travel .......................................................12 4.5 CO2e Emissions – Breakdown of Purchases 13 4.6 CO2e Emissions – Scopes 1, 2 & 3 .....................................................................................14 5. Decarbonising the Energy in the School. 16 6 Carbon Reduction Plan – Detailed Plan 18 6.1 Carbon footprint and EMS ongoing management, review, and target setting......18 6.2 Financial and Commercial 19 6.3 Facilities and school buildings .........................................................................................19 6.4 Procurement 21 6.5 Catering ..................................................................................................................................21 6.6 Travel 21 6.7 Sports Ground & Rowing Club ...........................................................................................23 6.8 Reduction action examples- pictures from the site visit 24 Appendix A - Calculation Methodology......................................................................................27 Appendix B - Documents and References Used in Calculation. 28 Appendix C - Example supplier questionnaire .........................................................................29 Appendix D - Glossary. 30
Foreword
Kingston Grammar School approached Go Green Experts in order to establish a baseline carbon footprint and develop an action plan going forward.


The carbon footprint report and action plan will form the basis for strategic environmental planning in the future.
The aim of this review and report is to establish a baseline and identify any gaps in the existing data in order to improve over time.
In order to obtain a more complete picture of the key areas to consider in a reduction plan, any gaps identified have been filled in using estimates based on similar organisations, published figures, and the experience of the carbon consultants using insight based on the site visit.
At the present time, the school does not wish to embark on a Net Zero program, however, this can be reviewed following consideration of the results of this report.
Where primary data was not available, secondary data sources including reports published with Companies House and the Charities Commission were used. An explanation of the data quality and how it is applied can be found later in this report.
An on-site environmental review was conducted by Go Green Experts in September 2022 in order to ascertain the school infrastructure, determine any saving opportunities and define the data required.
4
1. Executive Summary
Kingston Grammar School is committed to reviewing the environmental impact of the school by measuring our carbon footprint and implementing a decarbonising action plan.

The first step for Kingston Grammar School in creating our decarbonisation plan and strategy has been to measure our carbon footprint. Go Green Experts have begun the carbon footprint measurement process of Kingston Grammar School. During the datagathering process, it was clear that the key area for improvement was the availability of data This is a common issue and can be refined over time.
Carbon emissions including direct and selected indirect emissions, i.e., Scope 1, Scope 2 and selected Scope 3 emissions have been calculated.
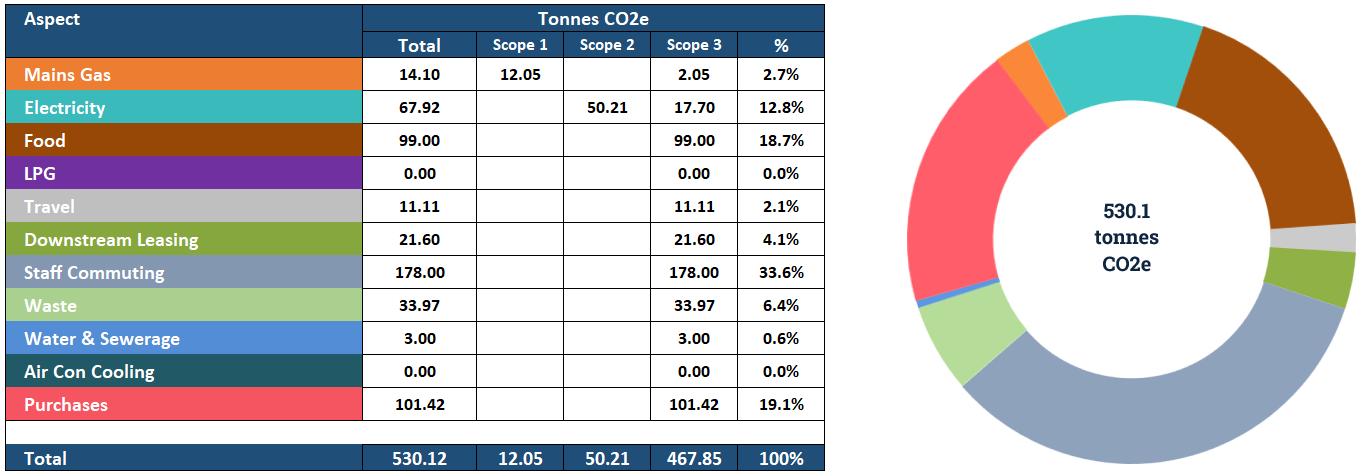
The completed carbon footprint, alongside improved data collection and carbon reduction measures implemented as a result of this review, will form a strong foundation for implementing a Net Zero plan in the future if required.
This report was undertaken for the 1st August 2021 to 31st July 2022 period

5
Kingston Grammar School Total CO2e Emissions
Figure 1.1: Kingston Grammar School’s CO2e carbon footprint: 1st August 2021 to 31st July 2022
2. Context
Based on an analysis of the existing carbon footprint, the school can develop a longerterm strategy to improve data collection and reduce emissions.
In the coming years, the school will consider developing a carbon reduction plan in line with the Science-Based Target Initiative (SBTi) guidance, enabling Kingston Grammar School to become a Net Zero organisation over time
To achieve this, Kingston Grammar School will need to set out a number of activities to undertake in its carbon reduction plan, split into short-term, medium-term and longterm activities:

Go Green Experts Ltd have reviewed the following data sets submitted by Kingston Grammar School, which include:

• Energy consumption (Gas and Electricity)
• Water & sewerage.
• Air Travel Data
• Site walk round and review
Estimates have been made for the following items:
• Waste data.
• Significant purchases of goods and services.
• Staff commuting
The data was used to calculate the carbon footprint of Kingston Grammar School including Scope 1, Scope 2, and significant Scope 3 emissions, as referred to in the WBCSD-WRI Greenhouse Gas Protocol emissions in carbon dioxide equivalent.
Scopes 1 and 2 are calculated using the conversion factors listed in the 2020 BEIS Greenhouse Gas Conversion Factors.
6
3. Carbon Footprint Calculations: Summary
As the first step to setting the carbon reduction strategy, it is critical to set a baseline carbon footprint to enable an understanding of the questions below:
• What are the current carbon emission sources?
• How much carbon is currently emitted?
• Who is responsible for each source’s carbon reduction plan?
Go Green Experts were appointed by Kingston Grammar School to calculate the carbon emissions for each category of consumption

4. Footprint Baseline & Scope
The Greenhouse Gas Protocol defines direct and indirect emissions as follows: Direct GHG emissions are emissions from sources that are owned or controlled by the reporting entity.
Indirect GHG emissions are emissions that are a consequence of the activities of the reporting entity but occur at sources owned or controlled by another entity.
The Greenhouse Gas Protocol further categorises these direct and indirect emissions into three scopes:
• Scope 1: Direct emissions from combustion of gas and other fuels.
• Scope 2: Indirect emissions resulting from the consumption of purchased electricity, heat or steam.
• Scope 3: Other indirect emissions, including those associated with purchased goods and services, leased assets, waste disposal, employee commuting, business travel, and the extraction, production, transport and distribution of purchased materials, fuels and electricity.
Scope 1
Scope 2
Scope 3
Sources
• Kingston Grammar School gas consumption.
• Kingston Grammar School electricity consumption.

• Purchases (estimated)
• Air travel.
• Staff Commuting (estimated)
• Waste (estimated)
• Water and sewerage (estimated)
• Coach travel
• Food (estimated)
7
Table 4.1 below details the emission sources included within Kingston Grammar School’s 2021/2022 carbon footprint used to calculate the baseline figure.
Table 4.1: Kingston Grammar School’s CO2e carbon footprint drivers for the period 1st August 2021 to 31st July 2022
The carbon emissions for each category of consumption have been calculated using the methodology defined in the Greenhouse Gas Protocol and the Carbon Conversion Factors published annually by DEFRA on behalf of the UK government.

The carbon footprint for Kingston Grammar School for the period 1st August 2021 to 31st July 2022 was calculated to be 431.12 Tonnes of CO2e as per Table 4.2 below:
Comments
This carbon footprint represents the “Baseline” position for Kingston Grammar School from which carbon reductions from 2022 will be measured against.

Commuting and Homeworking emissions have been estimated based on local industry average data for the number of employees.
The estimate for purchased goods and services was completed using expenditure data from documents obtained from Companies House and the Charities Commission.
8
Total Carbon Footprint 530.12 Tonnes CO2e Mains Gas 14.10 Tonnes CO2e Electricity 67.92 Tonnes CO2e Food 99.00 Tonnes CO2e Travel 11.11 Tonnes CO2e Staff Commuting 178 Tonnes CO2e Downstream Leasing 21.6 Tonnes CO2e Waste 33.97 Tonnes CO2e Water & Sewerage 3.00 Tonnes CO2e Air Con Cooling 0 Tonnes CO2e Purchases 101.42 Tonnes CO2e Split by scope: 530.12 Tonnes CO2e Scope 1 12.05 Tonnes CO2e Scope 2 50.21 Tonnes CO2e Scope 3 467.85 Tonnes CO2e
Table 4.2: Kingston Grammar School’s carbon footprint summary: 1st August 2021 to 31st July 2022
4.1 Data Quality and Assumptions
Data was obtained from meter readings and information provided by the school as well as by using data from Companies House and The Charities Commission.
Aspect Comment

Energy data
Purchasing
Waste data
Staff Commuting
Travel & Transport
Energy data was obtained from meter readings and split between the school consumption and the staff rental properties.

Data on purchased goods and services were obtained from the latest accounts available from Companies House. Emissions have been estimated based on that data.
Waste data were not available Waste emissions have been estimated based on 4 full skips of general waste per month sent to landfill.
Emissions from staff commuting were estimated using UK Office for National Statistics data on commuting for Kingston on Thames and the average split of modes of travel (Car, train, bus, bicycle etc) applied to 215 staff at the school and the number of school days in the period.
Figures for air travel were provided by the school. Emissions for travel by coaches have been calculated from the information provided.
No data was provided for food volumes. Our estimate has been completed in order to show what food emissions would look like.
Food
The emissions have been estimated assuming 1 meal per day per pupil for 190 days. The conversion factor of 0.6kg per pupil meal was obtained from published research
Table 4.3: Data Assumptions
Table 4.4 Data Quality
Tables 4.3 and 4.4 show exclusion and assumptions made and quality of data used. The action plan detailed in section 7 includes workstreams to refine and fill gaps in the data for future reporting.
9
Aspect Calculation Factors Comment Data Quality Electricity GHG Protocol Factors From data provided Very Good Gas GHG Protocol Factors From data provided Very Good Food Estimated Estimated Poor Travel GHG Protocol Factors Detailed travel data was provided. Fair Water & Sewerage GHG Protocol Factors From data provided Fair Waste GHG Protocol Factors From data provided Fair Commuting GHG Protocol Factors Estimated based on staff nos Fair Air Conditioning GHG Protocol Factors No data available Poor Purchases ONS Carbon Intensity by Industry Estimated from published accounts Fair Commentary
4.2 CO2e Emissions - Total Carbon Footprint


Commentary
The total Carbon Footprint for Kingston Grammar School has been calculated using the methodology defined in the World Resources Institute (WRI) Greenhouse Gas (GHG) Protocol and The Carbon Conversion Factors published annually by Defra on behalf of the UK government.

This chart shows the total emissions for the period from 1st August 2021 to 31st July 2022
The chart includes all scope emissions (Scope 1, Scope 2 and significant Scope 3).
Categorisation: Gas and electricity are reported in Scopes 1, 2 & 3, where the Scope 3 element covers upstream distribution losses.
10
Figure 4.5 Kingston Grammar School’s Total Carbon footprint
Kingston Grammar School Total Emissions Kingston Grammar School Total Emissions
4.3 Carbon Intensity

Carbon Intensity is a metric to allow an organisation to compare its emissions year on year as the size and activity increase or decrease. This is calculated by measuring emissions per £ Revenue or staff or product.
The metrics also allow comparison to industry averages and similar organisations that are also publishing their carbon intensity metrics.

11
Carbon Intensity Carbon Intensity by Scope Scope 1 Scope 2 Scope 1+2 Scope 3 Total Tonnes CO2e 530 12 50 62 468 530 Turnover £19,400,000 No of Staff 215 Tonnes CO2e Per Staff Member 2.47 0.06 0.23 0.29 2.18 2.47 Tonnes CO2e Per £m Turnover 27.33 0.62 2.59 3.21 24.12 27.33
Table 4.6 Kingston Grammar School’s Carbon Intensity
4.4 CO2e Emissions – Breakdown of Business Travel
Commentary
This chart shows a breakdown of travel including air and local coach travel.
The GHG conversion factor used was kg CO2e per mile travelled plus “Well to Tank” factor for each type of travel.

Well-to-tank (WTT) conversion factors for transport relate to the upstream Scope 3 emissions associated with extraction, refining and transportation of the raw fuels before they are used to power the transport mode. These are included in accordance with GHG protocol principles.

Coach travel has been estimated, further investigation should be completed to gain a more accurate figure.

12
Figure 4.7: Kingston Grammar School Carbon footprint emissions from Travel
Kingston Grammar School Business Travel Emissions
4.5 CO2e Emissions – Breakdown of Purchases
Kingston Grammar School Purchases Emissions


Commentary
The supply chain data used was based on the amount spent in the period on the categories listed in the latest accounts published on Companies House. The emissions were calculated using generic sector specific carbon intensity (CO2e pound £ pound) figures provided by the UK Office for National Statistics.

13
Figure 4.10 Kingston Grammar School’s Carbon footprint emissions from purchases
This chart breaks down the total emissions from purchases made by Kingston Grammar School for the period.
Figure 4.8: Kingston Grammar School Carbon footprint emissions from purchases
4.6 CO2e Emissions – Scopes 1, 2 & 3
Emission Scopes are defined by the internationally accepted Greenhouse Gas Protocol. The protocol has been developed through many years of cooperation with The World Resources Institute (WRI) and the World Business Council for Sustainable Development (WBCSD).

They are based on an assessment of which emissions from operations the organisation can directly control versus those which the organisation can merely influence.

The below diagram summarises the categories of emissions that are classified into each scope.

14
Figure 4.9 Depiction of Scope 1, Scope 2 and Scope 3 emission categories
Kingston Grammar School Data Types Included and Excluded By Scope


15 ASPECT Scope Reduction Factors Electricity 2 Monitor, and reduce use, install solar power, natural grid decarbonisation, and consider renewable energy. Gas 1 Reduce gas use. Business Travel 3 Reduce travel where possible, alternative transport, and technology improvements. Water 3 Monitor and reduce water use. Waste 3 Carry out a waste audit and understand how waste is processed. Commuting 3 Low carbon transport use, public transport, bicycle scheme. Food 3 Complete a food audit. Purchases 3 Cooperation with suppliers. Table 4.10: Summary of Reduction Concepts by Aspect CATEGORY DATA Tonnes ID DESCRIPTION APPLICABLE? INSCOPE? INCLUDED? AVAILABLE? QUALITY CO2e Scope 1 Directemissionsfromowned/controlledoperations 12.0 2% Scope1 CompanyFacilities Yes Yes Yes Yes VeryGoodPremisiesData.Includinggas 12.0 2% Scope1 CompanyVehicles No Yes Yes Yes N/A NoCompanyVehicles 0.0 0% Scope1 FugitiveEmissions Yes Yes No No Poor DatanotAvailable 0.0 0% Scope 2 Indirectemissionsfromthe use ofpurchasedelectricity,steam,heating,andcooling 50.2 9% Scope2 PurchasedElectricity Yes Yes Yes Yes VeryGoodFrom data. 50.2 9% Scope2 Steam No No No No N/A DatanotAvailable 0.0 0% Scope2 Heating No No No No N/A DatanotAvailable 0.0 0% Scope2 Cooling No No No No N/A DatanotAvailable 0.0 0% Scope 3 UPSTREAMSCOPE3EMISSIONS(SupplyChain) 446.3 84% Scope3 1 Purchasedgoodsandservices Yes Yes Yes Yes Fair Estimatedfrom accounts 200.4 38% Scope3 2 Capitalgoods Yes Yes Yes Yes Fair IncludedinCat1 0.0 0% Scope3 3 Fuel-andenergy-relatedactivities(notincludedinscope1orscope2) Yes Yes Yes Yes Good Distributionlosses 19.8 4% Scope3 4 Upstreamtransportationanddistribution Yes No No No Good From dataprovided 0.0 0% Scope3 5 Wastegeneratedinoperationsandwater Yes Yes Yes Yes Fair From dataprovided 37.0 0% Scope3 6 Businesstravel Yes Yes Yes Yes Fair Coachesemissionsestimated 11.1 2% Scope3 7 Employeecommuting Yes Yes Yes Yes Poor From dataprovided 178.0 34% Scope3 8 Upstreamleasedassets No No No No N/A Notrelevant 0.0 0% Scope 3 DOWNSTREAMSCOPE3EMISSIONS 21.6 4% Scope3 9 Downstreamtransportationanddistribution No No No No N/A Notrelevant 0.0 0% Scope3 10 Processingofsoldproducts No No No No N/A Notrelevant 0.0 0% Scope3 11 Useofsoldproducts No No No No N/A Notrelevant 0.0 0% Scope3 12 End-of-lifetreatmentofsoldproducts No No No No N/A Notrelevant 0.0 0% Scope3 13 Downstreamleasedassets No Yes Yes Yes Good Rentofproperty 21.6 4% Scope3 14 Franchises No No No No N/A Notrelevant 0.0 0% Scope3 15 Investments No No No No N/A Notrelevant 0.0 0% 530.12 100% SCOPE COMMENTS %
5. Decarbonising the Energy in the School.
Due to the construction of the buildings and the layout of the site, the opportunities for improving efficiency are significant. However, there are many complications and implementing a strategy to reduce emissions will take time and resources.
Developing a ten-year plan would help to spread the load on both manpower and resources.

Reducing gas consumption through efficiency measures should be considered. Ensuring that energy efficiency is maximised should be prioritised.
Behaviour change can contribute to a significant reduction in energy consumption

Moving away from natural gas: Possible change over from natural gas to other technology in the future.
Solar Thermal for Water Heating: Solar hot water could be used to supplement gas or electricity for the hot water needs of the main school and the sports facilities.
Introduction of renewable electricity using solar panels with possible battery storage: Assess the viability of on-site renewables, such as solar panel (PV) systems.
Obtain quotes and estimated generation capacity of solar systems at the school.
Solar Photovoltaic systems can be installed on the roof of the buildings subject to engineering and planning constraints.
If a 30kW system could be installed on the South facing roof of the Michael Fryan Theatre the estimated energy generated could be in the region of 30,500 kWh giving a reduction of approximately 10 tonnes of CO2e per annum
A full feasibility study would be required, the graph below shows the possible monthly output, a large percentage of the energy generated will be when the school is not operating at full capacity. Other factors to consider would be grid connection and energy consumption patterns of the buildings

16
Quotes should be obtained from reputable suppliers, the current energy supplier

TotalEnergies Gas & Power offer a solar solution that could be investigated in the first instance.
Utility suppliers:
TotalEnergies Gas & Power currently supply the energy to the school have committed to achieving Net Zero by 2050. The school should engage with TotalEnergies to investigate the ‘Green Gas’ option currently offered to reduce emissions in the short term. (see action plan section 3).

Examples of low-cost actions:
Drawing curtains on large windows; our thermal imaging report on a double-glazed patio door shows a 1.6°C difference in the heat transferred from the closed side and the open side.
Draughtproofing; the building has many places where draughts can be found. As up to 30% of heat can be lost in this way, it may be worth investigating measures to reduce the larger areas where draughts can enter
Reflective radiator panels. These fit on outside walls behind radiators and reflect heat into the room, therefore reducing the heat transfer from the building. Reflective panels are calculated to have an energy saving potential of 170kWh per square meter. As these are not aesthetically pleasing it is unlikely that they will be appropriate for every room.
17
6 Carbon Reduction Plan – Detailed Plan
The detailed carbon reduction plan provides clear initiatives to undertake over time, with shortterm initiatives being tackled first. In the longer term as new technology is developed and Government policy changes then the plan can flex to accommodate these changes.
6.1Carbon footprint and EMS ongoing management, review, and target setting.
Control
Short 1.1 Implement environmental policy and action plan. The Energy Saving Trust, Carbon Trust and other organisations provide guidance for managing school CO2 emissions.
Short 1.2 Raise awareness and consult with employees, pupils, suppliers and all other interested parties regarding CO2e emissions, energy consumption, and other environmental aspects.
Long 1.3 Embed CO2e reduction target setting into all processes within the school

Carbon footprint and EMS ongoing management, review and target setting.
Short 1.4 Appoint green champions/ ambassadors to assist with energy and resource management on a day-to-day basis. Consider ways to engage students in environmental learning projects in the classroom or on school grounds.
Short 1.5 Discuss ideas with senior staff to secure manager and other key staff engagement.
Short 1.6 Develop a structured training and CO2e awareness plan for staff.
Short 1.7 Ensure staff are aware of sustainability objectives, and train procurement staff to consider low carbon options where practical.
Influence

Short 1.8 Raise awareness with contractors and suppliers.
Medium 1.9 Include a review of all suppliers' and contractors’ carbon intensity.
Ongoing
Long 1.10 Continually review the action plan and include carbon footprint considerations.
Long 1.11 Continually identify relevant training and implement a training plan throughout the organisation.
18
Aspect Short –MediumLongTerm Ref Observations / Actions Responsible Person Target Date
6.2 Financial and Commercial
Short 2.1 Review commercial service supply chain, banks, insurance, accountancy, website, cloud hosting, training providers, software subscriptions, legal services, and other relevant suppliers.
Influence
Short 2.2 Raise awareness with procurement staff when reviewing or renewing contracts.
Short 2.3 Review sustainability of pension investments.
Short 2.4 Raise awareness with procurement staff when reviewing or renewing contracts.
Ongoing
Long 2.5 Continually review the supply chain and consider using suppliers offering the lowest CO2e options.
6.3 Facilities and school buildings

Control
Short 3.1 Ensure computers, copiers and display screens are set to optimum efficiency and switched off when not in use Review the energy consumption of the servers.
Short 3.2 Review the office and other equipment energy consumption. A PAT testing list will give details of the energy consumption of electrical equipment.
3.3 Complete an out-of-hours survey and review energy meter data to establish
3.4 Switch off campaign
Office Equipment
Medium 3.3 Review energy consumption and embodied CO2 as a criterion for future purchases.
Medium 3.4 Consider recycling and re-use options for office equipment when it is disposed of.
Medium 3.5 Regularly check and record accurate energy consumption data on an ongoing basis in order to measure changes.
Ongoing
Long 3.7 Consider IT lifecycle for future projects, can the equipment be repaired and re-used?
3.8 Consider building energy efficiency when planning any changes or upgrades in the future.
Control
Short 3.9 Review green energy tariffs to ensure they are the industry-leading options.

Influence
Energy Suppliers
Short 3.10 Review energy suppliers' sustainability credentials.
Short 3.11 Review supply chain energy supply contracts. Share learning with staff and other interested parties.
Short 3.12 Take meter readings in line with the read window schedule provided by TotalEnergy to ensure that accurate readings are taken (See 7.7)
Ongoing
19
Aspect Short –MediumLongTerm Ref Observations / Actions Responsible Person Target Date
Financial and commercial Control
Aspect Short –MediumLongTerm Ref Observations / Actions Responsible Person Target Date
Building Facilities

Medium 3.13 Review the meter readings and half-hourly data to establish patterns and spikes in consumption.
Medium 3.14 Continually review the market to ensure that renewable energy claims are valid.
Control
Short 3.15 Check for draughts and areas with low insulation levels.
Short 3.16 Review any available building infrastructure reports in conjunction with the carbon footprint.
Short 3.17 Replace older lighting with LED. Ensure lighting is not left on when not required.
Short 3.18 Provide guidance notices to staff on the general use of system controllers and the environment.
Short 3.19 Review the efficiency of the heating and cooling systems Check radiator valves are working efficiently, the systems are well maintained and the correct set points are used
Short 3.20 Install independent sub-metering to enable the accurate recording of electricity consumption
Medium 3.21 Review the EPC certificates for the properties leased to staff

The majority of the properties on Caversham Rd on the EPC register are E and F rating https://find-energy-certificate.service.gov.uk/find-acertificate/search-by-postcode?postcode=KT+2
Action could include solar PV, improved insulation, boiler upgrades, and installation of smart meters. Raising awareness of energy-saving actions. 3.22 Review room temperatures, reducing heating times by 1 hour per day could save 10%
Medium 3.23 Investigate the installation of onsite renewable energy sources such as photovoltaic cells on school properties.
Control
Facilities and Office Waste
Short 3.24 Conduct a waste audit in order to establish the volumes, types and final destination of waste generated. Contact the waste contractors, in many cases, they will be able to supply a full breakdown of the waste removed and their recycling rates.
Many waste contractors can provide data in order to establish the current situation
Control
Medium 3.25 "Consider the volume of Emails and cloud working / v teams chats. Depending on the length of the e-mail and the number of recipients, a single e-mail can contribute 17g of CO2. Influence
Facilities and Office
IT
Medium 3.26 Review IT systems and complete a carbon intensity audit.
Ongoing
Medium 3.27 Generic count on e-mails, review the requirement for a large number of e-mails.
Medium 3.28 Create an IT asset list in order to determine the current levels of equipment.
Medium 3.29 Review the list and plan to purchase low-energy alternatives in the future.
20 Aspect Short –MediumLongTerm Ref Observations / Actions Responsible Person Target Date
6.4 Procurement
Control Short 4.1 Engage with the supply chain to significantly reduce total emissions.
4.2 Ensure new contracts require suppliers to state their carbon footprint and have an action plan. Influence
Procurement

Medium 4.3 Complete a survey with key suppliers to determine the current status of their carbon awareness.
Medium 4.4 Support supply chain in order to help them manage footprint.
Ongoing Long 4.5 Implement a reduction plan.
4.6 Develop a consistent approach to data gathering throughout the supply chain.

4.7 Continually review best practices.
6.5 Catering
6.6 Travel
21
Aspect Short –MediumLongTerm Ref Observations / Actions Responsible Person Target Date
Medium
Long
Long
Aspect Short –MediumLongTerm Ref Observations / Actions Responsible Person Target Date Food Control Short 5.1 Conduct a food audit Short 5.2 Consider offering more local food choices Short 5.3 Consider more vegetarian food choices. Short 5.4 Measure the current levels of food waste. Influence 5.4 Establish the
of the waste. Ongoing Long 5.5 Continually
catering.
final destination
review
Aspect Short –MediumLongTerm Ref Observations / Actions Responsible Person Target Date Travel Control Short 6 1 Review air travel requirements Short 6 2 If flying is necessary, fly economy. Short 6 3 Reduce unnecessary travel Influence Medium 6 4 Switch to more efficient vehicles Ongoing Long 6 5 Continually review new vehicle technologies.


22 Aspect Short –MediumLongTerm Ref Observations / Actions Responsible Person Target Date Travel & Commuting Control Short
Gather specific data on, vehicle type, size and fuel. Influence Short
employee survey. Medium
Encourage
and electric vehicles. Ongoing Medium
vehicle
6 6
6 7 Carry out an
6 8
consideration of more efficient
6 9 Continually review new
technologies.
6.7 Sports Ground & Rowing Club

Control
Short 7.1 Continue to monitor diesel consumption
Short 7.2 Review the options to replace machinery with more efficient alternatives.
Short 7.3 Ensure staff are trained to use equipment as efficiently as possible.
Short 7.4 Review best practices for maintaining the grounds with maximum efficiency. For example, the ECB publishes guidance - How To Reduce Your Energy Consumption.
Short 7.6 Ensure the rowing club boats and coaching boat outboards are managed to reduce energy consumption and pollution risks. The Green Blue project provides excellent guidance.
Influence
Short 7.4 Continue to seek out innovative solutions such as seaweed instead of chemical solutions.
Short 7.5 Review the fate of the grass skips, does the waste go for composting?
Short 7.6 Review the waste collections to ensure bins are full when they are collected.
Ongoing
Long 7 7 Continually review the options to replace machinery with more efficient alternatives.
Control
Short 7 8 Continue to monitor energy consumption
Medium 7 9 Consider more efficient heating for the buildings. Review the options for retrofitting insulation and renewable energy generation to the current buildings.
Long 7.10 If any re-development is planned, ensure the best practice energy efficiency standards are specified.

Buildings
Influence
Medium 7 11 Work with the supply chain to reduce the footprint of purchases and maintenance.
Medium 7.12 Work with suppliers to establish the footprint of events such as weddings held at the site.
Ongoing
Medium 7.13 Consider renewable energy for the site. Energy-generating spin bikes and other equipment should be investigated.
23
Aspect Short –MediumLongTerm Ref Observations / Actions Responsible Person Target Date Ground care &
management
equipment
6.8 Reduction action examples- pictures from the site visit


Comments

Pictures from the site visit Draughts: The main front door has several gaps as do some of the sash windows in the staff room

Draught reduction can have a significant impact on reducing energy consumption. Due to the age and construction of the London Rd building, care would be needed to ensure that the insulation products are used. Some companies specialise in old and listed building window door draughtproofing

The Energy Saving Trust state that; ‘Draught-proofing is one of the cheapest and most effective ways to save energy –and Money’.
Lighting was left on in internal and external corridors and rooms during the site visit.
Consider lighting controls or regular checks to ensure lights are not left on for long periods in unoccupied areas. Review lighting throughout the school and replaced it with LED over time.


Boiler room pipe insulation: The pictures above show examples of well-insulated valves and some valves and joints that are not insulated at the sites.


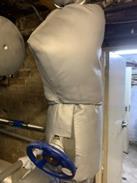
Valve insulation can be cost-effective as well as save emissions of CO2e. The surface area of a 2.5-inch valve is equal to approximately 5 feet of pipe. It was noted during the site visit that the small boiler room in the library had uninsulated valves, the room also had an air conditioning system.
There is a risk that the extra heat from the boiler will be compensated for by the extra energy consumed by the air conditioning system.

A schematic of the heating systems would enable the school to identify areas that can be improved

24
Example: Thermal images of an uninsulated joint and valve
Rowing club & Gym: Consider electricitygenerating spinning bikes and rowing machines when the current equipment is due for renewal.


Consider replacing old heaters with newer technologies such as infrared heating panels


Fridges & Freezers: Replace with more efficient versions when due for replacement, complete a review of their optimum running temperatures and have a checklist to ensure that they are working efficiently and at the correct temperature


25
Rowing club heaters
Lovekyn Chapel heaters
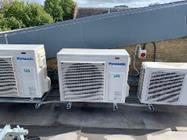
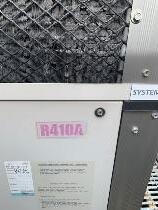
Check air conditioning service reports for leaks and gas losses.


An example of a fridge/ freezer thermometer

Raise awareness by using a colour-coded sticker system for sockets and switches
Use posters and other visual aids to highlight potential energy savings throughout the school.
Areas of glazing where potential improvements could be made


Green for equipment which should be switched off when not in use (ie televisions, computers, laptops, projectors and interactive whiteboards.)
Orange for equipment which should be switched off after checking that no one is using it (ie computers). • Red Do not touch. For equipment that should not be switched off (ie freezers or the main server).

26
Meter reading schedule provided by the utility supplier Query Account MPAN/MPR MeterType Notes 2598870 3006009853 1900060295493 HlafHourly Wedonotrequiremanualmeterreadswereceiveremotereaddirectlyfromthemetereveryhalf-hour. 2598871 3006016035 1900029025961 AMR 2598872 3006016046 1900038025391 AMR 2598873 3006016057 1900041022648 Normal Wewouldrequiremanualmeterreadingseachmonthwithinourreadwindow(betweenthe24thandthelastdayofeachmonth) 2598876 3006537446 9299616004 AMR Wedonotrequiremanualmeterreadswereceiveremotereaddirectlyfromthemeteronthelastdayofeachmonth 2598878 3006537457 79892310 Normal Wewouldrequiremanualmeterreadingseachmonthwithinourreadwindow(betweenthe24thandthelastdayofeachmonth) 2598879 3006537468 9321671609 AMR Wedonotrequiremanualmeterreadswereceiveremotereaddirectlyfromthemeteronthelastdayofeachmonth 2598880 3006537479 79892108 Normal Wewouldrequiremanualmeterreadingseachmonthwithinourreadwindow(betweenthe24thandthelastdayofeachmonth) 2598882 3006537480 79890306 Normal Wewouldrequiremanualmeterreadingseachmonthwithinourreadwindow(betweenthe24thandthelastdayofeachmonth) 2598883 3006537490 79890710 Normal Wewouldrequiremanualmeterreadingseachmonthwithinourreadwindow(betweenthe24thandthelastdayofeachmonth) 2598884 3006537501 79891409 Normal Wewouldrequiremanualmeterreadingseachmonthwithinourreadwindow(betweenthe24thandthelastdayofeachmonth)
Appendix A - Calculation Methodology
Carbon Emissions are calculated in accordance with the Greenhouse Gas (GHG) protocol using Carbon Conversion Factors issued annually by the,
• Department for Business, Energy & Industrial Strategy,
• Department for Environment Food & Rural Affairs and

• Office for National Statistics
Emissions consist of several atmospheric greenhouse gases which include Carbon Dioxide (CO2), Sulphur hexafluoride (SF6), Methane (CH4), Nitrous oxide (N2O), Ozone O3, Hydrofluorocarbons (HFCs) and Perfluorocarbons (PFCs). For simplicity of comparison, the global warming potential of all these gases is combined into Carbon Dioxide Equivalent (CO2e). All carbon emissions in this report are in CO2e units.
The formula for calculation is;
GHG emissions (tonnes CO2e) = activity data x emission conversion factor ÷ 1,000

The following is an example that shows a calculation for electricity. There are several causes of emissions from electricity, stated in total kg CO2e per kWh, these are:
These factors vary annually as grid efficiency and the percentage of renewable energy generated nationally change.
27
Description Scope Factor (kg CO2e / kWh) Emissions attributed to on-site consumption. 2 0.21233 Emissions attributed to transmission & distribution losses. 3 0.01879 Well-to-tank emissions factors for electricity generated. 3 0.05529 Well-to-tank emissions factors for electricity transmitted & distributed. 3 0.00489
Example calculation - Electricity Annual consumption of electricity (kWh) 634,616.8 kWh Emission Source Calculation Total CO2e (Tonnes) On-site consumption 634,616.8 x 0.21233 ÷ 1000 = 134.7 Transmission & distribution losses 634,616.8 x 0.01879 ÷ 1000 = 11.9 Well-to-tank for generation 634,616.8 x 0.05529 ÷ 1000 = 35.1 Well-to-tank transmission & distribution 634,616.8 x 0.00489 ÷ 1000 = 3.1 TOTAL 184.9
Appendix B - Documents and References Used in Calculation.

The calculations were carried out using mathematical models and the methodology defined in the Greenhouse Gas Protocol in particular;
GHG Corporate Accounting and Reporting Standard and Scope 2 Guidance

GHG Scope 2 Guidance
GHG Technical Guidance for Calculating Scope 3 Emissions
The Carbon Conversion Factors are published annually by DEFRA on behalf of the UK government.
The data sources for the models used include:
https://www.gov.uk/government/publications/greenhouse-gas-reporting-conversion-factors2021
https://www.ons.gov.uk/economy/environmentalaccounts/datasets/ukenvironmentalaccounts atmosphericemissionsgreenhousegasemissionsbyeconomicsectorandgasunitedkingdom
This calculation forms the baseline for Kingston Grammar School’s future carbon strategy.
The Greenhouse Gas Protocol has been developed between The World Resources Institute (WRI) and the World Business Council for Sustainable Development (WBCSD).
Greenhouse Gas Protocol | (ghgprotocol.org)
The calculations were performed using a specialist emission calculation tool aligned with the above protocols.
28
Appendix C - Example supplier questionnaire SUPPLIER ENVIRONMENTAL QUESTIONNAIRE
QUESTION
CARBON FOOTPRINT
1 Does the company measure its carbon emissions?
1a If so, what were emissions for the last financial year?
1b What was carbon intensity per £ turnover?
2 Is there a plan to reduce emissions?
3 Are emissions offset?
3a If so, is an accredited offsetting program used?

ENVIRONMENTAL MANAGEMENT
4 Is an accredited Environmental system in place (e.g. ISO 14001)?
5 Is an Environmental Policy in place and publicised?
ENERGY & WATER
6 Does the company monitor energy & water use?
Includingelectricity,gas,oil,andother fuel
7 Do you use a renewable energy provider?


TRANSPORT & TRAVEL
8 Is business travel mileage reported?
9 Is transport mileage monitored?
WASTE
10 Do you segregate waste?
11 Does the company produce hazardous waste?
12 Is waste disposal carried out by a licensed waste company?
13 Do you know the waste company's disposal policy?
%Recycled,landfilled,incinerated,etc
29
Y N
COMMENTS
Appendix D - Glossary.
Term Description
Absolute Reduction
Base Year
The actual reduction in emissions
A historical datum (e.g., year) against which a company’s emissions are tracked over time.
Base Year Emissions GHG emissions in the base year.
Baseline

Business Travel
Capital Goods
A hypothetical scenario for what GHG emissions would have been in the absence of a GHG project or reduction activity.
Transportation of employees for business-related activities.
Final goods that have an extended life and are used by the company to manufacture a product, provide a service, or sell, store, and deliver merchandise. In financial accounting, Examples of capital goods include equipment, machinery, buildings, facilities, and vehicles.
Carbon Footprint
Carbon Intensity
Carbon Neutral
The total greenhouse gas (GHG) emissions caused by an individual, event, organization, service, place or product, expressed as carbon dioxide equivalent (CO2e).
A measure of carbon emission against a variable of business operations such as turnover, output or staff.
A measure of the carbon emissions that are emitted over the full life cycle of a product or service and usually expressed as grams of CO2-e.
Circular Economy

CO2e
CO2 Equivalent
Direct Emissions
Downstream Emissions
Embodied Carbon
Emission Factor
A circular economy tries to break that cycle of make-usedispose with adaptive reuse
The universal unit of measurement to indicate the global warming potential (GWP) of each greenhouse gas, expressed in terms of the GWP of one unit of CO 2
Emissions from sources that are owned or controlled by the reporting company.
Indirect GHG emissions from sold goods and services.
The emissions that result from the entire project
A factor that converts activity data into GHG emissions data (e.g., kg CO2e emitted per litre of fuel consumed, kg CO2e emitted per Kilometer travelled, etc.).
Employee Commuting Transportation of employees between their homes and their worksites.
Environmental Product Declaration (EPD)
A document that quantifiably demonstrates the environmental impacts of a product.
30
Term Description

Equity Share Approach
Extrapolated Data
Global Warming Potential
A consolidation approach whereby a company accounts for GHG emissions from operations according to its share of equity in the operation.
Data from a similar process or activity that is used as a standin for the given process or activity and has been customized to be more representative of the given process or activity.
A factor describing the radiative forcing impact (degree of harm to the atmosphere) of (GWP) one unit of a given GHG relative to one unit of CO2
Greenhouse Gas
Gasses contributing to global warming. Seven gases, carbon dioxide (CO2); methane (CH4); nitrous oxide (N2O); hydrofluorocarbons (HFCs); perfluorocarbons (PFCs); sulphur hexafluoride (SF6), and nitrogen trifluoride (NF3).
Greenhouse Gas Inventory
Greenwashing

Indirect Emissions
A quantified list of an organization’s GHG emissions and sources.
PR tactic used to make a company or product appear environmentally friendly, without meaningfully reducing its environmental impact.
Emissions that are a consequence of the activities of the reporting company but occur at sources owned or controlled by another company.
Indirect GHG Emissions
Emissions that are a consequence of the operations of the reporting company, but occur at sources owned or controlled by another company. This includes Scope 2 and Scope 3.
Life Cycle Assessment (LCA)
Location-Based Method
Total emissions from the inputs and outputs throughout a product’s life cycle. From the moment it was created to the moment it has decayed.
A method to quantify Scope 2 GHG emissions based on average energy generation emission factors for defined locations.
Market-Based
A method to quantify Scope 2 GHG emissions based on GHG emissions emitted by the generators from which the reporter contractually purchases electricity.
Net Zero
Offsetting
A state in which the greenhouse gases going into the atmosphere are balanced by removal from the atmosphere.
The action or process of compensating for carbon dioxide emissions arising from industrial or other human activity, by participating in schemes designed to make equivalent reductions of carbon dioxide in the atmosphere.
Proxy Data
Data from a similar process or activity that is used as a standin for the given process or activity without being customized to be more representative of the given process or activity.
31
Term Description

Reporting Year The year for which emissions are reported.
Scope 1 Emissions Emissions from operations that are owned or controlled by the reporting company.
Scope 2 Emissions Indirect emissions from the generation of purchased or acquired electricity,

Scope 3 Emissions All indirect emissions (not included in Scope 2) that occur in the value chain of the reporting company, including both upstream and downstream emissions.
Secondary Data Data that is not from specific activities within a company’s value chain.
Supply Chain A network of organizations (e.g., manufacturers, wholesalers, distributors, and retailers) involved in the production, delivery, and sale of a product to the consumer.
Upstream Emissions Indirect GHG emissions from purchased or acquired goods and services.
Value Chain all of the upstream and downstream activities associated with the operations of the reporting company, including the use of sold products by consumers and the end-of-life treatment of sold products after consumer use.
Value Chain Emissions Emissions from the upstream and downstream activities associated with the operations of the reporting company.
Waste An output of a process that has no market value.
32


