




EastBayarea
CountyComparison
JumptoCountyComparison
AlamedaCounty
Alameda
JumptoAlamedaReport
Albany
JumptoAlbanyReport
Berkeley
JumptoBerkeleyReport
CastroValley
JumptoCastroValleyReport
Emeryville
JumptoEmeryvilleReport
Fremont
JumptoFremontReport
Hayward
JumptoHaywardReport
Oakland
JumptoOaklandReport
Piedmont
JumptoPiedmontReport
SanLeandro
JumptoSanLeandroReport
ContraCostaCounty
JumptoContraCosta
Alamo
JumptoAlamoReport
Concord
JumptoConcordReport
Danville
JumptoDanvilleReport
ElCerrito
JumptoElCerritoReport
ElSobrante
JumptoElSobranteReport
Lafayette
JumptoLafayetteReport
Napa
JumptoNapaReport
Sonoma
JumptoSonomaReport
Moraga
JumptoMoragaReport
Orinda
JumptoOrindaReport
PleasantHill
JumptoPlesantHillReport
SanPablo
JumptoSanPabloReport
WalnutCreek
JumptoWalnutCreekReport
ABOUTME
Anissawasbornandraisedinthe EastBayandNorthernPeninsula,and hasmaintainedapassionforreal estatesinceshepurchasedherfirst homeinthePiedmontAvenue neighborhoodnearLakeMerritt.She hashelpednumerousclients purchasehomesinSanFrancisco andNewYorkasanagentand broker/closingattorney,respectively. Clientdriven,Anissaishardworking andadventurous

AnissaattendedUCBerkeleyand GeorgeWashingtonLawandhas practicedlawforovertenyearsin commercialrealestate,securities andantitrustclassactionlitigation, aswellascomplianceandlegalinhousecounselforconstructionand civilengineeringcompanieson internationalprojects.Inherpersonal andprofessionalcareer,Anissahas traveledextensivelyadvisingclients inChina,Australia,Europeand SoutheastAsia.Duetoherinterestin internationallegalsystemsshehas livedandworkedinHongKong,the UKandAustralia.
Checkoutmywebsitehere
Eachofficeisindependentlyownedandoperated
ANISSA BURNLEY REALTOREXTRAORDINAIRE DRE#01471819 (415)290-5886 anissaburnley@kw.com www.heartmyhome.com
4937TelegraphAveSuiteA Oakland,CA94609
Iamdedicatedtomaintaininga long-termbusinessrelationshipwith you,asevidencedbymypastwork. Pleasecontactmewhenyou'reready tomoveforwardwithyournext purchaseorsale,andlet'sdiscuss howtomakeithappen. ScheduleAMeeting Workwith AnissaBurnley Bookaconsultationhere Let’sTalk AnissaBurnley (415)290-5886 anissaburnley@kw.com Let’sMeet 4937TelegraphAveSuiteA Oakland,CA94609
MyMobileApp
Curiousaboutwhat’strendinginyour neighborhood?Readytomakea move?Downloadourappforreal estateinsights,ondemand.
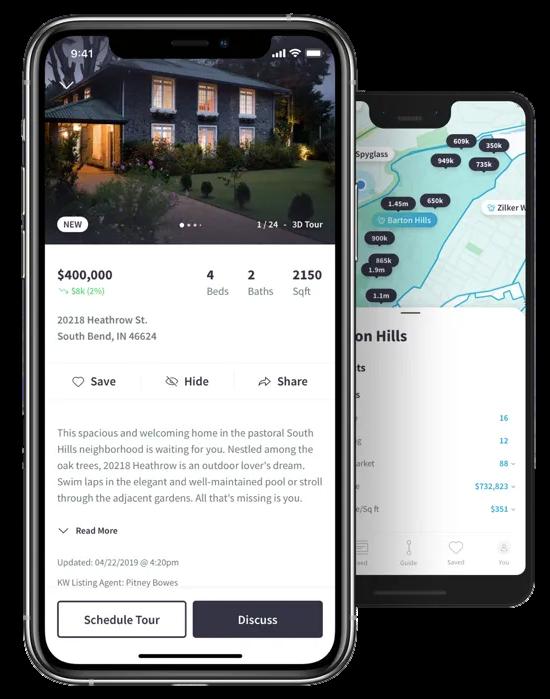
KeyFeatures
WorkwithanAgent CustomSearches
DynamicMap
GetLocal
AnytimeAccess
ShareInformation
DownloadtheKellerWilliamsReal EstateMobileAppforiPhone,iPad, andAndroidviathelinksbelow:

Formoreinformation,clickhere
TwoQuestionsToAskYourselfif You’reConsideringBuyingaHome
Ifyou’rethinkingofbuyingahome,chancesareyou’re payingattentiontojustabouteverythingyouhearabout thehousingmarket.Andyou’regettingyourinformation fromavarietyofchannels:thenews,socialmedia,your realestateagent,conversationswithfriendsandloved ones,overhearingsomeonechattingatthelocal supermarket,thelistgoesonandon.Mostlikely,home pricesandmortgageratesarecomingupalot.
Tohelpcutthroughthenoiseandgiveyouthe informationyouneedmost,takealookatwhatthedata says.Herearethetoptwoquestionsyouneedtoask yourselfabouthomepricesandmortgageratesasyou makeyourdecision:

What’syourhome reallyworthin today’smarket?
That'sreally thequestionyoushouldbe askingyourself
Ourmarketisincrediblydiverse,and rapidlychanging.Valuesvarynotjustby neighborhood,butbystreet Yourhome isn'tnecessarilyworthwhatyourneighbors’ homeis.Attheendoftheday,it’sthe currentmarketthatsetsthevalueofyour home.

So,doyouknowwhatyourhomeisworth intoday'smarket?
Icanhelp...
Contactmeforaconfidential,noobligation assessmentofyourhome'svalue.

EastBay CountyComparison
SFR,Condominiums,Townhouses—June2023
ComparingAveragePrice,MedianPrice,andHighestPrice/SF
InAlamedaCounty,theaveragepriceofpropertiesis$1,263,954,witha medianpriceof$1,081,416.Thissuggeststhatthemajorityofhomessoldin thecountyfallbelowthemedianprice.Additionally,thehighestpriceper squarefootrecordedinAlamedaCountyis$1,587,indicatingthepremium paidforcertainpropertiesbasedontheirsize.
Ontheotherhand,inContraCostaCounty,theaveragepriceisslightly lowerat$1,154,882,withamedianpriceof$850,000.Thissuggestsawider rangeofpricesinthecounty,withasignificantnumberofhomessold belowthemedianprice.Thehighestpricepersquarefootrecordedin ContraCostaCountyis$1,627,indicatingapremiumforspecificproperties intermsoftheirsize.
EastBay CountyComparison
SFR,Condominiums,Townhouses—June2023
ComparingNumberofSales,NumberofNewListings,andDayson Market
InAlamedaCounty,atotalof884propertiesweresold,indicatingahealthy levelofbuyeractivity.Additionally,therewere1,138newlistings,suggestinga decentsupplyofhomescomingontothemarket.Theaveragenumberof daysonthemarketwas17,indicatingthatpropertiesinAlamedaCountywere sellingrelativelyquickly.
Similarly,inContraCostaCounty,therewere912propertiessold,showinga robustlevelofbuyerdemandinthearea.Thenumberofnewlistingsstoodat 1,159,suggestingasteadyinfluxofhomesforpotentialbuyers.Theaverage numberofdaysonthemarketwasslightlylongerat20,indicatingthat propertiesinContraCostaCountytookabitmoretimetosellcomparedto AlamedaCounty.
BacktoTableofContents
Alameda County
COUNTYOVERVIEW
SFR,Condominiums,Townhouses
June2023
ComparingAveragePrice,MedianPrice,andHighestPrice/SF
Alameda County
COUNTYOVERVIEW
SFR,Condominiums,Townhouses June2023
ComparingNumberofSales,NumberofNewListings,andDayson Market
AlamedaCity
ALAMEDA COUNTY
What's in the Alameda data?
Therewere53single-familyhomesforsale, providing0.8monthsofinventory.There were53newlistings,and26homessoldata mediansalepriceof$1.5m.Themedian overbidpercentagewas114.5%,withan averageof12daysonthemarket.
Therewere48condoandtownhomeunits forsale,providing1.9monthsofinventory. Therewere48newlistings,and13unitssold atamediansalepriceof$736k.Themedian overbidpercentagewas105.1%,averaging 24daysonthemarket.


homes, Cerrito, Orinda, Danville, e2023. atawas 029039 edand et

48 New Listings 1.9 Months of Inventory $736K Median Sale Price 105.1% Median Sale vs List 24 Avg Days on Market 13 Sold Listings CONDO Condo & Townhomes
JUNE2022-JUNE2023
Single-Family Homes
Last 12 months, year-over-year.
Condos & Townhomes
Last 12 months, year-over-year.

Jun2022 Jul2022 Aug2022 Sep2022 Oct2022 Nov2022 Dec2022 Jan2023 Feb2023 Mar2023 Apr2023 May2023 Jun2023 125 100 75 50 25 0 Jun2022 Jul2022 Aug2022 Sep2022 Oct2022 Nov2022 Dec2022 Jan2023 Feb2023 Mar2023 Apr2023 May2023 Jun2023 75 50 25 0 AlamedaCity
LISTINGS FOR SALE SOLD LISTINGS
Median SalesPrice
Single-FamilyHomes
Themediansalesprice hasincreasedfrom$1.5m lastJune2022,to$1505m asofJune2023
Condos&Townhomes
Themediansalesprice hasdecreasedfrom $952klastJune2022,to $736kasofJune2023.
AVGDays OntheMarket
Single-FamilyHomes
Theaveragetimespent onthemarketwentdown from17dayslastJune 2022,to12daysasofJune 2023
Condos&Townhomes
Theaveragetimespent onthemarketwentup from19daysinJune2022, to24daysasofJune 2023
Overbids
Single-FamilyHomes
Theoverbidpercentage hasdecreasedfrom 123.2%lastJune2022,to 114.5%ayearlater.
Condos&Townhomes Theoverbidpercentage hasdecreasedfrom 108.2%lastJune2022,to 105.1%ayearlater.
Jun2022 Jul2022Aug2022Sep2022Oct2022Nov2022Dec2022Jan2023Feb2023Mar2023Apr2023May2023Jun2023 $2,000,000 $1,500,000 $1,000,000 $500,000 $0 Jun2022 Jul2022Aug2022Sep2022Oct2022Nov2022Dec2022 Jan2023Feb2023Mar2023Apr2023May2023 Jun2023 50 40 30 20 10 0 Jun2022 Jul2022Aug2022Sep2022Oct2022Nov2022Dec2022 Jan2023Feb2023Mar2023Apr2023May2023 Jun2023 125% 100% 75% 50% 25% 0%
BacktoTableofContents

Albany ALAMEDA COUNTY
What's in the Albany data?
Therewere9single-familyhomesforsale, providing0.1monthsofinventory.Therewere 9newlistings,and6homessoldata mediansalepriceof$1.3m.Themedian overbidpercentagewas129.5%,withan averageof11daysonthemarket.
Therewere7condoandtownhomeunitsfor sale,providing0.8monthsofinventory. Therewere7newlistings,and2unitssoldat amediansalepriceof$631k.Themedian overbidpercentagewas100.3%,withan averageof17daysonthemarket.

y
%
6 Sold Listings
$1.3M Median Sale Price

11 Avg Days on Market
er Metrics, includes all single-family homes, meda,Albany,Berkeley,CastroValley,ElCerrito, ,Hayward,Lafayette,Moraga,Oakland,Orinda, ndro, Alamo, Contra Costa, Concord, Danville, paandSonomafromJune2022toJune2023. ata,andmayvaryfromthetimethedatawas reliable but not guaranteed DRE# 02029039 2023 Eachofficeisindependentlyownedand
ily Homes
Condo & Townhomes
7 New Listings

2 Sold Listings
0.8 Months of Inventory
$631K Median Sale Price
100.3% Median Sale vs List
17 Avg Days on Market
CONDO
JUNE2022-JUNE2023
Single-Family Homes
Last 12 months, year-over-year.
Condos & Townhomes
Last 12 months, year-over-year.

Jun2022 Jul2022 Aug2022 Sep2022 Oct2022 Nov2022 Dec2022 Jan2023 Feb2023 Mar2023 Apr2023 May2023 Jun2023 40 30 20 10 0 Jun2022 Jul2022 Aug2022 Sep2022 Oct2022 Nov2022 Dec2022 Jan2023 Feb2023 Mar2023 Apr2023 May2023 Jun2023 40 30 20 10 0 Albany
LISTINGS FOR SALE SOLD LISTINGS
Median SalesPrice
Single-FamilyHomes
Themediansalesprice hasdecreasedfrom$1.6m lastJune2022,to$13mas ofJune2023
Condos&Townhomes
Themediansalesprice hasincreasedfrom$534k lastJune2022,to$631kas ofJune2023.
AVGDays OntheMarket
Single-FamilyHomes
Theaveragetimespent onthemarketwentdown from17dayslastJune 2022,to11daysasofJune 2023
Condos&Townhomes
Theaveragetimespent onthemarketwentdown from20daysinJune2022, to17daysasofJune2023
Overbids
Single-FamilyHomes
Theoverbidpercentage hasincreasedfrom121.3% lastJune2022,to129.5%a yearlater.
Condos&Townhomes
Theoverbidpercentage hasincreasedfrom98.1% lastJune2022,to100.3%a yearlater.
Jun2022 Jul2022Aug2022Sep2022Oct2022Nov2022Dec2022Jan2023Feb2023Mar2023Apr2023May2023Jun2023 $2,000,000 $1,500,000 $1,000,000 $500,000 $0 Jun2022 Jul2022Aug2022Sep2022Oct2022Nov2022Dec2022 Jan2023Feb2023Mar2023Apr2023May2023 Jun2023 200 150 100 50 0 Jun2022 Jul2022Aug2022Sep2022Oct2022Nov2022Dec2022 Jan2023Feb2023Mar2023Apr2023May2023 Jun2023 150% 100% 50% 0%
BacktoTableofContents

Berkeley ALAMEDA COUNTY
What's in the Berkeley data?
Therewere96single-familyhomesforsale, providing0.6monthsofinventory.There were96newlistings,and46homessoldata mediansalepriceof$1.6m.Themedian overbidpercentagewas121.3%,withan averageof17daysonthemarket.
Therewere29condoandtownhomeunits forsale,providing1.9monthsofinventory. Therewere96newlistings,and14unitssold atamediansalepriceof$825k.Themedian overbidpercentagewas106.3%,withan averageof18daysonthemarket.


e y homes, ElCerrito, nd,Orinda, d, Danville, une2023. datawas 02029039 wnedand ket
M

Months 106 Media
LISTINGS FOR SALE SOLD LISTINGS

3 Apr2023 May2023 Jun2023 023 Apr2023 May2023 Jun2023 y y
Median SalesPrice
Single-FamilyHomes
Themediansalesprice hasdecreasedfrom$1.7m lastJune2022,to$16mas ofJune2023
Condos&Townhomes
Themediansalesprice hasdecreasedfrom $950klastJune2022,to $825kasofJune2023.
AVGDays OntheMarket
Single-FamilyHomes
Theaveragetimespent onthemarketwentup from16dayslastJune 2022,to17daysasofJune 2023
Condos&Townhomes
Theaveragetimespent onthemarketwentup from16daysinJune2022, to18daysasofJune2023
Overbids
Single-FamilyHomes
Theoverbidpercentage hasdecreasedfrom 132.8%lastJune2022,to 121.3%ayearlater.
Condos&Townhomes
Theoverbidpercentage hasdecreasedfrom116.6% lastJune2022,to106.3%a yearlater.
Jun2022 Jul2022Aug2022Sep2022Oct2022Nov2022Dec2022Jan2023Feb2023Mar2023Apr2023May2023Jun2023 $2,000,000 $1,500,000 $1,000,000 $500,000 $0 Jun2022 Jul2022Aug2022Sep2022Oct2022Nov2022Dec2022 Jan2023Feb2023Mar2023Apr2023May2023 Jun2023 50 40 30 20 10 0 Jun2022 Jul2022Aug2022Sep2022Oct2022Nov2022Dec2022 Jan2023Feb2023Mar2023Apr2023May2023 Jun2023 150% 100% 50% 0%
BacktoTableofContents

Castro Valley
COUNTY
What's in the Castro Valley data?
Therewere69single-familyhomesforsale, providing0.8monthsofinventory.There were38newlistingsand29homessoldata mediansalepriceof$1.2m.Themedian overbidpercentagewas103.9%,withan averageof22daysonthemarket.
Therewere9condoandtownhomeunitsfor sale,providing0.5monthsofinventory. Therewere6newlistings,and5unitssoldat amediansalepriceof$1m.Themedian overbidpercentagewas106.1%,withan averageof23daysonthemarket.
 ALAMEDA
mily Homes

29 Sold Listings
tory
% List
$1.2M Median Sale Price
22 Avg Days on Market
Broker Metrics, includes all single-family homes, nAlameda,Albany,Berkeley,CastroValley,ElCerrito, emont,Hayward,Lafayette,Moraga,Oakland,Orinda, n Leandro, Alamo, Contra Costa, Concord, Danville, ek,NapaandSonomafromJune2022toJune2023. narydata,andmayvaryfromthetimethedatawas emed reliable but not guaranteed DRE# 02029039 stBay2023 Eachofficeisindependentlyownedand
CONDO
Condo & Townhomes
6 New Listings

5 Sold Listings
0.5 Months of Inventory
$1M Median Sale Price
106.1% Median Sale vs List
23 Avg Days on Market
JUNE2022-JUNE2023
Single-Family Homes

Last 12 months, year-over-year.
Condos & Townhomes
Last 12 months, year-over-year.
Jun2022 Jul2022 Aug2022 Sep2022 Oct2022 Nov2022 Dec2022 Jan2023 Feb2023 Mar2023 Apr2023 May2023 Jun2023 200 150 100 50 0 Jun2022 Jul2022 Aug2022 Sep2022 Oct2022 Nov2022 Dec2022 Jan2023 Feb2023 Mar2023 Apr2023 May2023 Jun2023 30 20 10 0 CastroValley
LISTINGS FOR SALE SOLD LISTINGS
Median SalesPrice
Single-FamilyHomes
Themediansalesprice hasdecreasedfrom$1.4m lastJune2022,to$12mas ofJune2023
Condos&Townhomes
Themediansalesprice hasdecreasedfrom$1.3m lastJune2022,to$1mas ofJune2023.
AVGDays OntheMarket
Single-FamilyHomes
Theaveragetimespent onthemarkethas remainedat22dayssince June2022
Condos&Townhomes
Theaveragetimespent onthemarketwentup from17dayslastJune 2022,to23daysasof June2023
Overbids
Single-FamilyHomes
Theoverbidpercentage hasdecreasedfrom 105.7%lastJune2022,to 103.9%ayearlater.
Condos&Townhomes
Theoverbidpercentage hasdecreasedfrom109.1% lastJune2022,to106.1%a yearlater.
Jun2022 Jul2022Aug2022Sep2022Oct2022Nov2022Dec2022Jan2023Feb2023Mar2023Apr2023May2023Jun2023 $1,500,000 $1,000,000 $500,000 $0 Jun2022 Jul2022Aug2022Sep2022Oct2022Nov2022Dec2022 Jan2023Feb2023Mar2023Apr2023May2023 Jun2023 125 100 75 50 25 0 Jun2022 Jul2022Aug2022Sep2022Oct2022Nov2022Dec2022 Jan2023Feb2023Mar2023Apr2023May2023 Jun2023 125% 100% 75% 50% 25% 0%
BacktoTableofContents
Emeryville ALAMEDA
COUNTY
What's in the Emeryville data?
Therewere2single-familyhomesforsale, providing0monthsofinventory.Therewere 2newlistings,and1homesoldatamedian salepriceof$500k.Themedianoverbid percentagewas71.5%,withanaverageof38 daysonthemarket.
Therewere42condoandtownhomeunits forsale,providing5.8monthsofinventory. Therewere42newlistingsand10unitssold atamediansalepriceof$622k.Themedian overbidpercentagewas102%,withan averageof13daysonthemarket.


K homes, Cerrito, Orinda, anville, e2023. tawas 029039 edand et

New
of
Median Sale vs List 13
CONDO Condo & Townhomes
42
Listings 5.8 Months
Inventory $622K Median Sale Price 102%
Avg Days on Market 10 Sold Listings
JUNE2022-JUNE2023
Single-Family Homes
Last 12 months, year-over-year.
Condos & Townhomes
Last 12 months, year-over-year.

Jun2022 Jul2022 Aug2022 Sep2022 Oct2022 Nov2022 Dec2022 Jan2023 Feb2023 Mar2023 Apr2023 May2023 Jun2023 6 4 2 0 Jun2022 Jul2022 Aug2022 Sep2022 Oct2022 Nov2022 Dec2022 Jan2023 Feb2023 Mar2023 Apr2023 May2023 Jun2023 75 50 25 0 Emeryville
LISTINGS FOR SALE SOLD LISTINGS
Median SalesPrice
Single-FamilyHomes
Themediansalesprice hasincreasedfrom$0last June2022,to$500kasof June2023
Condos&Townhomes
Themediansalesprice hasdecreasedfrom $650klastJune2022,to $622kasofJune2023.
AVGDays OntheMarket
Single-FamilyHomes
Theaveragetimespent onthemarketwentup from12dayslastJune 2022,to38daysasof June2023
Condos&Townhomes
Theaveragetimespent onthemarketwentup from12daysinJune2022, to13daysasofJune2023
Overbids
Single-FamilyHomes
Theoverbidpercentage hasincreasedfrom0% lastJune2022,to71.5%a yearlater.
Condos&Townhomes
Theoverbidpercentage hasdecreasedfrom 104.4%lastJune2022,to 102%ayearlater.
Jun2022 Jul2022Aug2022Sep2022Oct2022Nov2022Dec2022Jan2023Feb2023Mar2023Apr2023May2023Jun2023 $1,500,000 $1,000,000 $500,000 $0 Jun2022 Jul2022Aug2022Sep2022Oct2022Nov2022Dec2022 Jan2023Feb2023Mar2023Apr2023May2023 Jun2023 60 40 20 0 Jun2022 Jul2022Aug2022Sep2022Oct2022Nov2022Dec2022 Jan2023Feb2023Mar2023Apr2023May2023 Jun2023 125% 100% 75% 50% 25% 0%
BacktoTableofContents
Fremont ALAMEDA COUNTY
What's in the Fremont data?
Therewere125single-familyhomesforsale, providing0.8monthsofinventory.There were75newlistings,and70homessoldata mediansalepriceof$1.6m.Themedian overbidpercentagewas105.5%,withan averageof10daysonthemarket.
Therewere122condoandtownhomeunits forsale,providing1.2monthsofinventory. Therewere64newlistings,and40unitssold atamediansalepriceof$833k.Themedian overbidpercentagewas102.3%,withan averageof17daysonthemarket.


64 New Listings 1.2 Months of Inventory $833 Median Sal 102.3% Median Sale vs List Avg Days on 4 Sold L COND Condo & Townho

y y
Median SalesPrice
Single-FamilyHomes
Themediansalesprice hasdecreasedfrom$1.7m lastJune2022,to$16mas ofJune2023
Condos&Townhomes
Themediansalesprice hasdecreasedfrom $950klastJune2022,to $833kasofJune2023.
AVGDays OntheMarket
Single-FamilyHomes
Theaveragetimespent onthemarketwentdown from15dayslastJune 2022,to10daysasofJune 2023
Condos&Townhomes
Theaveragetimespent onthemarketwentup from16daysinJune2022, to17daysasofJune2023
Overbids
Single-FamilyHomes
Theoverbidpercentage hasincreasedfrom105.3% lastJune2022,to105.5%a yearlater.
Condos&Townhomes
Theoverbidpercentage hasdecreasedfrom 104.3%lastJune2022,to 102.3%ayearlater.
Jun2022 Jul2022Aug2022Sep2022Oct2022Nov2022Dec2022Jan2023Feb2023Mar2023Apr2023May2023Jun2023 $2,000,000 $1,500,000 $1,000,000 $500,000 $0 Jun2022 Jul2022Aug2022Sep2022Oct2022Nov2022Dec2022 Jan2023Feb2023Mar2023Apr2023May2023 Jun2023 50 40 30 20 10 0 Jun2022 Jul2022Aug2022Sep2022Oct2022Nov2022Dec2022 Jan2023Feb2023Mar2023Apr2023May2023 Jun2023 125% 100% 75% 50% 25% 0%
BacktoTableofContents

Hayward ALAMEDA COUNTY
What's in the Hayward data?
Therewere149single-familyhomesforsale, providing0.9monthsofinventory.There were80newlistings,and62homessoldata mediansalepriceof$917k.Themedian overbidpercentagewas105.6%,withan averageof15daysonthemarket.
Therewere72condoandtownhomeunits forsale,providing0.9monthsofinventory. Therewere33newlistings,and25unitssold atamediansalepriceof$687k.Themedian overbidpercentagewas100.4%,withan averageof18daysonthemarket.
SFH Single-Family Homes

80 New Listings
62 Sold Listings
0.9 Months of Inventory
$917K Median Sale Price
105.6% Median Sale vs List
15 Avg Days on Market
The data, sourced from Broker Metrics, includes all single-family homes, condosandtownhomesinAlameda,Albany,Berkeley,CastroValley,ElCerrito, ElSobrante,Emeryville,Fremont,Hayward,Lafayette,Moraga,Oakland,Orinda, Piedmont, San Pablo, San Leandro, Alamo, Contra Costa, Concord, Danville, PleasantHill,WalnutCreek,NapaandSonomafromJune2022toJune2023. Thismayincludepreliminarydata,andmayvaryfromthetimethedatawas gathered All data is deemed reliable but not guaranteed DRE# 02029039
CopyrightKWAdvisorsEastBay2023 Eachofficeisindependentlyownedand operated

33 New Listings 0.9 Months of Inventory $687K Median Sale Price 100.4% Median Sale vs List 18 Avg Days on Market 25 Sold Listings CONDO Condo & Townhomes
Last
Last 12 months, year-over-year.

Jun2022 Jul2022 Aug2022 Sep2022 Oct2022 Nov2022 Dec2022 Jan2023 Feb2023 Mar2023 Apr2023 May2023 Jun2023 400 300 200 100 0 Jun2022 Jul2022 Aug2022 Sep2022 Oct2022 Nov2022 Dec2022 Jan2023 Feb2023 Mar2023 Apr2023 May2023 Jun2023 150 100 50 0 Hayward
Homes
JUNE2022-JUNE2023 Single-Family
year-over-year.
& Townhomes
12 months,
Condos
LISTINGS FOR SALE SOLD LISTINGS
Median SalesPrice
Single-FamilyHomes
Themediansalesprice hasdecreasedfrom $950klastJune2022,to $917kasofJune2023
Condos&Townhomes
Themediansalesprice hasincreasedfrom$652k lastJune2022,to$687kas ofJune2023.
AVGDays OntheMarket
Single-FamilyHomes
Theaveragetimespent onthemarketwentdown from19dayslastJune 2022,to15daysasofJune 2023
Condos&Townhomes
Theaveragetimespent onthemarketwentdown from21daysinJune2022, to18daysasofJune2023
Overbids
Single-FamilyHomes
Theoverbidpercentage hasincreasedfrom104.5% lastJune2022,to105.6%a yearlater.
Condos&Townhomes
Theoverbidpercentage hasdecreasedfrom105.1% lastJune2022,to100.4%a yearlater.
Jun2022Jul2022Aug2022Sep2022Oct2022Nov2022Dec2022Jan2023Feb2023Mar2023Apr2023May2023Jun2023 $1,000,000 $750,000 $500,000 $250,000 $0 Jun2022 Jul2022Aug2022Sep2022Oct2022Nov2022Dec2022 Jan2023Feb2023Mar2023Apr2023May2023 Jun2023 75 50 25 0 Jun2022 Jul2022Aug2022Sep2022Oct2022Nov2022Dec2022 Jan2023Feb2023Mar2023Apr2023May2023 Jun2023 125% 100% 75% 50% 25% 0%
BacktoTableofContents

Oakland ALAMEDA COUNTY
What's in the Oakland data?
Therewere523single-familyhomesforsale, providing1.6monthsofinventory.There were523newlistings,and173homessoldat amediansalepriceof$1m.Themedian overbidpercentagewas114.2%,withan averageof23daysonthemarket.
Therewere208condoandtownhomeunits forsale,providing2.8monthsofinventory. Therewere208newlistings,and44units soldatamediansalepriceof$587k.The medianoverbidpercentagewas101.9%,with anaverageof30daysonthemarket.

SFH Single-Family Homes
523 New Listings
173 Sold Listings

1.6 Months of Inventory
$1M Median Sale Price
114.2% Median Sale vs List
23 Avg Days on Market
The data, sourced from Broker Metrics, includes all single-family homes, condosandtownhomesinAlameda,Albany,Berkeley,CastroValley,ElCerrito, ElSobrante,Emeryville,Fremont,Hayward,Lafayette,Moraga,Oakland,Orinda, Piedmont, San Pablo, San Leandro, Alamo, Contra Costa, Concord, Danville, PleasantHill,WalnutCreek,NapaandSonomafromJune2022toJune2023. Thismayincludepreliminarydata,andmayvaryfromthetimethedatawas gathered All data is deemed reliable but not guaranteed DRE# 02029039
CopyrightKWAdvisorsEastBay2023 Eachofficeisindependentlyownedand operated

208 New Listings 2.8 Months of Inventory $587K Median Sale Price 101.9% Median Sale vs List 30 Avg Days on Market 44 Sold Listings CONDO Condo & Townhomes
Last
Last 12 months, year-over-year.

Jun2022 Jul2022 Aug2022 Sep2022 Oct2022 Nov2022 Dec2022 Jan2023 Feb2023 Mar2023 Apr2023 May2023 Jun2023 1000 750 500 250 0 Jun2022 Jul2022 Aug2022 Sep2022 Oct2022 Nov2022 Dec2022 Jan2023 Feb2023 Mar2023 Apr2023 May2023 Jun2023 400 300 200 100 0 Oakland JUNE2022-JUNE2023
Homes
Single-Family
12
year-over-year.
& Townhomes
months,
Condos
LISTINGS FOR SALE SOLD LISTINGS
Median SalesPrice
Single-FamilyHomes
Themediansalesprice hasdecreasedfrom$1.2m lastJune2022,to$1mas ofJune2023
Condos&Townhomes
Themediansalesprice hasdecreasedfrom $635klastJune2022,to $587kasofJune2023.
AVGDays OntheMarket
Single-FamilyHomes
Theaveragetimespent onthemarketwentup from20dayslastJune 2022,to23daysasofJune 2023
Condos&Townhomes
Theaveragetimespent onthemarketwentup from26daysinJune2022, to30daysasofJune 2023
Overbids
Single-FamilyHomes
Theoverbidpercentage hasdecreasedfrom124% lastJune2022,to114.2%a yearlater.
Condos&Townhomes
Theoverbidpercentage hasdecreasedfrom 104.8%lastJune2022,to 101.9%ayearlater.
Jun2022Jul2022Aug2022Sep2022Oct2022Nov2022Dec2022Jan2023Feb2023Mar2023Apr2023May2023Jun2023 $1,250,000 $1,000,000 $750,000 $500,000 $250,000 $0 Jun2022 Jul2022Aug2022Sep2022Oct2022Nov2022Dec2022 Jan2023Feb2023Mar2023Apr2023May2023 Jun2023 60 40 20 0 Jun2022 Jul2022Aug2022Sep2022Oct2022Nov2022Dec2022 Jan2023Feb2023Mar2023Apr2023May2023 Jun2023 125% 100% 75% 50% 25% 0%
BacktoTableofContents

Piedmont ALAMEDA
COUNTY
What's in the Piedmont data?
Therewere37single-familyhomesforsale, providing1.4monthsofinventory.Therewere 37newlistings,and13homessoldata mediansalepriceof$2.2m.Themedian overbidpercentagewas99.9%,withan averageof17daysonthemarket.
Therewasnodataforcondoand townhouseunitsthismonth.

amily Homes

13 Sold Listings
ntory
% s List
$2.2M Median Sale Price
17
Avg Days on Market
m Broker Metrics, includes all single-family homes, sinAlameda,Albany,Berkeley,CastroValley,ElCerrito, Fremont,Hayward,Lafayette,Moraga,Oakland,Orinda, San Leandro, Alamo, Contra Costa, Concord, Danville, eek,NapaandSonomafromJune2022toJune2023. minarydata,andmayvaryfromthetimethedatawas eemed reliable but not guaranteed DRE# 02029039 EastBay2023 Eachofficeisindependentlyownedand
CONDO

Condo & Townhomes
No data for this month.
JUNE2022-JUNE2023
Single-Family Homes

Last 12 months, year-over-year.
Condos & Townhomes
Last 12 months, year-over-year.
Jun2022 Jul2022 Aug2022 Sep2022 Oct2022 Nov2022 Dec2022 Jan2023 Feb2023 Mar2023 Apr2023 May2023 Jun2023 50 40 30 20 10 0 Jun2022 Jul2022 Aug2022 Sep2022 Oct2022 Nov2022 Dec2022 Jan2023 Feb2023 Mar2023 Apr2023 May2023 Jun2023 100 75 50 25 0
Piedmont
LISTINGS FOR SALE SOLD LISTINGS No
data for this month.
Median SalesPrice
Single-FamilyHomes
Themediansalesprice hasdecreasedfrom $33mlastJune2022,to $22masofJune2023
Condos&Townhomes
Therewasnodatafor condoandtownhouse unitsthismonth.
AVGDays OntheMarket
Single-FamilyHomes
Theaveragetimespent onthemarketwentdown from20dayslastJune 2022,to17daysasofJune 2023
Condos&Townhomes
Therewasnodatafor condoandtownhouse unitsthismonth.
Overbids
Single-FamilyHomes
Theoverbidpercentage hasdecreasedfrom118.8% lastJune2022,to99.9%a yearlater.
Condos&Townhomes
Therewasnodatafor condoandtownhouse unitsthismonth.
Jun2022Jul2022Aug2022Sep2022Oct2022Nov2022Dec2022Jan2023Feb2023Mar2023Apr2023May2023Jun2023 $4,000,000 $3,000,000 $2,000,000 $1,000,000 $0 Jun2022 Jul2022Aug2022Sep2022Oct2022Nov2022Dec2022 Jan2023Feb2023Mar2023Apr2023May2023 Jun2023 40 30 20 10 0 Jun2022 Jul2022Aug2022Sep2022Oct2022Nov2022Dec2022 Jan2023Feb2023Mar2023Apr2023May2023 Jun2023 125% 100% 75% 50% 25% 0%
BacktoTableofContents

San Leandro
ALAMEDA COUNTY
What's in the San Leandro data?
Therewere70single-familyhomesforsale, providing0.9monthsofinventory.There were43newlistings,and41homessoldata mediansalepriceof$865k.Themedian overbidpercentagewas107.2%,withan averageof13daysonthemarket.
Therewere33condoandtownhomeunits forsale,providing1.6monthsofinventory. Therewere15newlistingsand10unitssold atamediansalepriceof$520k.Themedian overbidpercentagewas101.5%,withan averageof27daysonthemarket.

865K an Sale Price 1 d Listings mes es all single-family homes, eley,CastroValley,ElCerrito, te,Moraga,Oakland,Orinda, ra Costa, Concord, Danville, omJune2022toJune2023. fromthetimethedatawas uaranteed DRE# 02029039 isindependentlyownedand 3 Days on Market
Con
1 New Listi
1. Months of Inven
101.5% Median Sale vs

2023 Feb2023 Mar2023 Apr2023 May2023 Jun2023 2023 Feb2023 Mar2023 Apr2023 May2023 Jun2023 o
y y r.
r.
OLD LISTINGS
Median SalesPrice
Single-FamilyHomes
Themediansalesprice hasdecreasedfrom$891k lastJune2022,to$865kas ofJune2023
Condos&Townhomes
Themediansalesprice hasdecreasedfrom$615k lastJune2022,to$520k asofJune2023.
AVGDays OntheMarket
Single-FamilyHomes
Theaveragetimespent onthemarketwentdown from16dayslastJune 2022,to13daysasofJune 2023
Condos&Townhomes
Theaveragetimespent onthemarketwentup from18daysinJune2022, to27daysasofJune 2023
Overbids
Single-FamilyHomes
Theoverbidpercentage hasdecreasedfrom112.2% lastJune2022,to107.2%a yearlater.
Condos&Townhomes
Theoverbidpercentage hasdecreasedfrom 108.3%lastJune2022,to 101.5%ayearlater.
Jun2022Jul2022Aug2022Sep2022Oct2022Nov2022Dec2022Jan2023Feb2023Mar2023Apr2023May2023Jun2023 $1,000,000 $750,000 $500,000 $250,000 $0 Jun2022 Jul2022Aug2022Sep2022Oct2022Nov2022Dec2022 Jan2023Feb2023Mar2023Apr2023May2023 Jun2023 60 40 20 0 Jun2022 Jul2022Aug2022Sep2022Oct2022Nov2022Dec2022 Jan2023Feb2023Mar2023Apr2023May2023 Jun2023 125% 100% 75% 50% 25% 0%
BacktoTableofContents

ContraCostaCounty
COUNTYOVERVIEW
SFR,Condominiums,Townhouses June2023
ComparingAveragePrice,MedianPrice,andHighestPrice/SF
June2023 ComparingNumberofSales,NumberofNewListings,andDayson Market
ContraCostaCounty COUNTYOVERVIEW SFR,Condominiums,Townhouses
ContraCosta County
What's in the Contra Costa data?
Therewere1,644single-familyhomesfor sale,providing1monthofinventory.There were1,644newlistingsand714 homessold atamediansalepriceof$930k.Themedian overbidpercentagewas101.8%,withan averageof19daysonthemarket.
Therewere504condoandtownhomeunits forsale,providing1.3monthsofinventory. Therewere1,644newlistingsand196units soldatamediansalepriceof$628k.The medianoverbidpercentagewas101.1%,with anaverageof23daysonthemarket.

SFH Single-Family Homes

1,644 New Listings
714 Sold Listings
1 Months of Inventory
$930K Median Sale Price
101.8% Median Sale vs List
19 Avg Days on Market
The data, sourced from Broker Metrics, includes all single-family homes, condosandtownhomesinAlameda,Albany,Berkeley,CastroValley,ElCerrito, ElSobrante,Emeryville,Fremont,Hayward,Lafayette,Moraga,Oakland,Orinda, Piedmont, San Pablo, San Leandro, Alamo, Contra Costa, Concord, Danville, PleasantHill,WalnutCreek,NapaandSonomafromJune2022toJune2023. Thismayincludepreliminarydata,andmayvaryfromthetimethedatawas gathered All data is deemed reliable but not guaranteed DRE# 02029039
CopyrightKWAdvisorsEastBay2023 Eachofficeisindependentlyownedand operated
1,644 New Listings

Median
Price 101.1% Median Sale vs List 23 Avg Days
Market
Condo & Townhomes
1.3 Months of Inventory $628K
Sale
on
196 Sold Listings CONDO
Last 12 months,
Condos
Last 12 months, year-over-year.

Jun2022 Jul2022 Aug2022 Sep2022 Oct2022 Nov2022 Dec2022 Jan2023 Feb2023 Mar2023 Apr2023 May2023 Jun2023 4000 3000 2000 1000 0 Jun2022 Jul2022 Aug2022 Sep2022 Oct2022 Nov2022 Dec2022 Jan2023 Feb2023 Mar2023 Apr2023 May2023 Jun2023 1000 750 500 250 0 ContraCostaCounty
JUNE2022-JUNE2023
Single-Family Homes
year-over-year.
& Townhomes
LISTINGS FOR SALE SOLD LISTINGS
Median SalesPrice
Single-FamilyHomes
Themediansalesprice hasincreasedfrom$925k lastJune2022,to$930kas ofJune2023
Condos&Townhomes
Themediansalesprice hasincreasedfrom$600k lastJune2022,to$628k asofJune2023.
AVGDays OntheMarket
Single-FamilyHomes
Theaveragetimespent onthemarkethas remainedat19dayssince June2022
Condos&Townhomes
Theaveragetimespent onthemarketwentup from15daysinJune2022, to23daysasofJune 2023
Overbids
Single-FamilyHomes
Theoverbidpercentage hasdecreasedfrom 105.2%lastJune2022,to 101.8%ayearlater.
Condos&Townhomes
Theoverbidpercentage hasdecreasedfrom105.1% lastJune2022,to101.1%a yearlater.
Jun2022Jul2022Aug2022Sep2022Oct2022Nov2022Dec2022Jan2023Feb2023Mar2023Apr2023May2023Jun2023 $1,000,000 $750,000 $500,000 $250,000 $0 Jun2022 Jul2022Aug2022Sep2022Oct2022Nov2022Dec2022 Jan2023Feb2023Mar2023Apr2023May2023 Jun2023 50 40 30 20 10 0 Jun2022 Jul2022Aug2022Sep2022Oct2022Nov2022Dec2022 Jan2023Feb2023Mar2023Apr2023May2023 Jun2023 125% 100% 75% 50% 25% 0%
BacktoTableofContents

Alamo
CONTRA COSTA COUNTY
What's in the Alamo data?
Therewere49single-familyhomesforsale, providing0.9monthsofinventory.There were49newlistingsand22homessoldata medianpriceof$3m.Themedianoverbid percentagewas98.5%,withanaverageof19 daysonthemarket.
Therewere1condoandtownhomeunitfor sale,providing0monthsofinventory.There was1newlisting,and1unitsoldatapriceof $1.3m.Themedianoverbidpercentagewas 100%,withanaverageof6daysonthe market.


$3M Median Sale Price 22 Sold Listings Homes trics, includes all single-family homes, Albany,Berkeley,CastroValley,ElCerrito, ward,Lafayette,Moraga,Oakland,Orinda, Alamo, Contra Costa, Concord, Danville, dSonomafromJune2022toJune2023. ndmayvaryfromthetimethedatawas le but not guaranteed DRE# 02029039 Eachofficeisindependentlyownedand 19 Avg Days on Market
1 New Listings
1 Sold Listings
0 Months of Inventory
$1.3M Median Sale Price
100% Median Sale vs List
6 Avg Days on Market
Condo & Townhomes
CONDO
JUNE2022-JUNE2023
Single-Family Homes
Last 12 months, year-over-year.
Condos & Townhomes
Last 12 months, year-over-year.

Jun2022 Jul2022 Aug2022 Sep2022 Oct2022 Nov2022 Dec2022 Jan2023 Feb2023 Mar2023 Apr2023 May2023 Jun2023 80 60 40 20 0 Jun2022 Jul2022 Aug2022 Sep2022 Oct2022 Nov2022 Dec2022 Jan2023 Feb2023 Mar2023 Apr2023 May2023 Jun2023 5 4 3 2 1 0
Alamo
LISTINGS FOR SALE SOLD LISTINGS
Median SalesPrice
Single-FamilyHomes
Themediansalesprice hasincreasedfrom$2.9m lastJune2022,to$3mas ofJune2023
Condos&Townhomes
Themediansalesprice hasincreasedfrom$0 lastJune2022,to$1.3mas ofJune2023.
AVGDays OntheMarket
Single-FamilyHomes
Theaveragetimespent onthemarketwentup from12dayslastJune 2022,to19daysasofJune 2023
Condos&Townhomes
Theaveragetimespent onthemarketwentup from0daysinJune2022, to6daysasofJune2023.
Overbids
Single-FamilyHomes
Theoverbidpercentage hasdecreasedfrom 102.4%lastJune2022,to 98.5%ayearlater.
Condos&Townhomes
Theoverbidpercentage hasincreasedfrom0% lastJune2022,to100%a yearlater.
Jun2022Jul2022Aug2022Sep2022Oct2022Nov2022Dec2022Jan2023Feb2023Mar2023Apr2023May2023Jun2023 $4,000,000 $3,000,000 $2,000,000 $1,000,000 $0 Jun2022 Jul2022Aug2022Sep2022Oct2022Nov2022Dec2022 Jan2023Feb2023Mar2023Apr2023May2023 Jun2023 150 100 50 0 Jun2022 Jul2022Aug2022Sep2022Oct2022Nov2022Dec2022 Jan2023Feb2023Mar2023Apr2023May2023 Jun2023 125% 100% 75% 50% 25% 0%
BacktoTableof Contents
BacktoTableofContents


80 Sold Listings
$845K Median Sale Price %
14 Avg Days on Market
er Metrics, includes all single-family homes, meda,Albany,Berkeley,CastroValley,ElCerrito, Hayward,Lafayette,Moraga,Oakland,Orinda, dro, Alamo, Contra Costa, Concord, Danville, aandSonomafromJune2022toJune2023. ata,andmayvaryfromthetimethedatawas reliable but not guaranteed DRE# 02029039 2023 Eachofficeisindependentlyownedand

ily Homes

70 New Listings 2.1 Months of Inventory $437K Median Sale Price 102.2% Median Sale vs List 14 Avg Days on Market 21 Sold Listings CONDO Condo & Townhomes
Last 12 months,
Last 12 months, year-over-year.

Jun2022 Jul2022 Aug2022 Sep2022 Oct2022 Nov2022 Dec2022 Jan2023 Feb2023 Mar2023 Apr2023 May2023 Jun2023 400 300 200 100 0 Jun2022 Jul2022 Aug2022 Sep2022 Oct2022 Nov2022 Dec2022 Jan2023 Feb2023 Mar2023 Apr2023 May2023 Jun2023 125 100 75 50 25 0 Concord
Homes
JUNE2022-JUNE2023 Single-Family
year-over-year.
& Townhomes
Condos
LISTINGS FOR SALE SOLD LISTINGS
Median SalesPrice
Single-FamilyHomes
Themediansalesprice hasdecreasedfrom$875k lastJune2022,to$845kas ofJune2023
Condos&Townhomes
Themediansalesprice hasdecreasedfrom $465klastJune2022,to $437kasofJune2023.
AVGDays OntheMarket
Single-FamilyHomes
Theaveragetimespent onthemarketwentdown from15dayslastJune 2022,to14daysasofJune 2023
Condos&Townhomes
Theaveragetimespent onthemarketwentdown from16daysinJune2022, to14daysasofJune2023.
Overbids
Single-FamilyHomes
Theoverbidpercentage hasdecreasedfrom 105.6%lastJune2022,to 103.2%ayearlater.
Condos&Townhomes
Theoverbidpercentage hasdecreasedfrom 103.5%lastJune2022,to 102.2%ayearlater.
Jun2022Jul2022Aug2022Sep2022Oct2022Nov2022Dec2022Jan2023Feb2023Mar2023Apr2023May2023Jun2023 $1,000,000 $750,000 $500,000 $250,000 $0 Jun2022 Jul2022Aug2022Sep2022Oct2022Nov2022Dec2022 Jan2023Feb2023Mar2023Apr2023May2023 Jun2023 50 40 30 20 10 0 Jun2022 Jul2022Aug2022Sep2022Oct2022Nov2022Dec2022 Jan2023Feb2023Mar2023Apr2023May2023 Jun2023 125% 100% 75% 50% 25% 0%
BacktoTableofContents

Danville CONTRA COSTA COUNTY
What's in the Danville data?
Therewere148single-familyhomesforsale, providing0.9monthsofinventory.There were148newlistingsand58homessoldat amedianpriceof$2m.Themedianoverbid percentagewas98.6%,withanaverageof16 daysonthemarket.
Therewere20condoandtownhomeunits forsale,providing0.9monthsofinventory. Therewere20newlistings,and9unitssold atamedianpriceof$1.1m.Themedian overbidpercentagewas101%,withan averageof13daysonthemarket.

SFH ingle-Family Homes

148 ew Listings
58 Sold Listings
0.9 onths of Inventory
$2M Median Sale Price
98.6% edian Sale vs List
16 Avg Days on Market
e data, sourced from Broker Metrics, includes all single-family homes, ndosandtownhomesinAlameda,Albany,Berkeley,CastroValley,ElCerrito, Sobrante,Emeryville,Fremont,Hayward,Lafayette,Moraga,Oakland,Orinda, dmont, San Pablo, San Leandro, Alamo, Contra Costa, Concord, Danville, asantHill,WalnutCreek,NapaandSonomafromJune2022toJune2023. smayincludepreliminarydata,andmayvaryfromthetimethedatawas thered All data is deemed reliable but not guaranteed DRE# 02029039 pyrightKWAdvisorsEastBay2023 Eachofficeisindependentlyownedand erated
20 New Listings
9 Sold Listings
0.6 Months of Inventory
$1.1M Median Sale Price
101% Median Sale vs List
13 Avg Days on Market
Condo &
CONDO
Townhomes
Single-Family Homes

Last 12 months, year-over-year.
Condos & Townhomes
Last 12 months, year-over-year.
Jun2022 Jul2022 Aug2022 Sep2022 Oct2022 Nov2022 Dec2022 Jan2023 Feb2023 Mar2023 Apr2023 May2023 Jun2023 250 200 150 100 50 0 Jun2022 Jul2022 Aug2022 Sep2022 Oct2022 Nov2022 Dec2022 Jan2023 Feb2023 Mar2023 Apr2023 May2023 Jun2023 50 40 30 20 10 0 Danville
JUNE2022-JUNE2023
LISTINGS FOR SALE SOLD LISTINGS
Median SalesPrice
Single-FamilyHomes
Themediansalesprice hasdecreasedfrom $23mlastJune2022,to $2masofJune2023
Condos&Townhomes
Themediansalesprice hasdecreasedfrom$1.2m lastJune2022,to$1.1mas ofJune2023.
AVGDays OntheMarket
Single-FamilyHomes
Theaveragetimespent onthemarketwentup from15dayslastJune 2022,to16daysasofJune 2023
Condos&Townhomes
Theaveragetimespent onthemarketwentup from8daysinJune2022, to13daysasofJune2023.
Overbids
Single-FamilyHomes
Theoverbidpercentage hasdecreasedfrom 103.8%lastJune2022,to 98.6%ayearlater.
Condos&Townhomes
Theoverbidpercentage hasdecreasedfrom 102.3%lastJune2022,to 101%ayearlater.
Jun2022 Jul2022Aug2022Sep2022Oct2022Nov2022Dec2022Jan2023Feb2023Mar2023Apr2023May2023Jun2023 $2,500,000 $2,000,000 $1,500,000 $1,000,000 $500,000 $0 Jun2022 Jul2022Aug2022Sep2022Oct2022Nov2022Dec2022 Jan2023Feb2023Mar2023Apr2023May2023 Jun2023 50 40 30 20 10 0 Jun2022 Jul2022Aug2022Sep2022Oct2022Nov2022Dec2022 Jan2023Feb2023Mar2023Apr2023May2023 Jun2023 125% 100% 75% 50% 25% 0%
BacktoTableofContents

ElCerrito
CONTRA COSTA COUNTY
What's in the El Cerrito data?
Therewere23single-familyhomesforsale, providing1.6monthsofinventory.There were23newlistingsand18homessoldata mediansalepriceof$1.2m.Themedian overbidpercentagewas116.3%,withan averageof13daysonthemarket.
Therewere5condoandtownhomeunitsfor sale,providing4monthsofinventory.There were5newlistings,and2unitssoldata mediansalepriceof$857k.Themedian overbidpercentagewas107.9%,withan averageof15daysonthemarket.

ngs
2M ale Price
on Market
ngle-family homes, stroValley,ElCerrito, ga,Oakland,Orinda, a, Concord, Danville, e2022toJune2023.
etimethedatawas ed DRE# 02029039 endentlyownedand

107.9% Median Sale vs
New Listi
Months of Inven
Con

2023 Feb2023 Mar2023 Apr2023 May2023 Jun2023 2023 Feb2023 Mar2023 Apr2023 May2023 Jun2023
y y r.
r.
OLD LISTINGS
Median SalesPrice
Single-FamilyHomes
Themediansalesprice hasdecreasedfrom$1.3m lastJune2022,to$12mas ofJune2023
Condos&Townhomes
Themediansalesprice hasincreasedfrom$0 lastJune2022,to$857kas ofJune2023.
AVGDays OntheMarket
Single-FamilyHomes
Theaveragetimespent onthemarketwentdown from18dayslastJune 2022,to13daysasofJune 2023
Condos&Townhomes
Theaveragetimespent onthemarketwentup from12daysinJune2022, to15daysasofJune2023
Overbids
Single-FamilyHomes
Theoverbidpercentage hasremainedat116.3% sinceJune2022.
Condos&Townhomes
Theoverbidpercentage hasincreasedfrom0% lastJune2022,to107.9%a yearlater.
Jun2022 Jul2022Aug2022Sep2022Oct2022Nov2022Dec2022Jan2023Feb2023Mar2023Apr2023May2023Jun2023 $1,500,000 $1,000,000 $500,000 $0 Jun2022 Jul2022Aug2022Sep2022Oct2022Nov2022Dec2022 Jan2023Feb2023Mar2023Apr2023May2023 Jun2023 60 40 20 0 Jun2022 Jul2022Aug2022Sep2022Oct2022Nov2022Dec2022 Jan2023Feb2023Mar2023Apr2023May2023 Jun2023 125% 100% 75% 50% 25% 0%
BacktoTableofContents

ElSobrante
CONTRA COSTA COUNTY
What's in the El Sobrante data?
Therewere20single-familyhomesforsale, providing1monthofinventory.Therewere 20newlistingsand10homessoldata medianpriceof$894k.Themedianoverbid percentagewas101.8%,withanaverageof 34daysonthemarket.
Therewere3condoandtownhomeunitsfor sale,providing1monthofinventory.There were3newlistings,and2unitssoldata medianpriceof$386k.Themedianoverbid percentagewas98.7%,withanaverageof9 daysonthemarket.

He-Family Homes
ngs of Inventory
10 Sold Listings
$894K Median Sale Price
.8% Sale vs List
34 Avg Days on Market
urced from Broker Metrics, includes all single-family homes, ownhomesinAlameda,Albany,Berkeley,CastroValley,ElCerrito, meryville,Fremont,Hayward,Lafayette,Moraga,Oakland,Orinda, n Pablo, San Leandro, Alamo, Contra Costa, Concord, Danville, WalnutCreek,NapaandSonomafromJune2022toJune2023. udepreliminarydata,andmayvaryfromthetimethedatawas data is deemed reliable but not guaranteed DRE# 02029039 AdvisorsEastBay2023 Eachofficeisindependentlyownedand


Mon 9 Me

023 May2023 Jun2023 2023 May2023 Jun2023 y y S
Median SalesPrice
Single-FamilyHomes
Themediansalesprice hasincreasedfrom$815k lastJune2022,to$894kas ofJune2023
Condos&Townhomes
Themediansalesprice hasincreasedfrom$204k lastJune2022,to$386k asofJune2023.
AVGDays OntheMarket
Single-FamilyHomes
Theaveragetimespent onthemarketwentup from23dayslastJune 2022,to34daysasof June2023
Condos&Townhomes
Theaveragetimespent onthemarketwentdown from13daysinJune2022, to9daysasofJune2023.
Overbids
Single-FamilyHomes
Theoverbidpercentage hasdecreasedfrom 105.5%lastJune2022,to 101.8%ayearlater.
Condos&Townhomes
Theoverbidpercentage hasdecreasedfrom109.1% lastJune2022,to98.7%a yearlater.
Jun2022Jul2022Aug2022Sep2022Oct2022Nov2022Dec2022Jan2023Feb2023Mar2023Apr2023May2023Jun2023 $1,000,000 $750,000 $500,000 $250,000 $0 Jun2022 Jul2022Aug2022Sep2022Oct2022Nov2022Dec2022 Jan2023Feb2023Mar2023Apr2023May2023 Jun2023 125 100 75 50 25 0 Jun2022 Jul2022Aug2022Sep2022Oct2022Nov2022Dec2022 Jan2023Feb2023Mar2023Apr2023May2023 Jun2023 125% 100% 75% 50% 25% 0%
BacktoTableofContents

Lafayette
CONTRA COSTA COUNTY
What's in the Lafayette data?
Therewere61single-familyhomesforsale, providing1.5monthsofinventory.Therewere 61newlistingsand27homessoldata mediansalepriceof$1.9m.Themedian overbidpercentagewas98.1%,withan averageof24daysonthemarket.
Therewere10condoandtownhomeunitsfor sale,providing2.3monthsofinventory. Therewere10newlistings,and4unitssold atamediansalepriceof$917k.Themedian overbidpercentagewas97.4%,withan averageof49daysonthemarket.

SFH Single-Family Homes

61 New Listings
27 Sold Listings
1.5 Months of Inventory
$1.9M Median Sale Price
98.1% Median Sale vs List
24 Avg Days on Market
The data, sourced from Broker Metrics, includes all single-family homes, condosandtownhomesinAlameda,Albany,Berkeley,CastroValley,ElCerrito, ElSobrante,Emeryville,Fremont,Hayward,Lafayette,Moraga,Oakland,Orinda, Piedmont, San Pablo, San Leandro, Alamo, Contra Costa, Concord, Danville, PleasantHill,WalnutCreek,NapaandSonomafromJune2022toJune2023. Thismayincludepreliminarydata,andmayvaryfromthetimethedatawas gathered All data is deemed reliable but not guaranteed DRE# 02029039
CopyrightKWAdvisorsEastBay2023 Eachofficeisindependentlyownedand operated
10 New Listings

4 Sold Listings
2.3 Months of Inventory
$917K Median Sale Price
97.4% Median Sale vs List
49 Avg Days on Market
&
CONDO Condo
Townhomes
JUNE2022-JUNE2023
Single-Family Homes
Last 12 months, year-over-year.
Condos & Townhomes
Last 12 months, year-over-year.

Jun2022 Jul2022 Aug2022 Sep2022 Oct2022 Nov2022 Dec2022 Jan2023 Feb2023 Mar2023 Apr2023 May2023 Jun2023 125 100 75 50 25 0 Jun2022 Jul2022 Aug2022 Sep2022 Oct2022 Nov2022 Dec2022 Jan2023 Feb2023 Mar2023 Apr2023 May2023 Jun2023 20 15 10 5 0 Lafayette
LISTINGS FOR SALE SOLD LISTINGS
Median SalesPrice
Single-FamilyHomes
Themediansalesprice hasdecreasedfrom$2m lastJune2022,to$19mas ofJune2023
Condos&Townhomes
Themediansalesprice hasdecreasedfrom$1.7m lastJune2022,to$917kas ofJune2023.
AVGDays OntheMarket
Single-FamilyHomes
Theaveragetimespent onthemarketwentup from13dayslastJune 2022,to24daysasof June2023
Condos&Townhomes
Theaveragetimespent onthemarketwentup from9daysinJune2022, to49daysasofJune 2023
Overbids
Single-FamilyHomes
Theoverbidpercentage hasdecreasedfrom109% lastJune2022,to98.1%a yearlater.
Condos&Townhomes
Theoverbidpercentage hasdecreasedfrom 108.3%lastJune2022,to 97.4%ayearlater.
Jun2022 Jul2022Aug2022Sep2022Oct2022Nov2022Dec2022Jan2023Feb2023Mar2023Apr2023May2023Jun2023 $2,500,000 $2,000,000 $1,500,000 $1,000,000 $500,000 $0 Jun2022 Jul2022Aug2022Sep2022Oct2022Nov2022Dec2022 Jan2023Feb2023Mar2023Apr2023May2023 Jun2023 80 60 40 20 0 Jun2022 Jul2022Aug2022Sep2022Oct2022Nov2022Dec2022 Jan2023Feb2023Mar2023Apr2023May2023 Jun2023 125% 100% 75% 50% 25% 0%
BacktoTableofContents

Moraga
CONTRA COSTA COUNTY
What's in the Moraga data?
Therewere21single-familyhomesforsale, providing0.4monthsofinventory.There were21newlistingsand18homessoldata mediansalepriceof$2.1m.Themedian overbidpercentagewas104.1%,withan averageof13daysonthemarket.
Therewere10condoandtownhomeunitsfor sale,providing0.7monthsofinventory. Therewere10newlistings,and8unitssold atamediansalepriceof$807k.Themedian overbidpercentagewas101.4%,withan averageof13daysonthemarket.

Hle-Family Homes

tings
4 of Inventory
18 Sold Listings
$2.1M Median Sale Price
4.1% Sale vs List
13 Avg Days on Market
ourced from Broker Metrics, includes all single-family homes, townhomesinAlameda,Albany,Berkeley,CastroValley,ElCerrito, Emeryville,Fremont,Hayward,Lafayette,Moraga,Oakland,Orinda, an Pablo, San Leandro, Alamo, Contra Costa, Concord, Danville, WalnutCreek,NapaandSonomafromJune2022toJune2023. ludepreliminarydata,andmayvaryfromthetimethedatawas l data is deemed reliable but not guaranteed DRE# 02029039 WAdvisorsEastBay2023 Eachofficeisindependentlyownedand
10 New Listings

Sold
0.7 Months of Inventory
$80 Median Sa
101.4% Median Sale vs List Avg Days on
COND Condo & Townho
raga
2-JUNE2023
GS FOR SALE SOLD LISTINGS
amily Homes onths, year-over-year.
& Townhomes onths, year-over-year.

Aug2022 Sep2022 Oct2022 Nov2022 Dec2022 Jan2023 Feb2023 Mar2023 Apr2023 May2023 Jun2023 Aug2022 Sep2022 Oct2022 Nov2022 Dec2022 Jan2023 Feb2023 Mar2023 Apr2023 May2023 Jun2023
Median SalesPrice
Single-FamilyHomes
Themediansalesprice hasdecreasedfrom $23mlastJune2022,to $21masofJune2023
Condos&Townhomes
Themediansalesprice hasdecreasedfrom $905klastJune2022,to $807kasofJune2023.
AVGDays OntheMarket
Single-FamilyHomes
Theaveragetimespent onthemarketwentdown from14dayslastJune 2022,to13daysasofJune 2023
Condos&Townhomes
Theaveragetimespent onthemarketwentup from10daysinJune2022, to13daysasofJune2023.
Overbids
Single-FamilyHomes
Theoverbidpercentage hasdecreasedfrom111.3% lastJune2022,to104.1%a yearlater.
Condos&Townhomes
Theoverbidpercentage hasdecreasedfrom101.6% lastJune2022,to101.4%a yearlater.
Jun2022 Jul2022Aug2022Sep2022Oct2022Nov2022Dec2022Jan2023Feb2023Mar2023Apr2023May2023Jun2023 $3,000,000 $2,000,000 $1,000,000 $0 Jun2022 Jul2022Aug2022Sep2022Oct2022Nov2022Dec2022 Jan2023Feb2023Mar2023Apr2023May2023 Jun2023 125 100 75 50 25 0 Jun2022 Jul2022Aug2022Sep2022Oct2022Nov2022Dec2022 Jan2023Feb2023Mar2023Apr2023May2023 Jun2023 125% 100% 75% 50% 25% 0%
BacktoTableofContents

Orinda
CONTRA COSTA COUNTY
What's in the Orinda data?
Therewere44 single-familyhomesforsale, providing1.1 monthsofinventory.Therewere 44newlistings,and20homessoldata mediansalepriceof$1.9m.Themedian overbidpercentagewas105.4%,withan averageof24daysonthemarket.
Therewere2condoandtownhomeunitsfor sale,providing0monthsofinventory.There were2newlistings,and1unitsoldata mediansalepriceof$1.2m.Themedian overbidpercentagewas100.1%,withan averageof0daysonthemarket.

M Price s -family homes, Valley,ElCerrito, Oakland,Orinda, oncord, Danville, 22toJune2023. methedatawas DRE# 02029039 ntlyownedand Market
2

Condo & Townhomes
New Listings 0 Months of Inventory $1.2M Median Sale Price 100.1% Median Sale vs List 0 Avg Days on Market 1 Sold Listings CONDO
JUNE2022-JUNE2023
Single-Family Homes

Last 12 months, year-over-year.
Condos & Townhomes
Last 12 months, year-over-year.
Jun2022 Jul2022 Aug2022 Sep2022 Oct2022 Nov2022 Dec2022 Jan2023 Feb2023 Mar2023 Apr2023 May2023 Jun2023 100 75 50 25 0 Jun2022 Jul2022 Aug2022 Sep2022 Oct2022 Nov2022 Dec2022 Jan2023 Feb2023 Mar2023 Apr2023 May2023 Jun2023 6 4 2 0
Orinda
LISTINGS FOR SALE SOLD LISTINGS
Median SalesPrice
Single-FamilyHomes
Themediansalesprice hasdecreasedfrom $23mlastJune2022,to $19masofJune2023
Condos&Townhomes
Themediansalesprice hasdecreasedfrom$1.5m lastJune2022,to$1.2mas ofJune2023.
AVGDays OntheMarket
Single-FamilyHomes
Theaveragetimespent onthemarketwentup from13dayslastJune 2022,to24daysasof June2023
Condos&Townhomes
Theaveragetimespent onthemarkethas remainedat0dayssince June2022
Overbids
Single-FamilyHomes
Theoverbidpercentage hasdecreasedfrom 106.8%lastJune2022,to 105.4%ayearlater.
Condos&Townhomes
Theoverbidpercentage hasincreasedfrom95.5% lastJune2022,to100.1%a yearlater.
Jun2022Jul2022Aug2022Sep2022Oct2022Nov2022Dec2022Jan2023Feb2023Mar2023Apr2023May2023Jun2023 $2,500,000 $2,000,000 $1,500,000 $1,000,000 $500,000 $0 Jun2022 Jul2022Aug2022Sep2022Oct2022Nov2022Dec2022 Jan2023Feb2023Mar2023Apr2023May2023 Jun2023 75 50 25 0 Jun2022 Jul2022Aug2022Sep2022Oct2022Nov2022Dec2022 Jan2023Feb2023Mar2023Apr2023May2023 Jun2023 125% 100% 75% 50% 25% 0%
BacktoTableofContents
Pleasant Hill
CONTRA COSTA COUNTY
What's in the Pleasant Hill data?
Therewere45single-familyhomesforsale, providing0.6monthsofinventory.There were45newlistingsand22homessoldata medianpriceof$1.1m.Themedianoverbid percentagewas103.8%,withanaverageof 18daysonthemarket.
Therewere19condoandtownhomeunitsfor sale,providing0.8monthsofinventory. Therewere9unitssoldatamedianpriceof $711k.Themedianoverbidpercentagewas 101.3%,withanaverageof23daysonthe market.

SFH Single-Family Homes

45 New Listings
22 Sold Listings
0.6 Months of Inventory
$1.1M Median Sale Price
103.8% Median Sale vs List
18 Avg Days on Market
The data, sourced from Broker Metrics, includes all single-family homes, condosandtownhomesinAlameda,Albany,Berkeley,CastroValley,ElCerrito, ElSobrante,Emeryville,Fremont,Hayward,Lafayette,Moraga,Oakland,Orinda, Piedmont, San Pablo, San Leandro, Alamo, Contra Costa, Concord, Danville, PleasantHill,WalnutCreek,NapaandSonomafromJune2022toJune2023. Thismayincludepreliminarydata,andmayvaryfromthetimethedatawas gathered All data is deemed reliable but not guaranteed DRE# 02029039
CopyrightKWAdvisorsEastBay2023 Eachofficeisindependentlyownedand operated

19 New Listings
CONDO Condo & Townhomes
0.8 Months of Inventory $711K Median Sale Price 101.3% Median Sale vs List 23 Avg Days on Market 9 Sold Listings
JUNE2022-JUNE2023
Single-Family Homes
Last 12 months, year-over-year.
Condos & Townhomes
Last 12 months, year-over-year.

Jun2022 Jul2022 Aug2022 Sep2022 Oct2022 Nov2022 Dec2022 Jan2023 Feb2023 Mar2023 Apr2023 May2023 Jun2023 125 100 75 50 25 0 Jun2022 Jul2022 Aug2022 Sep2022 Oct2022 Nov2022 Dec2022 Jan2023 Feb2023 Mar2023 Apr2023 May2023 Jun2023 50 40 30 20 10 0
PleasantHill
LISTINGS FOR SALE SOLD LISTINGS
Median SalesPrice
Single-FamilyHomes
Themediansalesprice hasdecreasedfrom$1.2m lastJune2022,to$11mas ofJune2023
Condos&Townhomes
Themediansalesprice hasincreasedfrom$700k lastJune2022,to$711kas ofJune2023.
AVGDays OntheMarket
Single-FamilyHomes
Theaveragetimespent onthemarketwentup from17dayslastJune 2022,to18daysasofJune 2023
Condos&Townhomes
Theaveragetimespent onthemarketwentup from22daysinJune2022, to23daysasofJune 2023.
Overbids
Single-FamilyHomes
Theoverbidpercentage hasdecreasedfrom 108.2%lastJune2022,to 103.8%ayearlater.
Condos&Townhomes
Theoverbidpercentage hasdecreasedfrom 104.2%lastJune2022,to 101.3%ayearlater.
Jun2022 Jul2022Aug2022Sep2022Oct2022Nov2022Dec2022Jan2023Feb2023Mar2023Apr2023May2023Jun2023 $1,250,000 $1,000,000 $750,000 $500,000 $250,000 $0 Jun2022 Jul2022Aug2022Sep2022Oct2022Nov2022Dec2022 Jan2023Feb2023Mar2023Apr2023May2023 Jun2023 60 40 20 0 Jun2022 Jul2022Aug2022Sep2022Oct2022Nov2022Dec2022 Jan2023Feb2023Mar2023Apr2023May2023 Jun2023 125% 100% 75% 50% 25% 0%
BacktoTableofContents

SanPablo
CONTRA COSTA COUNTY
What's in the Alamo data?
Therewere33single-familyhomesforsale, providing1.4monthsofinventory.Therewere 23newlistingsand7homessoldata medianpriceof$640k.Themedianoverbid percentagewas103.9%,withanaverageof 26daysonthemarket.
Therewere7condoandtownhomeunitsfor sale,providing0.2monthsofinventory. Therewere7newlistings,and1unitsoldata medianpriceof$507k.Themedianoverbid percentagewas101.8%,withanaverageof14 daysonthemarket.
mes
7 d Listings
640K ian Sale Price
6 Days on Market
des all single-family homes, rkeley,CastroValley,ElCerrito, ette,Moraga,Oakland,Orinda, ntra Costa, Concord, Danville, fromJune2022toJune2023.
ryfromthetimethedatawas guaranteed DRE# 02029039 eisindependentlyownedand

7 New Listings 0.2 Months of Inventory $507K Median Sale Price 101.8% Median Sale vs List 14 Avg Days on Market 1 Sold Listings CONDO Condo & Townhomes
JUNE2022-JUNE2023
Single-Family Homes
Last 12 months, year-over-year.
Condos & Townhomes
Last 12 months, year-over-year.

Jun2022 Jul2022 Aug2022 Sep2022 Oct2022 Nov2022 Dec2022 Jan2023 Feb2023 Mar2023 Apr2023 May2023 Jun2023 75 50 25 0 Jun2022 Jul2022 Aug2022 Sep2022 Oct2022 Nov2022 Dec2022 Jan2023 Feb2023 Mar2023 Apr2023 May2023 Jun2023 25 20 15 10 5 0
SanPablo
LISTINGS FOR SALE SOLD LISTINGS
Median SalesPrice
Single-FamilyHomes
Themediansalesprice hasdecreasedfrom$662k lastJune2022,to$640kas ofJune2023
Condos&Townhomes
Themediansalesprice hasincreasedfrom$417k lastJune2022,to$507kas ofJune2023.
AVGDays OntheMarket
Single-FamilyHomes
Theaveragetimespent onthemarketwentup from18dayslastJune 2022,to26daysasof June2023
Condos&Townhomes
Theaveragetimespent onthemarketwentup from13daysinJune2022, to14daysasofJune2023
Overbids
Single-FamilyHomes
Theoverbidpercentage hasdecreasedfrom 106.7%lastJune2022,to 103.9%ayearlater.
Condos&Townhomes
Theoverbidpercentage hasdecreasedfrom 108.2%lastJune2022,to 101.8%ayearlater.
Jun2022 Jul2022Aug2022Sep2022Oct2022Nov2022Dec2022Jan2023Feb2023Mar2023Apr2023May2023Jun2023 $750,000 $500,000 $250,000 $0 Jun2022 Jul2022Aug2022Sep2022Oct2022Nov2022Dec2022 Jan2023Feb2023Mar2023Apr2023May2023 Jun2023 200 150 100 50 0 Jun2022 Jul2022Aug2022Sep2022Oct2022Nov2022Dec2022 Jan2023Feb2023Mar2023Apr2023May2023 Jun2023 125% 100% 75% 50% 25% 0%
BacktoTableofContents
WalnutCreek
CONTRA COSTA COUNTY
What's in the Walnut Creek data?
Therewere86single-familyhomesforsale, providing0.7monthsofinventory.There were86newlistings,and47homessoldata medianpriceof$1.5m.Themedianoverbid percentagewas103.1%,withanaverageof15 daysonthemarket.
Therewere179condoandtownhomeunits forsale,providing0.9monthsofinventory. Therewere179newlistingsand77unitssold atamedianpriceof$645k.Themedian overbidpercentagewas99.9%,withan averageof27daysonthemarket.

SFH Single-Family Homes

86 New Listings
47 Sold Listings
0.7 Months of Inventory
$1.5M Median Sale Price
103.1% Median Sale vs List
15 Avg Days on Market
The data, sourced from Broker Metrics, includes all single-family homes, condosandtownhomesinAlameda,Albany,Berkeley,CastroValley,ElCerrito, ElSobrante,Emeryville,Fremont,Hayward,Lafayette,Moraga,Oakland,Orinda, Piedmont, San Pablo, San Leandro, Alamo, Contra Costa, Concord, Danville, PleasantHill,WalnutCreek,NapaandSonomafromJune2022toJune2023. Thismayincludepreliminarydata,andmayvaryfromthetimethedatawas gathered All data is deemed reliable but not guaranteed DRE# 02029039
CopyrightKWAdvisorsEastBay2023 Eachofficeisindependentlyownedand operated

New Listings
Months of Inventory
Median Sale Price 99.9% Median Sale vs List 27 Avg Days on Market
Sold Listings CONDO Condo & Townhomes
179
0.9
$645K
77
JUNE2022-JUNE2023
Single-Family Homes

Last 12 months, year-over-year.
Condos & Townhomes
Last 12 months, year-over-year.
Jun2022 Jul2022 Aug2022 Sep2022 Oct2022 Nov2022 Dec2022 Jan2023 Feb2023 Mar2023 Apr2023 May2023 Jun2023 250 200 150 100 50 0 Jun2022 Jul2022 Aug2022 Sep2022 Oct2022 Nov2022 Dec2022 Jan2023 Feb2023 Mar2023 Apr2023 May2023 Jun2023 400 300 200 100 0 WalnutCreek
LISTINGS FOR SALE SOLD LISTINGS
Median SalesPrice
Single-FamilyHomes
Themediansalesprice hasdecreasedfrom $158mlastJune2022,to $156masofJune2023
Condos&Townhomes
Themediansalesprice hasincreasedfrom$587k lastJune2022,to$645k asofJune2023.
AVGDays OntheMarket
Single-FamilyHomes
Theaveragetimespent onthemarkethas remainedat15dayslast sinceJune2022
Condos&Townhomes
Theaveragetimespent onthemarketwentup from16daysinJune2022, to27daysasofJune 2023
Overbids
Single-FamilyHomes
Theoverbidpercentage hasdecreasedfrom 107.5%lastJune2022,to 103.1%ayearlater.
Condos&Townhomes
Theoverbidpercentage hasdecreasedfrom 108.4%lastJune2022,to 99.9%ayearlater.
Jun2022 Jul2022Aug2022Sep2022Oct2022Nov2022Dec2022Jan2023Feb2023Mar2023Apr2023May2023Jun2023 $2,000,000 $1,500,000 $1,000,000 $500,000 $0 Jun2022 Jul2022Aug2022Sep2022Oct2022Nov2022Dec2022 Jan2023Feb2023Mar2023Apr2023May2023 Jun2023 40 30 20 10 0 Jun2022 Jul2022Aug2022Sep2022Oct2022Nov2022Dec2022 Jan2023Feb2023Mar2023Apr2023May2023 Jun2023 125% 100% 75% 50% 25% 0%
BacktoTableofContents

Napa ALAMEDA COUNTY
What's in the Napa data?

Therewere17single-familyhomesforsale, providing2.5monthsofinventory.There were5newlistingsand6homessoldata medianpriceof$965k.Themedianoverbid percentagewas98.7%,withanaverageof 24daysonthemarket.
Therewas1condoandtownhomeunitfor sale,providing0monthsofinventory.There were0newlistingsand0unitssoldata medianpriceof$0.Themedianoverbid percentagewas0%,withanaverageof0 daysonthemarket.
SFH Single-Family Homes
5 New Listings

6 Sold Listings
2.5 Months of Inventory
$965K Median Sale Price
98.7% Median Sale vs List
24 Avg Days on Market
The data, sourced from Broker Metrics, includes all single-family homes, condosandtownhomesinAlameda,Albany,Berkeley,CastroValley,ElCerrito, ElSobrante,Emeryville,Fremont,Hayward,Lafayette,Moraga,Oakland,Orinda, Piedmont, San Pablo, San Leandro, Alamo, Contra Costa, Concord, Danville, PleasantHill,WalnutCreek,NapaandSonomafromJune2022toJune2023. Thismayincludepreliminarydata,andmayvaryfromthetimethedatawas gathered All data is deemed reliable but not guaranteed DRE# 02029039
CopyrightKWAdvisorsEastBay2023 Eachofficeisindependentlyownedand operated
CONDO

Condo & Townhomes
No data for this month.
JUNE2022-JUNE2023
Single-Family Homes
Last 12 months, year-over-year.
Condos & Townhomes
Last 12 months, year-over-year.

Jun2022 Jul2022 Aug2022 Sep2022 Oct2022 Nov2022 Dec2022 Jan2023 Feb2023 Mar2023 Apr2023 May2023 Jun2023 25 20 15 10 5 0 Jun2022 Jul2022 Aug2022 Sep2022 Oct2022 Nov2022 Dec2022 Jan2023 Feb2023 Mar2023 Apr2023 May2023 Jun2023 2 15 1 05 0
Napa
LISTINGS FOR SALE SOLD LISTINGS
Median SalesPrice
Single-FamilyHomes
Themediansalesprice hasincreasedfrom$647k lastJune2022,to$965kas ofJune2023
Condos&Townhomes
Therewasnodataforcondo andtownhouseunitsthis month.
AVGDays OntheMarket
Single-FamilyHomes
Theaveragetimespent onthemarketwentup from0dayslastJune 2022,to24daysasof June2023
Condos&Townhomes
Therewasnodatafor condoandtownhouse unitsthismonth.
Overbids
Single-FamilyHomes
Theoverbidpercentage hasincreasedfrom91.4% lastJune2022,to98.7%a yearlater.
Condos&Townhomes
Therewasnodatafor condoandtownhouse unitsthismonth.
Jun2022 Jul2022Aug2022Sep2022Oct2022Nov2022Dec2022Jan2023Feb2023Mar2023Apr2023May2023Jun2023 $2,000,000 $1,500,000 $1,000,000 $500,000 $0 Jun2022 Jul2022Aug2022Sep2022Oct2022Nov2022Dec2022 Jan2023Feb2023Mar2023Apr2023May2023 Jun2023 100 75 50 25 0 Jun2022 Jul2022Aug2022Sep2022Oct2022Nov2022Dec2022 Jan2023Feb2023Mar2023Apr2023May2023 Jun2023 125% 100% 75% 50% 25% 0%
BacktoTableofContents

Sonoma ALAMEDA
COUNTY
What's in the Sonoma data?
Therewas1condoandtownhomeunitfor sale,providing0monthsofinventory.There were0newlistings,and0unitssoldata mediansalepriceof$0.Themedianoverbid percentagewas0%,withanaverageof0 daysonthemarket.
Therewasnodataforthismonthforsinglefamilyhomes.

mily Homes

No data for this month.
Broker Metrics, includes all single-family homes, Alameda,Albany,Berkeley,CastroValley,ElCerrito, mont,Hayward,Lafayette,Moraga,Oakland,Orinda, Leandro, Alamo, Contra Costa, Concord, Danville, NapaandSonomafromJune2022toJune2023. rydata,andmayvaryfromthetimethedatawas med reliable but not guaranteed DRE# 02029039 Bay2023 Eachofficeisindependentlyownedand
CONDO

Condo & Townhomes
No data for this month.
JUNE2022-JUNE2023
Single-Family Homes

Last 12 months, year-over-year.
Condos & Townhomes
Last 12 months, year-over-year.
Jun2022 Jul2022 Aug2022 Sep2022 Oct2022 Nov2022 Dec2022 Jan2023 Feb2023 Mar2023 Apr2023 May2023 Jun2023 5 4 3 2 1 0 Jun2022 Jul2022 Aug2022 Sep2022 Oct2022 Nov2022 Dec2022 Jan2023 Feb2023 Mar2023 Apr2023 May2023 Jun2023 1 075 05 025 0 Sonoma
LISTINGS FOR SALE SOLD LISTINGS
Median SalesPrice
Single-FamilyHomes
Themediansalesprice hasdecreasedfrom $899klastJune2022,to $0asofJune2023
Condos&Townhomes
Therewasnodatafor condoandtownhouse unitsthismonth.
AVGDays OntheMarket
Single-FamilyHomes
Theaveragedayson marketwentdownfrom 48dayslastJune2022,to 0daysasofJune2023
Condos&Townhomes
Therewasnodatafor condoandtownhouse unitsthismonth.
Overbids
Single-FamilyHomes
Theoverbidpercentage hasdecreasedfrom94.6% lastJune2022,to0%a yearlater.
Condos&Townhomes
Therewasnodatafor condoandtownhouse unitsthismonth.
Jun2022 Jul2022Aug2022Sep2022Oct2022Nov2022Dec2022Jan2023Feb2023Mar2023Apr2023May2023Jun2023 $1,000,000 $750,000 $500,000 $250,000 $0 Jun2022 Jul2022Aug2022Sep2022Oct2022Nov2022Dec2022 Jan2023Feb2023Mar2023Apr2023May2023 Jun2023 50 40 30 20 10 0 Jun2022 Jul2022Aug2022Sep2022Oct2022Nov2022Dec2022 Jan2023Feb2023Mar2023Apr2023May2023 Jun2023 125% 100% 75% 50% 25% 0%
BacktoTableofContents

2437SantaClaraAve,Alameda,CA94609 KellerWilliamsAlameda 20273PatioDrive,CastroValley,CA94546 KellerWilliamsCastroValley 4937TelegraphAve.SuiteAOakland,CA94609 KellerWilliamsEastBay :


 ALAMEDA


