


April 2023 Copyright by KW Advisors 2023
Palo Alto area
Palo Alto
Jump to Palo Alto Report
Redwood City
Jump to Redwood City Report
Portola Valley
Jump to Portola Valley Report
Menlo Park
Jump to Menlo Report
Atherton
Jump to Atherton Report
Los Altos
Jump to Los Altos Report
San Jose
Jump to San Jose Report
Mountain View
Jump to Mountain View
San Mateo County
Jump to San Mateo County
Santa Clara County
Jump to Santa Clara County
Monterey County
Jump to Monterey County Report
Santa Cruz County
Jump to Santa Cruz County Report
East Palo Alto
Jump to East Palo Alto Report
Sunnyvale

Jump to Sunnyvale Report
Santa Clara City
Jump to Santa Clara City Report
Saratoga
Jump to Saratoga Report
What’syourhome reallyworthintoday’s market?
That's really the question you should be asking yourself.
Our market is incredibly diverse, and rapidly changing. Values vary not just by neighborhood, but by street. Your home isn't necessarily worth what your neighbors’ home is. At the end of the day, it’s the current market that sets the value of your home.
So, do you know what your home is worth in today's market?
Icanhelp...
Contact me for a confidential, no obligation assessment of your home's value.
HowChangingMortgage RatesCanAffectYou
The 30-year fixed mortgage rate has been bouncing between 6% and 7% this year. If you’ve been on the fence about whether to buy a home or not, it’s helpful to know exactly how a 1%, or even a 0.5%, mortgage rate shift affects your purchasing power.

The chart below helps show the general relationship between mortgage rates and a typical monthly mortgage payment:
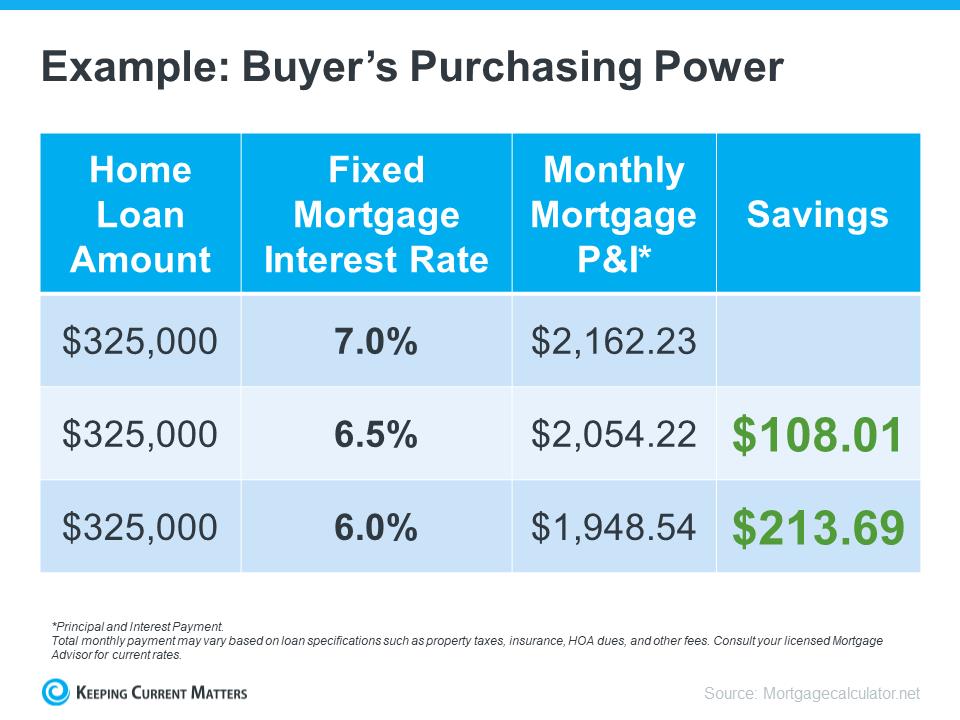
Even a 0.5% change can have a big impact on your monthly payment. And since rates have been moving between 6% and 7% for a while now, you can see how it impacts your purchasing power as rates go down.
What This Means for You
You may be tempted to put your homebuying plans on hold in hopes that rates will fall. But that can be risky. No one knows for sure where rates will go from here, and trying to time them for your benefit is tough Lisa Sturtevant, Housing Economist at Bright MLS, explains:
“It is typically a fool’s errand for a homebuyer to try to time rates in this market . . . But volatility in mortgage rates right now can have a real impact on buyers’ monthly payments.”
That’s why it’s critical to lean on your expert real estate advisors to explore your mortgage options, understand what impacts mortgage rates, and plan your homebuying budget around today’s volatility. They’ll also be able to offer advice tailored to your specific situation and goals, so you have what you need to make an informed decision.
Bottom Line
Your ability to buy a home could be impacted by changing mortgage rates. If you’re thinking about making a move, partner with a trusted real estate agent and lender so you have a strong plan in place.
Source: Keeping Current Matters

PaloAlto
What's in the Palo Alto data?
Currently, there are 87 single-family homes for sale, which is providing the market with 1.6 months of inventory. There were 44 new listings, and 33 homes were sold with a median sale price of $3.4m. The median overbid was 99.8%, and the average time spent on the market was 19 days.
There are currently 26 condo and townhome units for sale, providing the market with 1 8 months of inventory. There were 13 new listings for sale, and 8 condos were sold with a median sale price of $1.4m. The median overbid was 100%, and the average time on the market was 38 days.

SFH Single-Family Homes
44 New Listings
33 Sold Listings
1.6 Months of Inventory
$3.4M Median Sale Price
99.8% Median Sale vs List
19 Avg Days on Market
This data was sourced from Broker Metrics on April 3rd, 2023 and includes all singlefamily homes, condos, and townhomes in the California Area above from March 2022 to March 2023. This may include preliminary data, and vary from the time the data was gathered. All data is deemed reliable but not guaranteed. Questions may be directed to KW Advisors. 415.483.9285. Palo Alto | DRE# 01511642 Copyright KW Advisors 2023. Each Office is independently owned and operated.

oAlto 2022 June2022 July2022August2022September2022October2022November2022December2022January2023February2023 March2023 y2022 June2022 July2022August2022September2022October2022November2022December2022January2023February2023 March2023 MARCH 2022 - MARCH 2023 ly Homes nths, year-over-year. ownhomes nths, year-over-year S FOR SALE SOLD LISTINGS
Median SalesPrice
Single-Family Homes
The median sales price has decreased from $4 3m last March 2022, to $3 4m as of March 2023
Condos & Townhomes
The median sales price has decreased from $1.9m last March 2022, to $1.4m as of March 2023.
Overbids
Single-Family Homes
The overbid percentage has decreased from 109 3% last March 2022, to 99 8% a year later
Condos & Townhomes
The overbid percentage has decreased from 111.2% last March 2022, to 100% a year later.
Single-Family Homes
The average days on market went up from 12 days last March 2022, to 19 days as of March 2023
Condos
The average days on market went up from 15 days in March 2022, to 38 days as of March 2023
Back to Table of Contents March2022April2022May2022June2022July2022August2022September2022October2022November2022December2022January2023February2023March2023 $5,000,000 $4,000,000 $3,000,000 $2,000,000 $1,000,000 $0 March2022April2022May2022June2022 July2022August2022September2022October2022November2022December2022January2023February2023March2023 150 100 50 0 March2022April2022May2022June2022 July2022August2022September2022October2022November2022December2022January2023February2023March2023 125% 100% 75% 50% 25% 0%
AVGDays OntheMarket
& Townhomes

Redwood City
What's in the Redwood City data?
Currently, there are 65 single-family homes for sale, which is providing the market with 1 month of inventory. There were 34 new listings, and 26 homes were sold with a median sale price of $1 8m The median overbid was 99 2%, and the average time spent on the market was 19 days.
There are currently 26 condo and townhome units for sale, providing the market with 1.8 months of inventory. There were 6 new listings for sale, and 10 condos were sold with a median sale price of $1.4m. The median overbid was 101.8%, and the average time on the market was 11 days

oodCity y2022August2022September2022October2022November2022December2022January2023February2023 March2023 y2022August2022September2022October2022November2022December2022January2023February2023 March2023 MARCH 2022 - MARCH 2023 s r-over-year. es r-over-year
LISTINGS
ALE SOLD
Median SalesPrice
Single-Family Homes
The median sales price has decreased from $2 6m last March 2022, to $1 8m as of March 2023
Condos & Townhomes
The median sales price has increased from $970k last March 2022, to $1.4m as of March 2023.
Overbids
Single-Family Homes
The overbid percentage has decreased from 118% last March 2022, to 99 2% a year later
Condos & Townhomes
The overbid percentage has decreased from 109.3% last March 2022, to 101.8% a year later.
Single-Family Homes
The average days on market went up from 9 days last March 2022, to 19 days as of March 2023
Condos & Townhomes
The average days on market went down from 26 days in March 2022, to 11 days as of March 2023
Back to Table of Contents March2022April2022May2022June2022July2022August2022September2022October2022November2022December2022January2023February2023March2023 $3,000,000 $2,000,000 $1,000,000 $0 March2022April2022May2022June2022 July2022August2022September2022October2022November2022December2022January2023February2023March2023 60 40 20 0 March2022April2022May2022June2022 July2022August2022September2022October2022November2022December2022January2023February2023March2023 125% 100% 75% 50% 25% 0%
AVGDays OntheMarket

Portola Valley
What's in the Portola V data?
Currently, there are 13 single-family h sale, which is providing the market w months of inventory. There were 5 n and 4 homes were sold with a media of $3 7m The median overbid was 9 average time spent on the market wa
There are currently no condos for sa new listings, or condo sales reported January.


$3.7M edian Sale Price 4 Sold Listings mes April 3rd, 2023 and includes all singlelifornia Area above from March 2022 to and vary from the time the data was guaranteed. Questions may be directed to 01511642 Copyright KW Advisors 2023. 32 g Days on Market
LISTINGS
Last 12 months, year-over-year.
Condos & Townhomes
March2022 April2022 May2022 June2022 July2022August2022September2022October2022November2022December2022January2023February2023 March2023 40 30 20 10 0 100 75 50 25 0
2022 - MARCH 2023
PortolaValley
MARCH
Single-Family Homes
Last 12 months, year-over-year FOR SALE SOLD LISTINGS
Median SalesPrice
Single-Family Homes
The median sales price has decreased from $4 6m last March 2022, to $3 7m as of March 2023
Condos
No data for this month.
Overbids
Single-Family Homes
The overbid percentage has decreased from 108 8% last March 2022, to 94 4% a year later
Condos & Townhomes
No data for this month.
AVGDays OntheMarket
The average days on market went up from 13 days last March 2022, to 32 days as of March 2023
Condos
No data for this month
Back to Table of Contents March2022April2022May2022June2022July2022August2022September2022October2022November2022December2022January2023February2023March2023 $7,500,000 $5,000,000 $2,500,000 $0 March2022April2022May2022June2022 July2022August2022September2022October2022November2022December2022January2023February2023March2023 150 100 50 0 March2022April2022May2022June2022 July2022August2022September2022October2022November2022December2022January2023February2023March2023 125% 100% 75% 50% 25% 0%
Townhomes
&
& Townhomes
Single-Family Homes

Men
What's in Currently, there sale, which is p months of inve and 18 homes of $3.8m. The average time s There are curre for sale, provid inventory. Ther condos were s $1.4m. The me average time o

omes
18 Sold Listings
$3.8M Median Sale Price
18 Avg Days on Market
Metrics on April 3rd, 2023 and includes all singlethe California Area above from March 2022 to preliminary data, and vary from the time the data was not guaranteed. Questions may be directed to DRE# 01511642 Copyright KW Advisors 2023. Each Office is independently owned and operated.

95 Media
Month
Park st2022September2022October2022November2022December2022January2023February2023 March2023 ust2022September2022October2022November2022December2022January2023February2023 March2023 MARCH 2022 - MARCH 2023 er-year. y er-year E SOLD LISTINGS
Median SalesPrice
Single-Family Homes
The median sales price has increased from $3 3m last March 2022, to $3 8m as of March 2023
Condos &
The median sales price has increased from $1.2m last March 2022, to $1.4m as of March 2023.
Overbids
Single-Family Homes
The overbid percentage has decreased from 109 4% last March 2022, to 97 6% a year later
Condos & Townhomes
The overbid percentage has decreased from 102.1% last March 2022, to 95.5% a year later.
Single-Family Homes
The average days on market went up from 12 days last March 2022, to 18 days as of March 2023
The average days on market went up from 14 days in March 2022, to 173 days as of March 2023
Back to Table of Contents March2022April2022May2022June2022July2022August2022September2022October2022November2022December2022January2023February2023March2023 $5,000,000 $4,000,000 $3,000,000 $2,000,000 $1,000,000 $0 March2022April2022May2022June2022 July2022August2022September2022October2022November2022December2022January2023February2023March2023 200 150 100 50 0 March2022April2022May2022June2022 July2022August2022September2022October2022November2022December2022January2023February2023March2023 125% 100% 75% 50% 25% 0%
Townhomes
AVGDays OntheMarket
Condos & Townhomes
Athert
What's in the Ath
Currently, there are 28 sin sale, which is providing th months of inventory. Ther and 4 homes were sold w of $6.2m. The median ove average time spent on the There are currently no con new listings, or condo sale January.

No data for this month
STINGS FOR SALE SOLD
12
12 months,
therton April2022 May2022 June2022 July2022August2022September2022October2022November2022December2022January2023February2023 March2023
2022 - MARCH 2023
MARCH
e-Family Homes
year-over-year.
months,
os & Townhomes
year-over-year
LISTINGS
Median SalesPrice
Single-Family
The median sales price has decreased from $16 8m last March 2022, to $6 2m as of March 2023
No data for
Overbids
Single-Family Homes
The overbid percentage has decreased from 104 9% last March 2022, to 89 6% a year later
Condos & Townhomes
No data for this month.
Single-Family
The average days on market went up from 12 days last March 2022, to 35 days as of March 2023
No data for this month
Back to Table of Contents March2022April2022May2022June2022July2022August2022September2022October2022November2022December2022January2023February2023March2023 $20,000,000 $15,000,000 $10,000,000 $5,000,000 $0 March2022April2022May2022June2022 July2022August2022September2022October2022November2022December2022January2023February2023March2023 100 75 50 25 0 March2022April2022May2022June2022 July2022August2022September2022October2022November2022December2022January2023February2023March2023 125% 100% 75% 50% 25% 0%
& Townhomes
Condos
this month.
Homes
& Townhomes
AVGDays OntheMarket Condos
Homes

LosAltos
What's in the Los Altos data?
Currently, there are 37 single-family homes for sale, which is providing the market with 1.1 months of inventory. There were 24 new listings, and 19 homes were sold with a median sale price of $4m. The median overbid was 98.7%, and the average time spent on the market was 14 days.
There are currently 13 condo and townhome units for sale, providing the market with 0 months of inventory. There were 6 new listings for sale, and condos were sold with a median sale price of $1.8m. The median overbid was 98.7%, and the average time on the market was 7 days.

SFH ingle-Family Homes
24 w Listings
19 Sold Listings
1.1 onths of Inventory
$4M Median Sale Price
98.7% edian Sale vs List
14 Avg Days on Market
This data was sourced from Broker Metrics on April 3rd, 2023 and includes all singlefamily homes, condos, and townhomes in the California Area above from March 2022 to March 2023. This may include preliminary data, and vary from the time the data was gathered. All data is deemed reliable but not guaranteed. Questions may be directed to Advisors. 415.483.9285. Palo Alto | DRE# 01511642 Copyright KW Advisors 2023. Each Office is independently owned and operated.
CONDO
Condo & Townhomes
6 New Listings

3 Sold Listings
0 Months of Inventory
$1.8M Median Sale Price
98.7% Median Sale vs List
7 Avg Days on Market
Single-Family Homes
Last 12 months, year-over-year.
Condos & Townhomes
Last 12 months, year-over-year
LosAltos March2022 April2022 May2022 June2022 July2022 August2022September2022October2022November2022December2022 January2023February2023 125 100 75 50 25 0 March2022 April2022 May2022 June2022 July2022August2022September2022October2022November2022December2022January2023February2023 March2023 25 20 15 10 5 0 MARCH 2022 - MARCH 2023
LISTINGS FOR SALE SOLD LISTINGS
Median SalesPrice
Single-Family Homes
The median sales price has decreased from $4 5m last March 2022, to $4m as of March 2023
Condos &
The median sales price has increased from $1.2m last March 2022, to $1.8m as of March 2023.
Overbids
Single-Family Homes
The overbid percentage has decreased from 117 3% last March 2022, to 98 7% a year later
Condos & Townhomes
The overbid percentage has decreased from 110% last March 2022, to 98.7% a year later.
Single-Family Homes
The average days on market went up from 8 days last March 2022, to 14 days as of March 2023
The average days on market went down from 16 days in March 2022, to 7 days as of March 2023
Back to Table of Contents March2022April2022May2022June2022July2022August2022September2022October2022November2022December2022January2023February2023March2023 $5,000,000 $4,000,000 $3,000,000 $2,000,000 $1,000,000 $0 March2022April2022May2022June2022 July2022August2022September2022October2022November2022December2022January2023February2023March2023 200 150 100 50 0 March2022April2022May2022June2022 July2022August2022September2022October2022November2022December2022January2023February2023March2023 125% 100% 75% 50% 25% 0%
Townhomes
AVGDays OntheMarket
Condos & Townhomes

SanJos
What's in the San
Currently, there are 616 sing sale, which is providing the months of inventory. There and 317 homes were sold w price of $1.5m. The median and the average time spent days.
There are currently 286 con units for sale, providing the months of inventory. There for sale, and 132 condos we sale price of $819k. The me 100.4%, and the average tim 27 days.

CONDO
Condo & Townhomes
173 New Listings
132 Sold Listings
0.8 Months of Inventory
$819K Median Sale Price

100.4% Median Sale vs List
27 Avg Days on Market
Last
Last 12 months,
SanJose March2022 April2022 May2022 June2022 July2022August2022September2022October2022November2022December2022January2023February2023 March2023 2000 1500 1000 500 0 March2022 April2022 May2022 June2022 July2022August2022September2022October2022November2022December2022January2023February2023 March2023 750 500 250 0 MARCH 2022 - MARCH 2023 Single-Family Homes
12 months, year-over-year.
& Townhomes
Condos
LISTINGS FOR SALE SOLD LISTINGS
year-over-year
Median SalesPrice
Single-Family Homes
The median sales price has decreased from $1 7m last March 2022, to $1 5m as of March 2023
Condos & Townhomes
The median sales price has decreased from $906k last March 2022, to $819k as of March 2023
Overbids
Single-Family Homes
The overbid percentage has decreased from 118 1% last March 2022, to 99 2% a year later
Condos & Townhomes
The overbid percentage has decreased from 112.5% last March 2022, to 100.4% a year later.
Single-Family Homes
The average days on market went up from 10 days last March 2022, to 19 days as of March 2023.
Condos & Townhomes
The average days on market went up from 11 days in March 2022, to 27 days as of March 2023
Back to Table of Contents March2022April2022May2022June2022July2022August2022September2022October2022November2022December2022January2023February2023March2023 $2,000,000 $1,500,000 $1,000,000 $500,000 $0 March2022April2022May2022June2022 July2022August2022September2022October2022November2022December2022January2023February2023March2023 50 40 30 20 10 0 March2022April2022May2022June2022 July2022August2022September2022October2022November2022December2022January2023February2023March2023 125% 100% 75% 50% 25% 0%
AVGDays OntheMarket

M Vi
Wha data Current sale, w months and 8 h of $2 7 the ave days. There a for sale invento 19 con $1 3m average

Mce includes all singleMarch 2022 to time the data was may be directed to Advisors 2023.
rket
New Listings
Months of Inventory $1.3M Median Sale Price 100% Median Sale vs List 22 Avg Days on Market
Sold Listings
Condo & Townhomes
24
1.2
19
CONDO
y y
Median SalesPrice
Single-Family Homes
The median sales price has decreased from $3 4m last March 2022, to $2 7m as of March 2023
Condos & Townhomes
The median sales price has remained from $1.3m last March 2022, to $1.3m as of March 2023.
Overbids
Single-Family Homes
The overbid percentage has decreased from 119 6% last March 2022, to 100 7% a year later
Condos & Townhomes
The overbid percentage has decreased from 112.4% last March 2022, to 100% a year later.
Single-Family Homes
The average days on market went up from 11 days last March 2022, to 26 days as of March 2023
Condos
The average days on market went up from 17 days in March 2022, to 22 days as of March 2023
Back to Table of Contents March2022April2022May2022June2022July2022August2022September2022October2022November2022December2022January2023February2023March2023 $4,000,000 $3,000,000 $2,000,000 $1,000,000 $0 March2022April2022May2022June2022 July2022August2022September2022October2022November2022December2022January2023February2023March2023 75 50 25 0 March2022April2022May2022June2022 July2022August2022September2022October2022November2022December2022January2023February2023March2023 125% 100% 75% 50% 25% 0%
AVGDays OntheMarket
& Townhomes

Sa Co
What' data? Currently sale, whic months o and 251 h price of $ and the a days. There are units for months o for sale, a sale price and the a

Mincludes all singleMarch 2022 to the data was directed to Advisors 2023.
et
Last
Last
SanMateo March2022 April2023 May2023 June2022 July2022August2022September2022October2022November2022December2022January2023February2023 March2023 1250 1000 750 500 250 0 March2022 April2023 May2023 June2022 July2022August2022September2022October2022November2022December2022January2023February2023 March2023 400 300 200 100 0 MARCH 2022 - MARCH 2023 Single-Family Homes
12 months, year-over-year.
& Townhomes
Condos
year-over-year LISTINGS FOR SALE SOLD LISTINGS
12 months,
Median SalesPrice
Single-Family Homes
The median sales price has decreased from $2m last March 2022, to $1 7m as of March 2023
The median sales price has increased from $938k last March 2022, to $1m as of March 2023.
Overbids
Single-Family Homes
The overbid percentage has decreased from 114 4% last March 2022, to 100% a year later
Condos & Townhomes
The overbid percentage has decreased from 105.3% last March 2022, to 99.9% a year later.
Single-Family Homes
The average days on market went up from 12 days last March 2022, to 28 days as of March 2023
The average days on market went up from 16 days in March 2022, to 36 days as of March 2023
Back to Table of Contents March2022April2023May2023June2022July2022August2022September2022October2022November2022December2022January2023February2023March2023 $2,500,000 $2,000,000 $1,500,000 $1,000,000 $500,000 $0 March2022April2023May2023June2022 July2022August2022September2022October2022November2022December2022January2023February2023March2023 $60 $40 $20 $0 March2022April2023May2023June2022 July2022August2022September2022October2022November2022December2022January2023February2023March2023 125% 100% 75% 50% 25% 0%
Townhomes
Condos &
AVGDays OntheMarket
Condos & Townhomes

Santa Coun
What's in the S County data?
Currently, there are 61 sale, which is providin of inventory. There we homes were sold with $1 6m The median ov average time spent on There are currently 26 units for sale, providin of inventory. There we and 267 condos were price of $940k. The m and the average time

mily Homes
641 Sold Listings
ory
9% st
$1.6M Median Sale Price
25 Avg Days on Market
from Broker Metrics on April 3rd, 2023 and includes all singletownhomes in the California Area above from March 2022 to include preliminary data, and vary from the time the data was med reliable but not guaranteed. Questions may be directed to 415.483.9285. Palo Alto | DRE# 01511642 Copyright KW Advisors 2023. Each Office is independently owned and operated.
352 New Listings
267 Sold Listings
1 Months of Inventory
$940K Median Sale Price
100% Median Sale vs List
27 Avg Days on Market
CONDO
Condo & Townhomes
, y y
Median SalesPrice
Single-Family Homes
The median sales price has decreased from $1 9m last March 2022, to $1 6m as of March 2023
Condos
The median sales price has decreased from $1m last March 2022, to $940k as of March 2023.
Overbids
Single-Family Homes
The overbid percentage has decreased from 116% last March 2022, to 100 9% a year later
Condos & Townhomes
The overbid percentage has decreased from 110.5% last March 2022, to 100% a year later.
Single-Family Homes
The average days on market went up from 12 days last March 2022, to 25 days as of March 2023
The average days on market went up from 11 days in March 2022, to 27 days as of March 2023
Back to Table of Contents March2022April2023May2023June2022July2022August2022September2022October2022November2022December2022January2023February2023March2023 $2,000,000 $1,500,000 $1,000,000 $500,000 $0 March2022April2023May2023June2022 July2022August2022September2022October2022November2022December2022January2023February2023March2023 $40 $30 $20 $10 $0 March2022April2023May2023June2022 July2022August2022September2022October2022November2022December2022January2023February2023March2023 125% 100% 75% 50% 25% 0%
Townhomes
&
AVGDays OntheMarket
Condos & Townhomes
Monterey County
What's in the Monterey County data?
Currently, there are 438 single-family homes for sale, which is providing the market with 1.7 months of inventory. There were 156 new listings, and 147 homes were sold with a median sale price of $900k The median overbid was 94 1%, and the average time spent on the market was 43 days.
There are currently 63 condo and townhome units for sale, providing the market with 0.9 months of inventory. There were 37 new listings for sale, and 27 condos were sold with a median sale price of $640k The median overbid was 96%, and the average time on the market was 25 days.

SFH ingle-Family Homes
156 w Listings
147 Sold Listings
1.7 onths of Inventory
$900K Median Sale Price
94.1% edian Sale vs List
43 Avg Days on Market
This data was sourced from Broker Metrics on April 3rd, 2023 and includes all singlefamily homes, condos, and townhomes in the California Area above from March 2022 to March 2023. This may include preliminary data, and vary from the time the data was gathered. All data is deemed reliable but not guaranteed. Questions may be directed to Advisors. 415.483.9285. Palo Alto | DRE# 01511642 Copyright KW Advisors 2023. Each Office is independently owned and operated.
37 New Listings
27 Sold Listings
0.9 Months of Inventory
$640K Median Sale Price

96% Median Sale vs List
25 Avg Days on Market
CONDO Condo & Townhomes
Last
Last 12 months,
MontereyCounty March2022 April2022 May2022 June2022 July2022August2022September2022October2022November2022December2022January2023February2023 March2023 1000 750 500 250 0 March2022 April2022 May2022 June2022 July2022August2022September2022October2022November2022December2022January2023February2023 March2023 100 75 50 25 0 MARCH 2022 - MARCH 2023
Homes
Single-Family
12 months, year-over-year.
& Townhomes
Condos
year-over-year LISTINGS FOR SALE SOLD LISTINGS
Median SalesPrice
Single-Family Homes
The median sales price has decreased from $912k last March 2022, to $900k as of March 2023
Condos & Townhomes
The median sales price has decreased from $750 last March 2022, to $640 as of March 2023.
Overbids
Single-Family Homes
The overbid percentage has decreased from 99 4% last March 2022, to 94 1% a year later
Condos & Townhomes
The overbid percentage has decreased from 101.1% last March 2022, to 96% a year later.
Single-Family Homes
The average days on market went up from 17 days last March 2022, to 43 days as of March 2023
Condos & Townhomes
The average days on market went up from 22 days in March 2022, to 25 days as of March 2023
Back to Table of Contents March2022April2022May2022June2022July2022August2022September2022October2022November2022December2022January2023February2023March2023 $1,000,000 $750,000 $500,000 $250,000 $0 March2022April2022May2022June2022 July2022August2022September2022October2022November2022December2022January2023February2023March2023 75 50 25 0 March2022April2022May2022June2022 July2022August2022September2022October2022November2022December2022January2023February2023March2023 125% 100% 75% 50% 25% 0%
AVGDays OntheMarket

SantaCruz County
What's in the Santa Cruz County data?
Currently, there are 279 single-family homes for sale, which is providing the market with 1.9 months of inventory. There were 123 new listings, and 94 homes were sold with a median sale price of $1 2m The median overbid was 96 2%, and the average time spent on the market was 40 days.
There are currently 52 condo and townhome units for sale, providing the market with 1.6 months of inventory. There were 18 new listings for sale, and 20 condos were sold with a median sale price of $880k. The median overbid was 99%, and the average time on the market was 44 days

SFH Single-Family Homes
123 New Listings
94 Sold Listings
1.9 Months of Inventory
$1.2M Median Sale Price
96.2% Median Sale vs List
40 Avg Days on Market
This data was sourced from Broker Metrics on April 3rd, 2023 and includes all singlefamily homes, condos, and townhomes in the California Area above from March 2022 to March 2023. This may include preliminary data, and vary from the time the data was gathered. All data is deemed reliable but not guaranteed. Questions may be directed to KW Advisors. 415.483.9285. Palo Alto | DRE# 01511642 Copyright KW Advisors 2023. Each Office is independently owned and operated.
1.6

18 New Listings
Months of Inventory
Median Sale Price 99% Median Sale vs List
Market
Condo & Townhomes
$880K
44 Avg Days on
20 Sold Listings CONDO
SantaCruzCounty March2022 April2022 May2022 June2022 July2022August2022September2022October2022November2022December2022January2023February2023 March2023 600 400 200 0 March2022 April2022 May2022 June2022 July2022August2022September2022October2022November2022December2022January2023February2023 March2023 150 100 50 0 MARCH 2022 - MARCH 2023 Single-Family Homes
12 months, year-over-year. Condos & Townhomes
12 months, year-over-year LISTINGS FOR SALE SOLD LISTINGS
Last
Last
Median SalesPrice
Single-Family Homes
The median sales price has decreased from $1 6m last March 2022, to $1 2m as of March 2023
Condos & Townhomes
The median sales price has increased from $805k last March 2022, to $880k as of March 2023.
Overbids
Single-Family Homes
The overbid percentage has decreased from 107 4% last March 2022, to 96 2% a year later
Condos & Townhomes
The overbid percentage has decreased from 108.2% last March 2022, to 99% a year later.
Single-Family Homes
The average days on market went up from 14 days last March 2022, to 40 days as of March 2023
Condos
The average days on market went up from 17 days in March 2022, to 44 days as of March 2023
Back to Table of Contents March2022April2022May2022June2022July2022August2022September2022October2022November2022December2022January2023February2023March2023 $2,000,000 $1,500,000 $1,000,000 $500,000 $0 March2022April2022May2022June2022 July2022August2022September2022October2022November2022December2022January2023February2023March2023 75 50 25 0 March2022April2022May2022June2022 July2022August2022September2022October2022November2022December2022January2023February2023March2023 125% 100% 75% 50% 25% 0%
AVGDays OntheMarket
& Townhomes

East PaloAlto

What's in the East Palo Alto data?
Currently, there are 15 single-family homes for sale, which is providing the market with 1.6 months of inventory. There were 7 new listings, and 3 homes were sold with a median sale price of $961k The median overbid was 100 1%, and the average time spent on the market was 12 days.
There are currently 3 condo and townhome units for sale, providing the market with 1 month of inventory. There was 1 new listing for sale, and 1 unit was sold with a median sale price of $455k. The median overbid was 98 9%, and the average time on the market was 6 days.
SFH Single-Family Homes
7 New Listings
3 Sold Listings
1.6 Months of Inventory
$961K Median Sale Price
100.1% Median Sale vs List
12 Avg Days on Market
This data was sourced from Broker Metrics on April 3rd, 2023 and includes all singlefamily homes, condos, and townhomes in the California Area above from March 2022 to March 2023. This may include preliminary data, and vary from the time the data was gathered. All data is deemed reliable but not guaranteed. Questions may be directed to KW Advisors. 415.483.9285. Palo Alto | DRE# 01511642 Copyright KW Advisors 2023. Each Office is independently owned and operated.
CONDO

Condo & Townhomes
1 New Listings
1 Sold Listings
1 Months of Inventory
$455K Median Sale Price
98.9% Median Sale vs List
6 Avg Days on Market
Single-Family Homes
Last 12 months, year-over-year.
Condos & Townhomes
Last 12 months, year-over-year
EastPaloAlto March2022 April2022 May2022 June2022 July2022August2022September2022October2022November2022December2022January2023February2023 March2023 50 40 30 20 10 0 March2022 April2022 May2022 June2022 July2022August2022September2022October2022November2022December2022January2023February2023 March2023 10 75 5 25 0
2023
MARCH 2022 - MARCH
LISTINGS FOR SALE SOLD LISTINGS
Median SalesPrice
Single-Family Homes
The median sales price has decreased from $1m last March 2022, to $961k as of March 2023
Condos & Townhomes
The median sales price has decreased from $792k last March 2022, to $455k as of March 2023.
Overbids
Single-Family Homes
The overbid percentage has decreased from 103 3% last March 2022, to 100 1% a year later
Condos & Townhomes
The overbid percentage has decreased from 105.2% last March 2022, to 98.9% a year later.
Single-Family Homes
The average days on market went up from 6 days last March 2022, to 12 days as of March 2023
Condos & Townhomes
The average days on market went down from 7 days in March 2022, to 6 days as of March 2023
Back to Table of Contents March2022April2022May2022June2022July2022August2022September2022October2022November2022December2022January2023February2023March2023 $1,500,000 $1,000,000 $500,000 $0 March2022April2022May2022June2022 July2022August2022September2022October2022November2022December2022January2023February2023March2023 100 75 50 25 0 March2022April2022May2022June2022 July2022August2022September2022October2022November2022December2022January2023February2023March2023 125% 100% 75% 50% 25% 0%
AVGDays OntheMarket

Sunnyvale
What's in the Sunnyvale data?
Currently, there are 82 single-family homes for sale, which is providing the market with 0.5 months of inventory. There were 50 new listings, and 42 homes were sold with a median sale price of $2.3m. The median overbid was 104.5%, and the average time spent on the market was 17 days.
There are currently 30 condo and townhome units for sale, providing the market with 1 month of inventory. There were 19 new listings for sale, and 13 condos were sold with a median sale price of $1.1m. The median overbid was 102.9%, and the average time on the market was 14 days.

SFH Single-Family Homes
50 New Listings
42 Sold Listings
0.5 Months of Inventory
$2.3M Median Sale Price
104.5% Median Sale vs List
17 Avg Days on Market
This data was sourced from Broker Metrics on April 3rd, 2023 and includes all singlefamily homes, condos, and townhomes in the California Area above from March 2022 to March 2023. This may include preliminary data, and vary from the time the data was gathered. All data is deemed reliable but not guaranteed. Questions may be directed to KW Advisors. 415.483.9285. Palo Alto | DRE# 01511642 Copyright KW Advisors 2023. Each Office is independently owned and operated.
19 New Listings

Sold
1 Months of Inventory $1.1 Median S
102.9% Median Sale vs List Avg Days o
COND Condo & Townh
nnyvale May2022 June2022 July2022August2022September2022October2022November2022December2022January2023February2023 March2023 May2022 June2022 July2022August2022September2022October2022November2022December2022January2023February2023 March2023 MARCH 2022 - MARCH 2023
Homes onths, year-over-year.
onths, year-over-year GS FOR SALE SOLD LISTINGS
mily
Townhomes
Median SalesPrice
Single-Family Homes
The median sales price has decreased from $2 8m last March 2022, to $2 3m as of March 2023
Condos & Townhomes
The median sales price has decreased from $1.4m last March 2022, to $1.1m as of March 2023.
Overbids
Single-Family Homes
The overbid percentage has decreased from 120 7% last March 2022, to 104 5% a year later
Condos & Townhomes
The overbid percentage has decreased from 111.2% last March 2022, to 102.9% a year later.
Single-Family Homes
The average days on market went up from 10 days last March 2022, to 17 days as of March 2023
Condos
The average days on market went up from 10 days in March 2022, to 14 days as of March 2023
Back to Table of Contents March2022April2022May2022June2022July2022August2022September2022October2022November2022December2022January2023February2023March2023 $3,000,000 $2,000,000 $1,000,000 $0 March2022April2022May2022June2022 July2022August2022September2022October2022November2022December2022January2023February2023March2023 40 30 20 10 0 March2022April2022May2022June2022 July2022August2022September2022October2022November2022December2022January2023February2023March2023 125% 100% 75% 50% 25% 0%
AVGDays OntheMarket
& Townhomes

SantaClara City
What's in the Santa Clara City data?
Currently, there are 59 single-family homes for sale, which is providing the market with 0.8 months of inventory. There were 33 new listings, and 28 homes were sold with a median sale price of $1 6m The median overbid was 107 1%, and the average time spent on the market was 14 days.
There are currently 35 condo and townhome units for sale, providing the market with 0.7 months of inventory. There were 18 new listings for sale, and 18 condos were sold with a median sale price of $985k The median overbid was 103 2%, and the average time on the market was 19 days.

SFH Single-Family Homes
33 New Listings
28 Sold Listings
0.8 Months of Inventory
$1.6M Median Sale Price
107.1% Median Sale vs List
14 Avg Days on Market
This data was sourced from Broker Metrics on April 3rd, 2023 and includes all singlefamily homes, condos, and townhomes in the California Area above from March 2022 to March 2023. This may include preliminary data, and vary from the time the data was gathered. All data is deemed reliable but not guaranteed. Questions may be directed to KW Advisors. 415.483.9285. Palo Alto | DRE# 01511642 Copyright KW Advisors 2023. Each Office is independently owned and operated.

18 New Listings 0.7 Months of Inventory $985K Median Sale Price 103.2% Median Sale vs List 19 Avg Days on Market 18 Sold Listings CONDO Condo & Townhomes
Single-Family Homes
Last 12 months, year-over-year.
Condos & Townhomes
Last 12 months, year-over-year
SantaClaraCity March2022 April2022 May2022 June2022 July2022August2022September2022October2022November2022December2022January2023February2023 March2023 00 50 00 50 0 March2022 April2022 May2022 June2022 July2022August2022September2022October2022November2022December2022January2023February2023 March2023 50 00 50 0 MARCH 2022 - MARCH 2023
LISTINGS FOR SALE SOLD LISTINGS
Median SalesPrice
Single-Family Homes
The median sales price has decreased from $1 9m last March 2022, to $1 6m as of March 2023
Condos & Townhomes
The median sales price has increased from $915k last March 2022, to $985k as of March 2023.
Overbids
Single-Family Homes
The overbid percentage has decreased from 122 1% last March 2022, to 107 1% a year later
Condos & Townhomes
The overbid percentage has decreased from 113.5% last March 2022, to 103.2% a year later.
Single-Family Homes
The average days on market went up from 10 days last March 2022, to 14 days as of March 2023
Condos
The average days on market went up from 11 days in March 2022, to 19 days as of March 2023
Back to Table of Contents March2022April2022May2022June2022July2022August2022September2022October2022November2022December2022January2023February2023March2023 $2,000,000 $1,500,000 $1,000,000 $500,000 $0 March2022April2022May2022June2022 July2022August2022September2022October2022November2022December2022January2023February2023March2023 60 40 20 0 March2022April2022May2022June2022 July2022August2022September2022October2022November2022December2022January2023February2023March2023 125% 100% 75% 50% 25% 0%
AVGDays OntheMarket
& Townhomes

Saratoga

What's in the Saratoga data?
Currently, there are 44 single-family homes for sale, which is providing the market with 1.9 months of inventory. There were 17 new listings, and 17 homes were sold with a median sale price of $4.1m. The median overbid was 96.7%, and the average time spent on the market was 26 days.
There are currently 8 condo and townhome units for sale, providing the market with 0 2 months of inventory. There were 5 new listings for sale, and 2 condos were sold with a median sale price of $1.1m. The median overbid was 101.1%, and the average time on the market was 20 days.
SFH Single-Family Homes
17 New Listings
17 Sold Listings
1.9 Months of Inventory
$4.1M Median Sale Price
96.7% Median Sale vs List
26 Avg Days on Market
This data was sourced from Broker Metrics on April 3rd, 2023 and includes all singlefamily homes, condos, and townhomes in the California Area above from March 2022 to March 2023. This may include preliminary data, and vary from the time the data was gathered. All data is deemed reliable but not guaranteed. Questions may be directed to KW Advisors. 415.483.9285. Palo Alto | DRE# 01511642 Copyright KW Advisors 2023. Each Office is independently owned and operated.
101.1% Median Sale vs

New List
0. Months of Inven
C
2022November2022December2022January2023February2023 March2023 2022November2022December2022January2023February2023 March2023 y y OLD LISTINGS
Median SalesPrice
Single-Family Homes
The median sales price has increased from $3 7m last March 2022, to $4 1m as of March 2023
Condos
The median sales price has decreased from $2m last March 2022, to $1.1m as of March 2023.
Overbids
Single-Family Homes
The overbid percentage has decreased from 115 1% last March 2022, to 96 7% a year later
Condos & Townhomes
The overbid percentage has decreased from 112.7% last March 2022, to 101.1% a year later.
Single-Family Homes
The average days on market went up from 11 days last March 2022, to 26 days as of March 2023
The average days on market went up from 16 days in March 2022, to 20 days as of March 2023
Back to Table of Contents March2022April2022May2022June2022July2022August2022September2022October2022November2022December2022January2023February2023March2023 $5,000,000 $4,000,000 $3,000,000 $2,000,000 $1,000,000 $0 March2022April2022May2022June2022 July2022August2022September2022October2022November2022December2022January2023February2023March2023 125 100 75 50 25 0 March2022April2022May2022June2022 July2022August2022September2022October2022November2022December2022January2023February2023March2023 125% 100% 75% 50% 25% 0%
& Townhomes
AVGDays OntheMarket
Condos & Townhomes


505 Hamilton Ave Suite #100, Palo Alto, CA 94301 PaloAlto :