


April 2023 Copyright by KW Advisors 2023
Southern California area
Los Angeles
Jump to Los Angeles Report
Santa Monica
Jump to Santa Monica Report
Brentwood
Jump to Brentwood Report
Marina Del Rey
Jump to Marina Del Rey Report
Pacific Palisades
Jump to Pacific Palisades Report
Culver City
Jump to Culver City Report
Sherman Oaks
Jump to Sherman Oaks Report
Studio City
Jump to Studio City Report
Westlake Village
Jump to Westlake Village Report
Playa Del Rey
Jump to Playa Del Rey Report
Venice
Jump to Venice Report
West Hollywood
Jump to West Hollywood Report
Beverly Hills
Jump to Beverly Hills Report

Riverside County
Jump to Riverside County
Encino
Jump to Encino Report
San Diego County
Jump to San Diego County
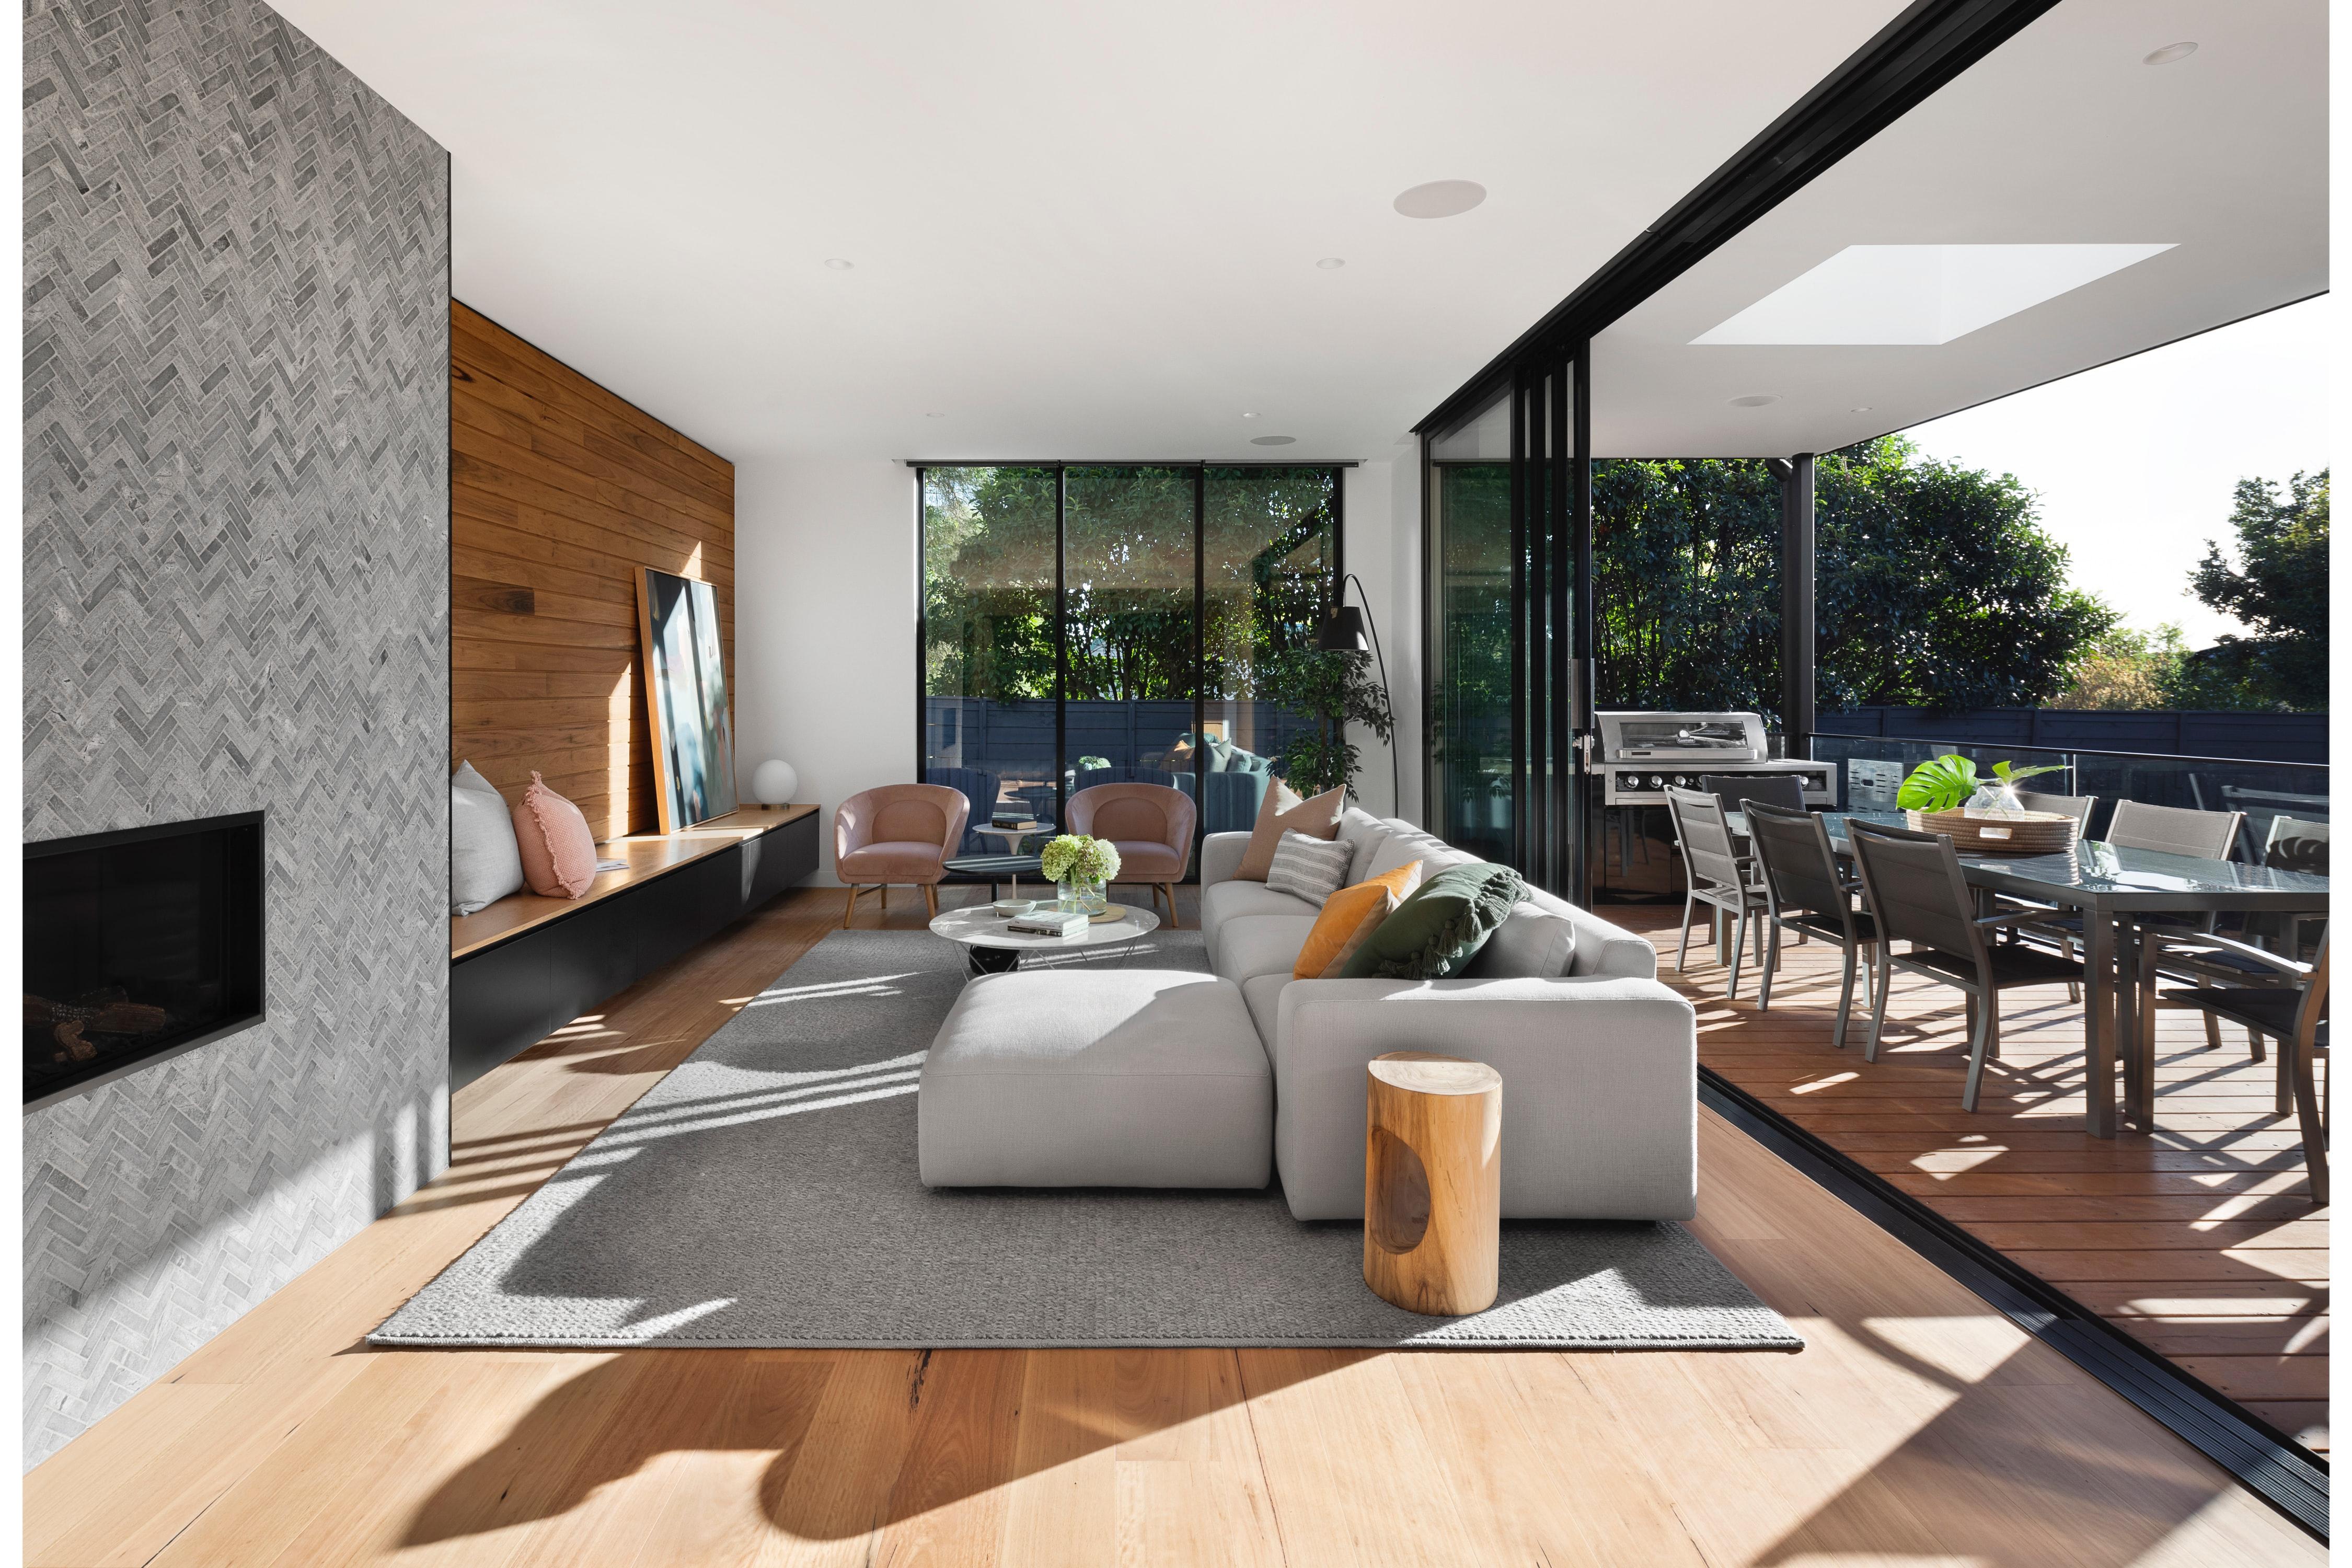
What’syourhome reallyworthin today’smarket?
That's really the question you should be asking yourself.
Our market is incredibly diverse, and rapidly changing. Values vary not just by neighborhood, but by street. Your home isn't necessarily worth what your neighbors’ home is. At the end of the day, it’s the current market that sets the value of your home.
So, do you know what your home is worth in today's market?
Contact me for a confidential, no obligation assessment of your home's value.
Icanhelp...
HowChangingMortgage RatesCanAffectYou
The 30-year fixed mortgage rate has been bouncing between 6% and 7% this year. If you’ve been on the fence about whether to buy a home or not, it’s helpful to know exactly how a 1%, or even a 0.5%, mortgage rate shift affects your purchasing power.

LosAngele
What's in the Los Angeles da
Currently, there are 11,541 single-family hom sale, providing 2.1 months of inventory. Ther were 3,509 new listings, and 3,004 homes so a median sale price of $885k. The median ov percentage was 95.7%, with an average of 38 on the market.
There are currently 3,816 condo and townho units for sale, providing 1 9 months of invent There were 1,009 new listings, and 1,233 uni sold at a median sale price of $671k. The me overbid percentage was 97.3%, with an avera 39 days on the market.

He-Family Homes
09 ngs
3,004 Sold Listings
1 f Inventory
$885K Median Sale Price
.7% ale vs List
38 Avg Days on Market
urced from Broker Metrics on April 3rd, includes all single-family homes, townhomes in the California Area from March 2022 to March 2023. This preliminary data, and vary from the time the data was gathered. All data is able but not guaranteed. Questions may be directed to Keller Williams 01499010. Copyright Keller Williams Santa Monica | Brentwood | Marina Del Rey | Pacific Palisades 2023. Each Office is independently owned and operated.
1,233
1,009
1.9

New Listings
Months of Inventory
Median Sale Price 97.3% Median Sale vs List 39 Avg Days on Market
$671K
Condo & Townhomes
Sold Listings CONDO
Last
Last
March2022 April2022 May2022 June2022 July2022August2022September2022October2022November2022December2022January2023February2023 March2023 25000 20000 15000 10000 5000 0 March2022 April2022 May2022 June2022 July2022August2022September2022October2022November2022December2022January2023February2023 March2023 7500 5000 2500 0 LosAngeles MARCH 2022 - MARCH 2023 Single-Family Homes
12
year-over-year.
& Townhomes
months,
Condos
LISTINGS FOR SALE SOLD LISTINGS
12 months, year-over-year
Median SalesPrice
Single-Family Homes
The median sales price has decreased from $955k last March 2022, to $885k as of March 2023
Condos & Townhomes
The median sales price has increased from $655k last March 2022, to $671k as of March 2023.
Overbids
Single-Family Homes
The overbid percentage has decreased from 100 6% last March 2022, to 95 7% a year later
Condos & Townhomes
The overbid percentage has decreased from 103.5% last March 2022, to 97.3% a year later.
Single-Family Homes
The average time spent on market went up from 19 days last March 2022, to 38 days as of March 2023
Condos & Townhomes
The average time spent on market went up from 21 days in March 2022, to 39 days as of March 2023
March2022April2022May2022June2022July2022August2022September2022October2022November2022December2022January2023February2023March2023 $1,000,000 $750,000 $500,000 $250,000 $0 March2022April2022May2022June2022 July2022August2022September2022October2022November2022December2022January2023February2023March2023 50 40 30 20 10 0 March2022April2022May2022June2022 July2022August2022September2022October2022November2022December2022January2023February2023March2023 125% 100% 75% 50% 25% 0%
AVGDays OntheMarket
Back to Table of Contents

S M

W d C s 2 s p o T u T m p o
SFH Single-Family Homes
27 New Listings
20 Sold Listings
6.9 Months of Inventory
$3.7M Median Sale Price
95.5% Median Sale vs List
25 Avg Days on Market
The data, sourced from Broker Metrics on April 3rd, includes all single-family homes, condos, and townhomes in the California Area from March 2022 to March 2023. This may include preliminary data, and vary from the time the data was gathered. All data is deemed reliable but not guaranteed. Questions may be directed to Keller Williams Advisors. DRE# 01499010. Copyright Keller Williams Santa Monica | Brentwood | Marina Del Rey | Pacific Palisades 2023. Each Office is independently owned and operated.
Co
3 New Listi
3. Months of Inven
99.2% Median Sale vs

LISTINGS FOR SALE SOLD LISTINGS
y y
Median SalesPrice
Single-Family Homes
The median sales price has decreased from $5m last March 2022, to $3 7m as of March 2023
Condos & Townhomes
The median sales price has decreased from $1.4m last March 2022, to $1.3m as of March 2023.
Overbids
Single-Family Homes
The overbid percentage has decreased from 99 6% last March 2022, to 95 5% a year later
Condos & Townhomes
The overbid percentage has increased from 101.8% last March 2022, to 99.2% a year later.
Single-Family Homes
The average time spent on market went down from 30 days last March 2022, to 25 days as of March 2023
The average time spent on market went up from 29 days in March 2022, to 48 days as of March 2023
March2022April2022May2022June2022July2022August2022September2022October2022November2022December2022January2023February2023March2023 $10,000,000 $7,500,000 $5,000,000 $2,500,000 $0 March2022April2022May2022June2022 July2022August2022September2022October2022November2022December2022January2023February2023March2023 100 75 50 25 0 March2022April2022May2022June2022 July2022August2022September2022October2022November2022December2022January2023February2023March2023 125% 100% 75% 50% 25% 0%
AVGDays OntheMarket
Condos & Townhomes
Back to Table of Contents

Brentwood
What's in the Brentwood data?
Currently, there are 133 single-family homes for sale, providing 4.8 months of inventory. There were 30 new listings, and 29 homes sold at a median sale price of $6.6m. The median overbid percentage was 93.4%, with an average of 29 days on the market.
There are currently 62 condo and townhome units for sale, providing 1 9 months of inventory There were 18 new listings, and 17 units sold at a median sale price of $1.2m. The median overbid percentage was 95.7%, with an average of 35 days on the market.

SFH Single-Family Homes
30 New Listings
29 Sold Listings
4.8 Months of Inventory
$6.6M Median Sale Price
93.4% Median Sale vs List
29 Avg Days on Market
The data, sourced from Broker Metrics on April 3rd, includes all single-family homes, condos, and townhomes in the California Area from March 2022 to March 2023. This may include preliminary data, and vary from the time the data was gathered. All data is deemed reliable but not guaranteed. Questions may be directed to Keller Williams Advisors. DRE# 01499010. Copyright Keller Williams Santa Monica | Brentwood | Marina Del Rey | Pacific Palisades 2023. Each Office is independently owned and operated.
CONDO

Condo & Townhomes
18 New Listings
17 Sold Listings
1.9 Months of Inventory
$1.2M Median Sale Price
95.7% Median Sale vs List
35 Avg Days on Market
Last 12 months,
Last 12 months, year-over-year
March2022 April2022 May2022 June2022 July2022August2022September2022October2022November2022December2022January2023February2023 March2023 200 150 100 50 0 March2022 April2022 May2022 June2022 July2022August2022September2022October2022November2022December2022January2023February2023 March2023 100 75 50 25 0 Brentwood MARCH 2022 - MARCH 2023
Homes
Single-Family
year-over-year.
& Townhomes
Condos
LISTINGS FOR SALE SOLD LISTINGS
Median SalesPrice
Single-Family Homes
The median sales price has increased from $2 9m last March 2022, to $6 6m as of March 2023
Condos & Townhomes
The median sales price has increased from $1.1m last March 2022, to $1.2m as of March 2023.
Overbids
Single-Family Homes
The overbid percentage has decreased from 99 5% last March 2022, to 93 4% a year later
Condos & Townhomes
The overbid percentage has decreased from 105.8% last March 2022, to 95.7% a year later.
Single-Family Homes
The average time spent on market went up from 20 days last March 2022, to 29 days as of March 2023
Condos
The average time spent on market went up from 34 days in March 2022, to 35 days as of March 2023
March2022April2022May2022June2022July2022August2022September2022October2022November2022December2022January2023February2023March2023 $7,500,000 $5,000,000 $2,500,000 $0 March2022April2022May2022June2022 July2022August2022September2022October2022November2022December2022January2023February2023March2023 60 40 20 0 March2022April2022May2022June2022 July2022August2022September2022October2022November2022December2022January2023February2023March2023 125% 100% 75% 50% 25% 0%
OntheMarket
AVGDays
& Townhomes
Back to Table of Contents

M De
What' data? Currently sale, pro were 2 n sale pric percenta days on There ar for sale, were 27 median s percenta days on

Msingle-family homes, March 2023. This gathered. All data is Keller Williams Brentwood | Marina Del Rey | Pacific Palisades 2023. Each Office is independently owned and operated.
ce
rket
C Cond
27 New Listings

3.3 Months of Inventory
100.8% Median Sale vs List
mber2022October2022November2022December2022January2023February2023 March2023 mber2022October2022November2022December2022January2023February2023 March2023 DelRey ear. y year LISTINGS FOR SALE SOLD LISTINGS
Median SalesPrice
Single-Family Homes
The median sales price has increased from $2 7m last March 2022, to $2 9m as of March 2023
Condos & Townhomes
The median sales price has decreased from $1.29m last March 2022, to $1.28m as of March 2023.
Overbids
Single-Family Homes
The overbid percentage has decreased from 102 1% last March 2022, to 97 8% a year later
Condos & Townhomes
The overbid percentage has decreased from 101.1% last March 2022, to 100.8% a year later.
Single-Family Homes
The average time spent on market went up from 16 days last March 2022, to 108 days as of March 2023
Condos
The average time spent on market went up from 17 days in March 2022, to 23 days as of March 2023
March2022April2022May2022June2022July2022August2022September2022October2022November2022December2022January2023February2023March2023 $10,000,000 $7,500,000 $5,000,000 $2,500,000 $0 March2022April2022May2022June2022 July2022August2022September2022October2022November2022December2022January2023February2023March2023 125 100 75 50 25 0 March2022April2022May2022June2022 July2022August2022September2022October2022November2022December2022January2023February2023March2023 125% 100% 75% 50% 25% 0%
AVGDays OntheMarket
& Townhomes
Back to Table of Contents
Pacific Palisades
What's in the Pacific Palisades data?
Currently, there are 141 single-family homes sale, providing 3.1 months of inventory. Ther were 37 new listings, and 31 homes sold at a median sale price of $5.9m. The median ove percentage was 95 1%, with an average of 35 on the market.
There are currently 39 condo and townhome for sale, providing 2.9 months of inventory. T were 12 new listings, and 2 units sold at a m sale price of $1.7m. The median overbid percentage was 100.5%, with an average of 5 days on the market

He-Family Homes
ngs
1 f Inventory
31 Sold Listings
$5.9M Median Sale Price
.1% ale vs List
35 Avg Days on Market
urced from Broker Metrics on April 3rd, includes all single-family homes, townhomes in the California Area from March 2022 to March 2023. This preliminary data, and vary from the time the data was gathered. All data is able but not guaranteed. Questions may be directed to Keller Williams 01499010. Copyright Keller Williams Santa Monica | Brentwood | Marina Del Rey | Pacific Palisades 2023. Each Office is independently owned and operated.
CONDO

Condo & Townhomes
12 New Listings
2 Sold Listings
2.9 Months of Inventory
$1.7M Median Sale Price
100.5% Median Sale vs List
58 Avg Days on Market
March2022 April2022 May2022 June2022 July2022August2022September2022October2022November2022December2022January2023February2023 March2023 200 150 100 50 0 March2022 April2022 May2022 June2022 July2022August2022September2022October2022November2022December2022January2023February2023 March2023 50 40 30 20 10 0 PacificPalisades MARCH 2022 - MARCH 2023 Single-Family Homes
12 months, year-over-year. Condos & Townhomes
12 months, year-over-year LISTINGS FOR SALE SOLD LISTINGS
Last
Last
Median SalesPrice
Single-Family Homes
The median sales price has increased from $3 8m last March 2022, to $5 9m as of March 2023
Condos & Townhomes
The median sales price has increased from $1.3m last March 2022, to $1.7m as of March 2023.
Overbids
Single-Family Homes
The overbid percentage has increased from 94 4% last March 2022, to 95 1% a year later
Condos & Townhomes
The overbid percentage has decreased from 104.2% last March 2022, to 100.5% a year later.
Single-Family Homes
The average time spent on market went up from 27 days last March 2022, to 35 days as of March 2023
The average time spent on market went up from 54 days in March 2022, to 58 days as of March 2023
March2022April2022May2022June2022July2022August2022September2022October2022November2022December2022January2023February2023March2023 $6,000,000 $4,000,000 $2,000,000 $0 March2022April2022May2022June2022 July2022August2022September2022October2022November2022December2022January2023February2023March2023 125 100 75 50 25 0 March2022April2022May2022June2022 July2022August2022September2022October2022November2022December2022January2023February2023March2023 125% 100% 75% 50% 25% 0%
AVGDays OntheMarket
Condos & Townhomes
Back to Table of Contents

Culver City
What's in the Culver City dat
Currently, there are 53 single-family homes fo sale, providing 2.2 months of inventory. There were 13 new listings, and 13 homes sold at a median sale price of $1.4m. The median over percentage was 93.6%, with an average of 48 on the market.
There are currently 34 condo and townhome for sale, providing 0.9 months of inventory. T were 15 new listings, and 10 condos sold at a median sale price of $564k. The median over percentage was 98 6%, with an average of 17 on the market.

FH ngle-Family Homes
3 Listings
13 Sold Listings
.2 ths of Inventory
$1.4M Median Sale Price
3.6% ian Sale vs List
48 Avg Days on Market
ta, sourced from Broker Metrics on April 3rd, includes all single-family homes, condos, and townhomes in the California Area from March 2022 to March 2023. This include preliminary data, and vary from the time the data was gathered. All data is deemed reliable but not guaranteed. Questions may be directed to Keller Williams Advisors. DRE# 01499010. Copyright Keller Williams Santa Monica | Brentwood | Marina Del Rey | Pacific Palisades 2023. Each Office is independently owned and operated.

15 New Listings
$56
S
Median Sale vs List Avg Days o
Condo & Townh
0.9 Months of Inventory
Median
98.6%
Sold COND
May2022 June2022 July2022August2022September2022October2022November2022December2022January2023February2023 March2023 May2022 June2022 July2022August2022September2022October2022November2022December2022January2023February2023 March2023 lverCity
2022 - MARCH 2023
MARCH
onths, year-over-year.
mily Homes
year-over-year
FOR SALE SOLD LISTINGS
Townhomes onths,
LISTINGS
Median SalesPrice
Single-Family Homes
The median sales price has decreased from $1 7m last March 2022, to $1 4m as of March 2023
Condos & Townhomes
The median sales price has decreased from $750k last March 2022, to $564k as of March 2023.
Overbids
Single-Family Homes
The overbid percentage has decreased from 105 6% last March 2022, to 93 6% a year later
Condos & Townhomes
The overbid percentage has decreased from 108.5% last March 2022, to 98.6% a year later.
Single-Family Homes
The average time spent on market went up from 12 days last March 2022, to 48 days as of March 2023
The average time spent on market went up from 14 days in March 2022, to 17 days as of March 2023
March2022April2022May2022June2022July2022August2022September2022October2022November2022December2022January2023February2023March2023 $2,500,000 $2,000,000 $1,500,000 $1,000,000 $500,000 $0 March2022April2022May2022June2022 July2022August2022September2022October2022November2022December2022January2023February2023March2023 75 50 25 0 March2022April2022May2022June2022 July2022August2022September2022October2022November2022December2022January2023February2023March2023 125% 100% 75% 50% 25% 0%
AVGDays OntheMarket
Condos & Townhomes
Back to Table of Contents

Sherman Oaks
What's in the Sherman Oaks data?
Currently, there are 160 single-family homes sale, providing 2.1 months of inventory. Ther were 57 new listings, and 40 homes sold at a median sale price of $1.8m. The median ove percentage was 99 1%, with an average of 31 on the market.
There are currently 54 condo and townhome for sale, providing 1.2 months of inventory. T were 17 new listings, and 20 units sold at a median sale price of $668k. The median ove percentage was 101.9%, with an average of 4 days on the market

He-Family Homes
ngs
1 f Inventory
40 Sold Listings
$1.8M Median Sale Price
.1% ale vs List
31 Avg Days on Market
urced from Broker Metrics on April 3rd, includes all single-family homes, townhomes in the California Area from March 2022 to March 2023. This preliminary data, and vary from the time the data was gathered. All data is able but not guaranteed. Questions may be directed to Keller Williams 01499010. Copyright Keller Williams Santa Monica | Brentwood | Marina Del Rey | Pacific Palisades 2023. Each Office is independently owned and operated.
C Cond
17 New Listings

1.2 Months of Inventory
101.9% Median Sale vs List
mber2022October2022November2022December2022January2023February2023 March2023 ember2022October2022November2022December2022January2023February2023 March2023 nOaks ear. y year LISTINGS FOR SALE SOLD LISTINGS
Median SalesPrice
Single-Family Homes
The median sales price has increased from $1 8m last March 2022, to $1 825m as of March 2023
Condos & Townhomes
The median sales price has decreased from $690k last March 2022, to $668k as of March 2023.
Overbids
Single-Family Homes
The overbid percentage has decreased from 104 2% last March 2022, to 99 1% a year later
Condos & Townhomes
The overbid percentage has decreased from 105.8% last March 2022, to 101.9% a year later.
Single-Family Homes
The average time spent on market went up from 16 days last March 2022, to 31 days as of March 2023
Condos
The average time spent on market went up from 13 days in March 2022, to 44 days as of March 2023
March2022April2022May2022June2022July2022August2022September2022October2022November2022December2022January2023February2023March2023 $2,000,000 $1,500,000 $1,000,000 $500,000 $0 March2022April2022May2022June2022 July2022August2022September2022October2022November2022December2022January2023February2023March2023 50 40 30 20 10 0 March2022April2022May2022June2022 July2022August2022September2022October2022November2022December2022January2023February2023March2023 125% 100% 75% 50% 25% 0%
AVGDays OntheMarket
& Townhomes
Back to Table of Contents

StudioCity
What's in the Studio City data?
Currently, there are 108 single-family homes for sale, providing 2.6 months of inventory. There were 31 new listings, and 19 homes sold at a median sale price of $2.4m. The median overbi percentage was 97.6%, with an average of 32 d on the market.
There are currently 32 condo and townhome un for sale, providing 2 months of inventory There were 16 new listings, and 8 units sold at a medi sale price of $735k. The median overbid percentage was 96.8%, with an average of 12 d on the market.

FH gle-Family Homes
1 istings
19 Sold Listings
6 s of Inventory
$2.4M Median Sale Price
7.6% n Sale vs List
32 Avg Days on Market
sourced from Broker Metrics on April 3rd, includes all single-family homes, and townhomes in the California Area from March 2022 to March 2023. This include preliminary data, and vary from the time the data was gathered. All data is reliable but not guaranteed. Questions may be directed to Keller Williams DRE# 01499010. Copyright Keller Williams Santa Monica | Brentwood | Marina Del Rey | Pacific Palisades 2023. Each Office is independently owned and operated.
CONDO
Condo & Townhomes

16 New Listings
8 Sold Listings
2 Months of Inventory
$735K Median Sale Price
96.8% Median Sale vs List
12 Avg Days on Market
Last
Last 12 months, year-over-year
March2022 April2022 May2022 June2022 July2022August2022September2022October2022November2022December2022January2023February2023 March2023 200 150 100 50 0 March2022 April2022 May2022 June2022 July2022August2022September2022October2022November2022December2022January2023February2023 March2023 75 50 25 0 StudioCity
2022 - MARCH 2023
Homes
MARCH
Single-Family
year-over-year.
& Townhomes
12 months,
Condos
LISTINGS FOR SALE SOLD LISTINGS
Median SalesPrice
Single-Family Homes
The median sales price has decreased from $2 6m last March 2022, to $2 4m as of March 2023
Condos & Townhomes
The median sales price has decreased from $799k last March 2022, to $735k as of March 2023.
Overbids
Single-Family Homes
The overbid percentage has decreased from 101 1% last March 2022, to 97 6% a year later
Condos & Townhomes
The overbid percentage has decreased from 109.9% last March 2022, to 96.8% a year later.
Single-Family Homes
The average time spent on market went up from 18 days last March 2022, to 32 days as of March 2023
The average time spent on market has not changed from 12 days in March 2022, to 12 days as of March 2023
March2022April2022May2022June2022July2022August2022September2022October2022November2022December2022January2023February2023March2023 $4,000,000 $3,000,000 $2,000,000 $1,000,000 $0 March2022April2022May2022June2022 July2022August2022September2022October2022November2022December2022January2023February2023March2023 125 100 75 50 25 0 March2022April2022May2022June2022 July2022August2022September2022October2022November2022December2022January2023February2023March2023 125% 100% 75% 50% 25% 0%
AVGDays OntheMarket
Condos & Townhomes
Back to Table of Contents

Westlake Village
What's in the Westlake Village data?
Currently, there are 104 single-family homes for sale, providing 2.3 months of inventory. There were 25 new listings, and 24 homes sold at a median sale price of $1.4m. The median overbid percentage was 98 6%, with an average of 35 days on the market.
There are currently 44 condo and townhome units for sale, providing 1.6 months of inventory. There were 16 new listings, and 14 units sold at a median sale price of $754k. The median overbid percentage was 97.1%, with an average of 56 days on the market

SFH Single-Family Homes
25 New Listings
24 Sold Listings
2.3 Months of Inventory
$1.4M Median Sale Price
98.6% Median Sale vs List
35 Avg Days on Market
The data, sourced from Broker Metrics on April 3rd, includes all single-family homes, condos, and townhomes in the California Area from March 2022 to March 2023. This may include preliminary data, and vary from the time the data was gathered. All data is deemed reliable but not guaranteed. Questions may be directed to Keller Williams Advisors. DRE# 01499010. Copyright Keller Williams Santa Monica | Brentwood | Marina Del Rey | Pacific Palisades 2023. Each Office is independently owned and operated.

LISTINGS FOR SALE SOLD LISTINGS
, y y
Median SalesPrice
Single-Family Homes
The median sales price has decreased from $2 2m last March 2022, to $1 4m as of March 2023
Condos
The median sales price has decreased from $770k last March 2022, to $754k as of March 2023.
Overbids
Single-Family Homes
The overbid percentage has decreased from 100% last March 2022, to 98 6% a year later
Condos & Townhomes
The overbid percentage has decreased from 101.9% last March 2022, to 97.1% a year later.
Single-Family Homes
The average time spent on market went up from 32 days last March 2022, to 35 days as of March 2023
The average time spent on market went up from 20 days in March 2022, to 56 days as of March 2023
March2022April2022May2022June2022July2022August2022September2022October2022November2022December2022January2023February2023March2023 $2,500,000 $2,000,000 $1,500,000 $1,000,000 $500,000 $0 March2022April2022May2022June2022 July2022August2022September2022October2022November2022December2022January2023February2023March2023 100 75 50 25 0 March2022April2022May2022June2022 July2022August2022September2022October2022November2022December2022January2023February2023March2023 125% 100% 75% 50% 25% 0%
& Townhomes
AVGDays OntheMarket
Condos & Townhomes
Back to Table of Contents

Playa DelRey
What's in the Playa Del Rey data?
Currently, there are 16 single-family homes for sale, providing 7 months of inventory. There were 7 new listings, and 1 home sold at a median sale price of $2.9m. The median overbid percentage was 91 5%, with an average of 14 days on the market.
There are currently 24 condo and townhome units for sale, providing 1 month of inventory. There were 14 new listings, and 9 units sold at a median sale price of $789k. The median overbid percentage was 100.3%, with an average of 11 days on the market

SFH Single-Family Homes
7 New Listings
1 Sold Listings
7 Months of Inventory
$2.9M Median Sale Price
91.5% Median Sale vs List
14 Avg Days on Market
The data, sourced from Broker Metrics on April 3rd, includes all single-family homes, condos, and townhomes in the California Area from March 2022 to March 2023. This may include preliminary data, and vary from the time the data was gathered. All data is deemed reliable but not guaranteed. Questions may be directed to Keller Williams Advisors. DRE# 01499010. Copyright Keller Williams Santa Monica | Brentwood | Marina Del Rey | Pacific Palisades 2023. Each Office is independently owned and operated.
CONDO
Condo & Townhomes
14 New Listings

9 Sold Listings
1 Months of Inventory
$789K Median Sale Price
100.3% Median Sale vs List
11 Avg Days on Market
Single-Family Homes
Last 12 months, year-over-year.
Condos & Townhomes
Last 12 months, year-over-year
March2022 April2022 May2022 June2022 July2022August2022September2022October2022November2022December2022January2023February2023 March2023 40 30 20 10 0 March2022 April2022 May2022 June2022 July2022August2022September2022October2022November2022December2022January2023February2023 March2023 60 40 20 0
PlayaDelRey
MARCH 2022 - MARCH 2023
LISTINGS FOR SALE SOLD LISTINGS
Median SalesPrice
Single-Family Homes
The median sales price has increased from $2 3m last March 2022, to $2 9m as of March 2023
Condos & Townhomes
The median sales price has increased from $760k last March 2022, to $789k as of March 2023.
Overbids
Single-Family Homes
The overbid percentage has decreased from 108 8% last March 2022, to 91 5% a year later
Condos & Townhomes
The overbid percentage has decreased from 104.9% last March 2022, to 100.3% a year later.
Single-Family Homes
The average time spent on market went down from 30 days last March 2022, to 14 days as of March 2023
The average time spent on market went down from 13 days in March 2022, to 11 days as of March 2023
March2022April2022May2022June2022July2022August2022September2022October2022November2022December2022January2023February2023March2023 $4,000,000 $3,000,000 $2,000,000 $1,000,000 $0 March2022April2022May2022June2022 July2022August2022September2022October2022November2022December2022January2023February2023March2023 150 100 50 0 March2022April2022May2022June2022 July2022August2022September2022October2022November2022December2022January2023February2023March2023 125% 100% 75% 50% 25% 0%
AVGDays OntheMarket
Condos & Townhomes
Back to Table of Contents

Ne

Months of 95. Median S
mber2022October2022November2022December2022January2023February2023 March2023 mber2022October2022November2022December2022January2023February2023 March2023 ear. y year LISTINGS FOR SALE SOLD LISTINGS
Median SalesPrice
Single-Family Homes
The median sales price has decreased from $2 4m last March 2022, to $2 2m as of March 2023
Condos & Townhomes
The median sales price has increased from $1.7m last March 2022, to $2m as of March 2023.
Overbids
Single-Family Homes
The overbid percentage has decreased from 102 6% last March 2022, to 95 2% a year later
Condos & Townhomes
The overbid percentage has decreased from 99% last March 2022, to 95.5% a year later.
Single-Family Homes
The average time spent on market went up from 34 days last March 2022, to 45 days as of March 2023
Condos
The average time spent on market went up from 38 days in March 2022, to 70 days as of March 2023
March2022April2022May2022June2022July2022August2022September2022October2022November2022December2022January2023February2023March2023 $4,000,000 $3,000,000 $2,000,000 $1,000,000 $0 March2022April2022May2022June2022 July2022August2022September2022October2022November2022December2022January2023February2023March2023 75 50 25 0 March2022April2022May2022June2022 July2022August2022September2022October2022November2022December2022January2023February2023March2023 125% 100% 75% 50% 25% 0%
AVGDays OntheMarket
& Townhomes
Back to Table of Contents
West Hollywood
What's in the West Hollywood data?
Currently, there are 44 single-family homes for sale, providing 12 months of inventory. There were 5 new listings, and 12 homes sold at a median sale price of $2.1m. The median overbid percentage was 91 8%, with an average of 28 days on the market.
There are currently 145 condo and townhome units for sale, providing 3.2 months of inventory. There were 35 new listings, and 34 units sold at a median sale price of $955k. The median overbid percentage was 96.1%, with an average of 28 days on the market

SFH Single-Family Homes
5 New Listings
12 Sold Listings
12 Months of Inventory
$2.1M Median Sale Price
91.8% Median Sale vs List
28 Avg Days on Market
The data, sourced from Broker Metrics on April 3rd, includes all single-family homes, condos, and townhomes in the California Area from March 2022 to March 2023. This may include preliminary data, and vary from the time the data was gathered. All data is deemed reliable but not guaranteed. Questions may be directed to Keller Williams Advisors. DRE# 01499010. Copyright Keller Williams Santa Monica | Brentwood | Marina Del Rey | Pacific Palisades 2023. Each Office is independently owned and operated.
35 New Listings

34 Sold Listings
3.2 Months of Inventory
$955K Median Sale Price
96.1% Median Sale vs List
28 Avg Days on Market
CONDO Condo & Townhomes
Last 12 months,
March2022 April2022 May2022 June2022 July2022August2022September2022October2022November2022December2022January2023February2023 March2023 75 50 25 0 March2022 April2022 May2022 June2022 July2022August2022September2022October2022November2022December2022January2023February2023 March2023 250 200 150 100 50 0 WestHollywood MARCH 2022 - MARCH 2023 Single-Family Homes
year-over-year.
& Townhomes
Last 12 months,
Condos
LISTINGS FOR SALE SOLD LISTINGS
year-over-year
Median SalesPrice
Single-Family Homes
The median sales price has decreased from $2 8m last March 2022, to $2 1m as of March 2023
Condos & Townhomes
The median sales price has increased from $912k last March 2022, to $955k as of March 2023.
Overbids
Single-Family Homes
The overbid percentage has decreased from 103 5% last March 2022, to 91 8% a year later
Condos & Townhomes
The overbid percentage has decreased from 100.7% last March 2022, to 96.10% a year later.
Single-Family Homes
The average time spent on market went down from 54 days last March 2022, to 28 days as of March 2023
Condos & Townhomes
The average time spent on market went up from 24 days in March 2022, to 28 days as of March 2023
March2022April2022May2022June2022July2022August2022September2022October2022November2022December2022January2023February2023March2023 $4,000,000 $3,000,000 $2,000,000 $1,000,000 $0 March2022April2022May2022June2022 July2022August2022September2022October2022November2022December2022January2023February2023March2023 80 60 40 20 0 March2022April2022May2022June2022 July2022August2022September2022October2022November2022December2022January2023February2023March2023 125% 100% 75% 50% 25% 0%
AVGDays OntheMarket
Back to Table of Contents
Beverly Hills
What's in the Beve data?
Currently, there are 247 single sale, providing 6.6 months of were 35 new listings, and 29 median sale price of $8.3m. T percentage was 90 1%, with a on the market.
There are currently 64 condo for sale, providing 3.9 months were 15 new listings, and 11 median sale price of $1.8m. T percentage was 92.2%, with a on the market

Homes
29 Sold Listings
$8.3M Median Sale Price
70 Avg Days on Market
on April 3rd, includes all single-family homes, California Area from March 2022 to March 2023. This from the time the data was gathered. All data is Questions may be directed to Keller Williams Keller Williams Santa Monica | Brentwood | Marina Del Rey | Pacific Palisades 2023. Each Office is independently owned and operated.
CONDO
Condo & Townhomes
15 New Listings
11 Sold Listings
3.9 Months of Inventory
$1.8M Median Sale Price
92.2% Median Sale vs List
60 Avg Days on Market
Last 12 months,
Last 12 months, year-over-year
March2022 April2022 May2022 June2022 July2022August2022September2022October2022November2022December2022January2023February2023 March2023 400 300 200 100 0 March2022 April2022 May2022 June2022 July2022August2022September2022October2022November2022December2022January2023February2023 March2023 75 50 25 0 BeverlyHills
2022 - MARCH 2023
Homes
MARCH
Single-Family
year-over-year.
& Townhomes
Condos
LISTINGS FOR SALE SOLD LISTINGS
Median SalesPrice
Single-Family Homes
The median sales price has increased from $4 2m last March 2022, to $8 3m as of March 2023
Condos & Townhomes
The median sales price has increased from $1.5m last March 2022, to $1.8m as of March 2023.
Overbids
Single-Family Homes
The overbid percentage has decreased from 99% last March 2022, to 90 1% a year later
Condos & Townhomes
The overbid percentage has decreased from 98.4% last March 2022, to 92.2% a year later.
Single-Family Homes
The average time spent on market went up from 68 days last March 2022, to 70 days as of March 2023
The average time spent on market went up from 14 days in March 2022, to 60 days as of March 2023
March2022April2022May2022June2022July2022August2022September2022October2022November2022December2022January2023February2023March2023 $10,000,000 $7,500,000 $5,000,000 $2,500,000 $0 March2022April2022May2022June2022 July2022August2022September2022October2022November2022December2022January2023February2023March2023 125 100 75 50 25 0 March2022April2022May2022June2022 July2022August2022September2022October2022November2022December2022January2023February2023March2023 125% 100% 75% 50% 25% 0%
AVGDays OntheMarket
Condos & Townhomes
Back to Table of Contents

Riverside County
What's in the Riverside County data?
Currently, there are 8,442 single-family homes for sale, providing 2 months of inventory. There were 2,307 new listings, and 2,103 homes sold at a median sale price of $569k. The median overbid percentage was 95 5%, with an average of 50 days on the market.
There are currently 1,624 condo and townhome units for sale, providing 2.1 months of inventory. There were 435 new listings, and 315 units sold at a median sale price of $485k. The median overbid percentage was 95.1%, with an average of 47 days on the market

SFH Single-Family Homes
2,307 New Listings
2,103 Sold Listings
2 Months of Inventory
$569K Median Sale Price
95.5% Median Sale vs List
50 Avg Days on Market
The data, sourced from Broker Metrics on April 3rd, includes all single-family homes, condos, and townhomes in the California Area from March 2022 to March 2023. This may include preliminary data, and vary from the time the data was gathered. All data is deemed reliable but not guaranteed. Questions may be directed to Keller Williams Advisors. DRE# 01499010. Copyright Keller Williams Santa Monica | Brentwood | Marina Del Rey | Pacific Palisades 2023. Each Office is independently owned and operated.

435 New Listings 2.1 Months of Inventory $485K Median Sale Price 95.1% Median Sale vs List 47 Avg Days on Market 315 Sold Listings CONDO Condo & Townhomes
Last
March2022 April2022 May2022 June2022 July2022August2022September2022October2022November2022December2022January2023February2023 March2023 15000 10000 5000 0 March2022 April2022 May2022 June2022 July2022August2022September2022October2022November2022December2022January2023February2023 March2023 2000 1500 1000 500 0 RiversideCounty MARCH 2022 - MARCH 2023 Single-Family Homes
12 months, year-over-year.
& Townhomes
Last
Condos
year-over-year LISTINGS FOR SALE SOLD LISTINGS
12 months,
Median SalesPrice
Single-Family Homes
The median sales price has decreased from $610k last March 2022, to $569k as of March 2023
Condos & Townhomes
The median sales price has increased from $450k last March 2022, to $485k as of March 2023.
Overbids
Single-Family Homes
The overbid percentage has decreased from 101 8% last March 2022, to 95 5% a year later
Condos & Townhomes
The overbid percentage has decreased from 102.7% last March 2022, to 95.1% a year later.
Single-Family Homes
The average time spent on market went up from 22 days last March 2022, to 50 days as of March 2023
Condos & Townhomes
The average time spent on market went up from 20 days in March 2022, to 47 days as of March 2023
March2022April2022May2022June2022July2022August2022September2022October2022November2022December2022January2023February2023March2023 $750,000 $500,000 $250,000 $0 March2022April2022May2022June2022 July2022August2022September2022October2022November2022December2022January2023February2023March2023 60 40 20 0 March2022April2022May2022June2022 July2022August2022September2022October2022November2022December2022January2023February2023March2023 125% 100% 75% 50% 25% 0%
AVGDays OntheMarket
Back to Table of Contents

Encino
What's in the Encino data?
Currently, there are 187 single-family homes sale, providing 3.2 months of inventory. Ther were 62 new listings, and 30 homes sold at a median sale price of $3.4m. The median ove percentage was 93%, with an average of 34 d on the market.
There are currently 60 condo and townhome for sale, providing 1 1 months of inventory T were 24 new listings, and 17 units sold at a median sale price of $455k. The median ove percentage was 97.6%, with an average of 46 on the market.
He-Family Homes
ngs
2 f Inventory
30 Sold Listings
$3.4M Median Sale Price
% ale vs List
34 Avg Days on Market
urced from Broker Metrics on April 3rd, includes all single-family homes, townhomes in the California Area from March 2022 to March 2023. This preliminary data, and vary from the time the data was gathered. All data is able but not guaranteed. Questions may be directed to Keller Williams 01499010. Copyright Keller Williams Santa Monica | Brentwood | Marina Del Rey | Pacific Palisades 2023. Each Office is independently owned and operated.

24 New Listings
of
Median Sale Price
Median Sale vs List
Avg
on Market
1.1 Months
Inventory $455K
97.6%
46
Days
Condo & Townhomes
17 Sold Listings CONDO
Single-Family Homes
Last 12 months, year-over-year.
Condos & Townhomes
Last 12 months, year-over-year
March2022 April2022 May2022 June2022 July2022August2022September2022October2022November2022December2022January2023February2023 March2023 50 00 50 00 50 0 March2022 April2022 May2022 June2022 July2022August2022September2022October2022November2022December2022January2023February2023 March2023 25 00 75 50 25 0 Encino
2022 - MARCH 2023
MARCH
LISTINGS FOR SALE SOLD LISTINGS
Median SalesPrice
Single-Family Homes
The median sales price has increased from $2 1m last March 2022, to $3 4m as of March 2023
Condos & Townhomes
The median sales price has decreased from $578k last March 2022, to $455k as of March 2023.
Overbids
Single-Family Homes
The overbid percentage has decreased from 98 7% last March 2022, to 93% a year later
Condos & Townhomes
The overbid percentage has decreased from 103.5% last March 2022, to 97.6% a year later.
Single-Family Homes
The average time spent on market went up from 17 days last March 2022, to 34 days as of March 2023
The average time spent on market went up from 13 days in March 2022, to 46 days as of March 2023
March2022April2022May2022June2022July2022August2022September2022October2022November2022December2022January2023February2023March2023 $4,000,000 $3,000,000 $2,000,000 $1,000,000 $0 March2022April2022May2022June2022 July2022August2022September2022October2022November2022December2022January2023February2023March2023 60 40 20 0 March2022April2022May2022June2022 July2022August2022September2022October2022November2022December2022January2023February2023March2023 125% 100% 75% 50% 25% 0%
AVGDays OntheMarket
Condos & Townhomes
Back to Table of Contents

Sa C

data
Wha
Curren sale, p 1,467 n media percen on the There units f There a med percen on the
CONDO
Condo & Townhomes
722 New Listings
658 Sold Listings
1.4 Months of Inventory
$632K Median Sale Price
98.8% Median Sale vs List
23 Avg Days on Market
LISTINGS FOR SALE SOLD LISTINGS
Median SalesPrice
Single-Family Homes
The median sales price has decreased from $968k last March 2022, to $920k as of March 2023
Condos & Townhomes
The median sales price has decreased from $635k last March 2022, to $632k as of March 2023.
Overbids
Single-Family Homes
The overbid percentage has decreased from 104 3% last March 2022, to 97 1% a year later
Condos & Townhomes
The overbid percentage has decreased from 106.2% last March 2022, to 98.8% a year later.
Single-Family Homes
The average time spent on market went up from 13 days last March 2022, to 24 days as of March 2023
Condos
The average time spent on market went up from 12 days in March 2022, to 23 days as of March 2023
March2022April2022May2022June2022July2022August2022September2022October2022November2022December2022January2023February2023March2023 $1,000,000 $750,000 $500,000 $250,000 $0 March2022April2022May2022June2022 July2022August2022September2022October2022November2022December2022January2023February2023March2023 40 30 20 10 0 March2022April2022May2022June2022 July2022August2022September2022October2022November2022December2022January2023February2023March2023 125% 100% 75% 50% 25% 0%
OntheMarket
AVGDays
& Townhomes
Back to Table of Contents


: 2701 Ocean Park Blvd #140, Santa Monica, CA 90405, United States KellerWilliamsSantaMonica 11812 San Vicente Blvd Ste 100, Los Angeles, CA 90049, United States KellerWilliamsBrentwood 444 Washington Blvd Marina Del Rey, CA 90292, United States KellerWilliamsMarinaDelRey 845 Vía De La Paz, Pacific Palisades, CA 90272, United States KellerWilliamsPacificPalisades
