Celeste Johnson - February 2025 Market Report Palo Alto Area
Palo Alto area
Palo Alto Los Altos
Jump to Palo Alto Report
Redwood City
Jump to Redwood City Report
Portola Valley
Jump to Portola Valley Report
Menlo Park
Jump to Menlo Park Report
Atherton
Jump to Atherton Report
Jump to Los Altos Report
San Jose
Jump to San Jose Report
Mountain View
Jump to Mountain View Report
San Mateo County
Jump to San Mateo County Report
Santa Clara County
Jump to Santa Clara County Report
Monterey County
Jump to Monterey County Report
Santa Cruz County
Jump to Santa Cruz County Report
East Palo Alto
Jump to East Palo Alto Report
Sunnyvale
Jump to Sunnyvale Report
Santa Clara City
Jump to Santa Clara City Report
Saratoga
Jump to Saratoga Report
What’syourhome reallyworthin today’smarket?
That's the question you should be asking yourself.
Our market is incredibly diverse and rapidly changing. Values vary not just by neighborhood but by street. Your home isn't necessarily worth what your neighbors' home is. It's the current market that sets the value of your home.
So, do you know what your home is worth today's market?
Icanhelp...
Contact me for a confidential, no obligation assessment of your home's value.
BuyerBrightSpot: ThereAreMoreHomesonthe Market
The past few years have been challenging for homebuyers, especially with higher home prices and mortgage rates. And if you’re trying to buy a home, it’s easy to worry you won’t be able to find something in your budget.
But here’s what you need to know. The number of homes for sale has grown a whole lot lately and that’s true for both existing (previously lived-in) and newly built homes. Here’s a look at those two bright spots for buyers right now and why they may make it a bit easier to find the home you’re been looking for.
Smart Strategies for a Mortgage Application
Avoid paying off debts or collections without professional advice.
Don't have your credit report pulled too many times - this can hurt your credit score. 3 4 5 6 1 2
Always consult your mortgage professional before making large financial moves. Use verified funds for deposits to prevent closing delays.
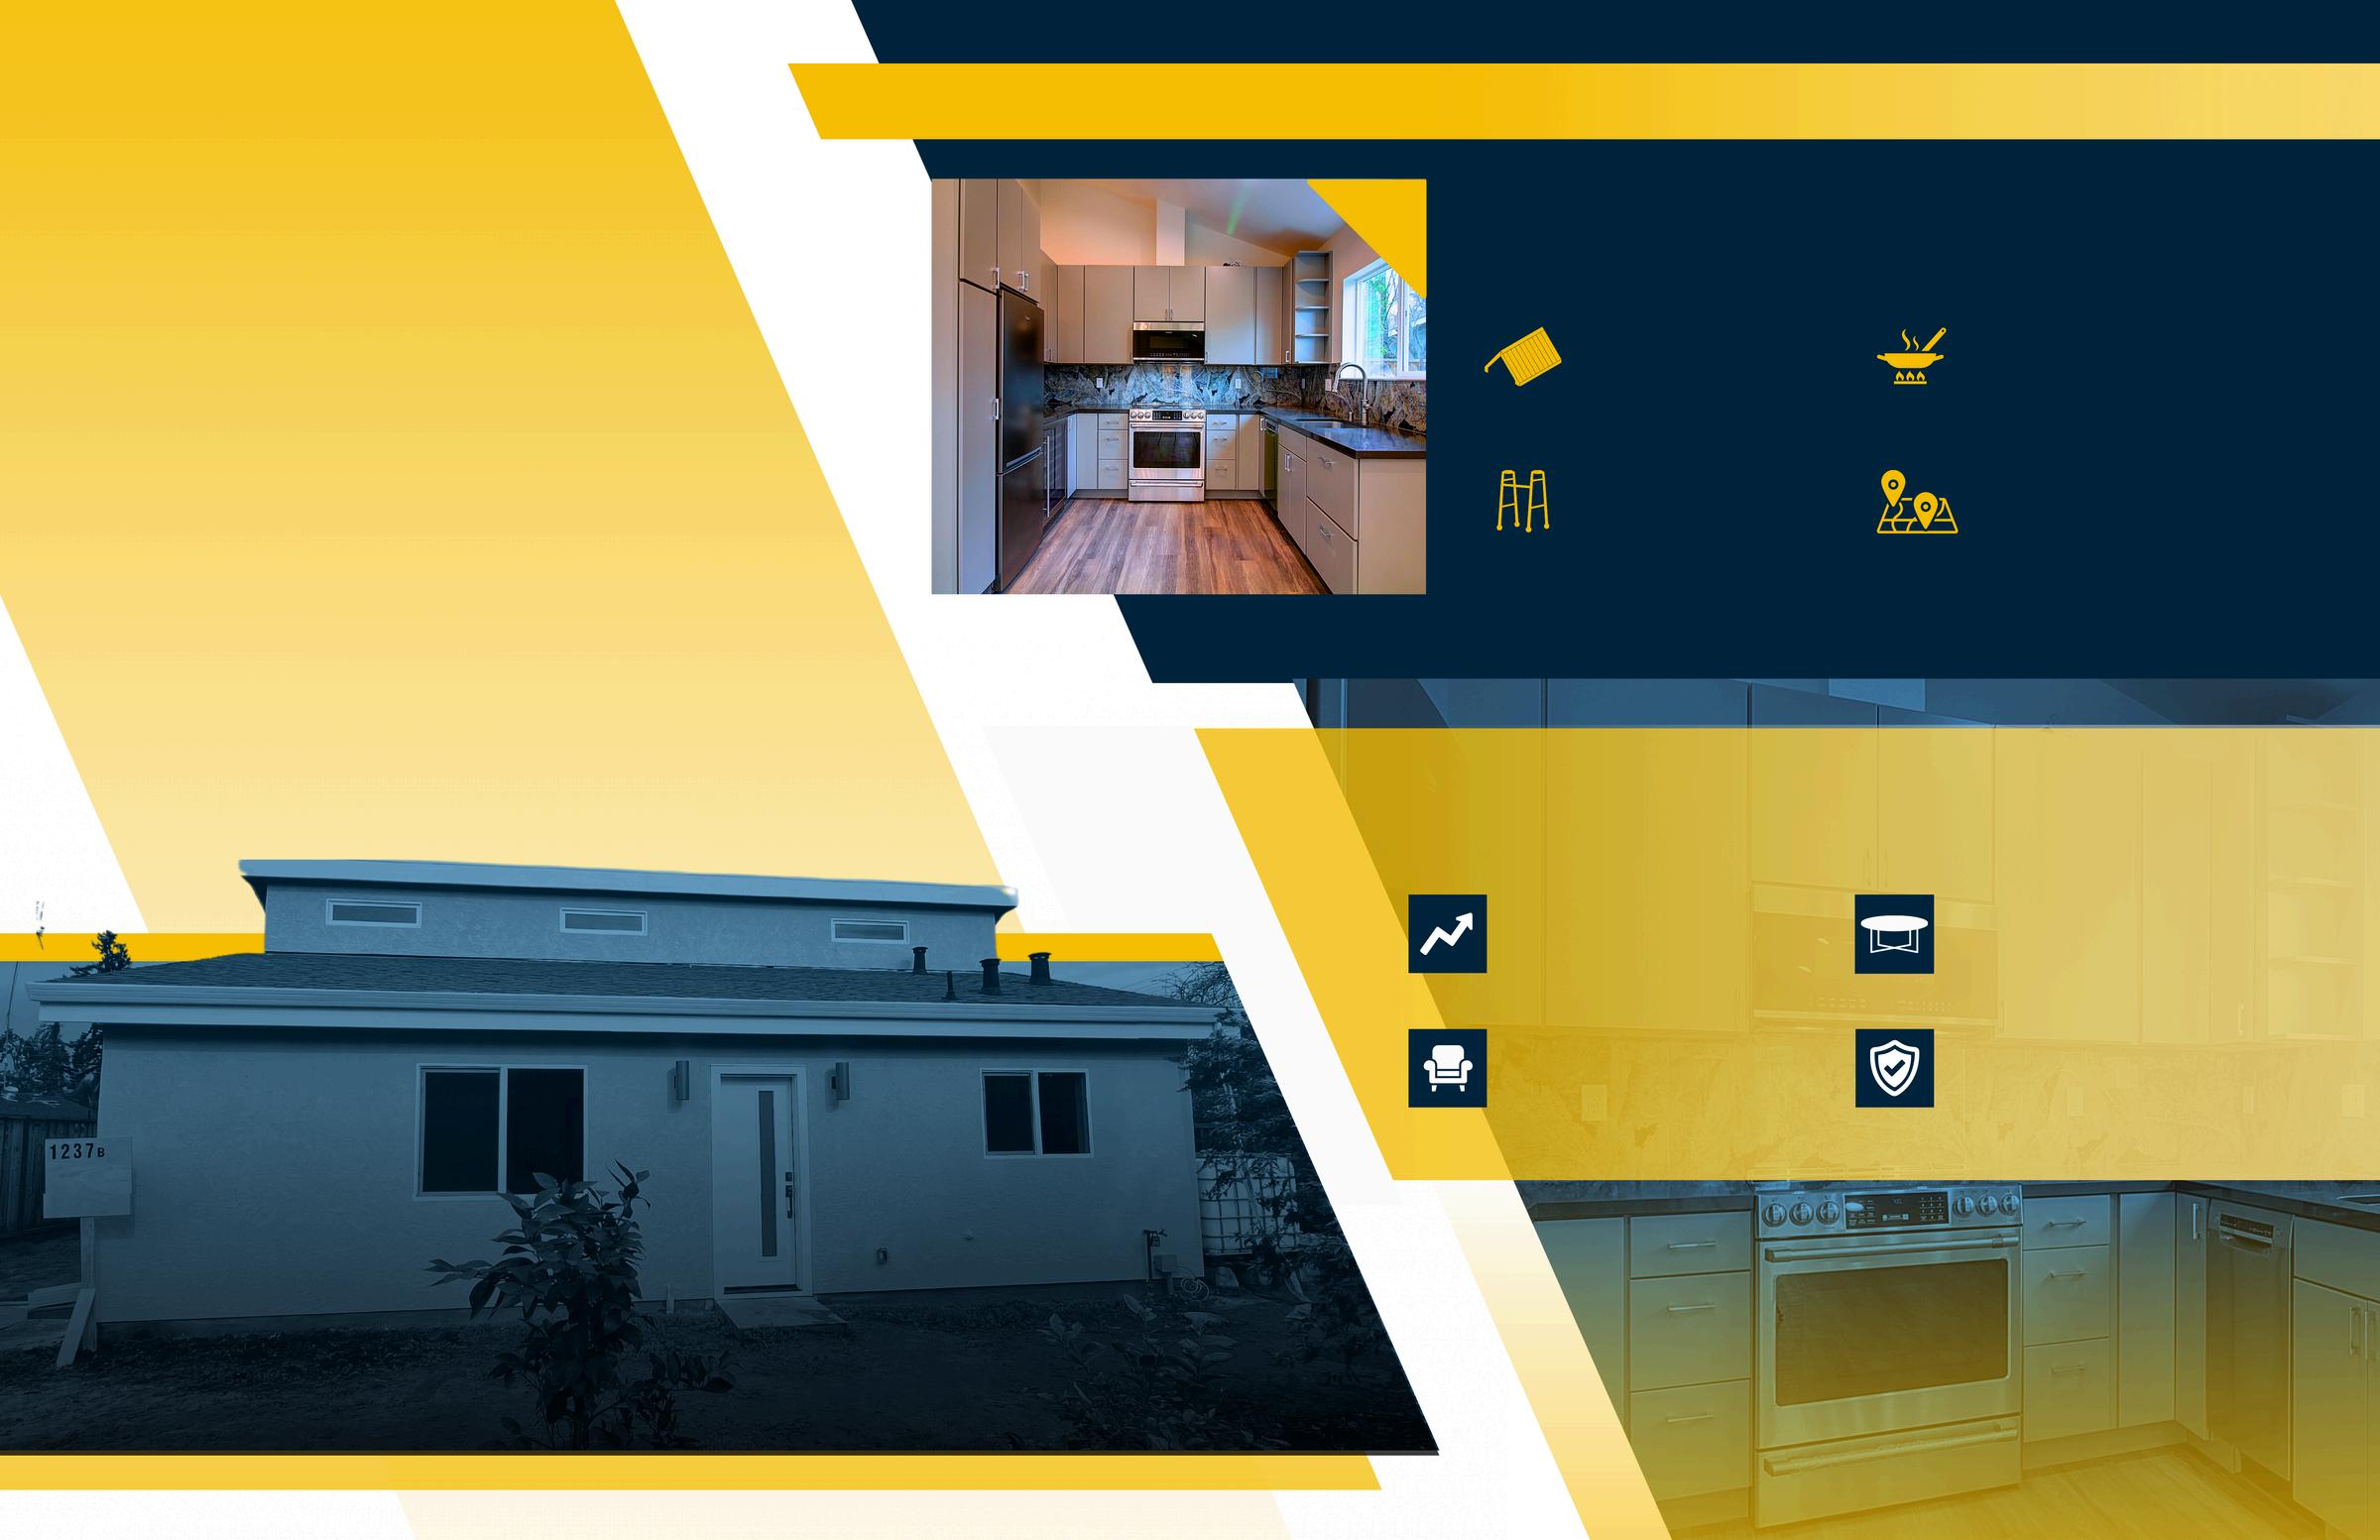
HomeRenovationsThatCanMakea BIG IMPACT AccordingtoExperts
Enhancing Property Value and Family Living Space with an Acton ADU
The Anenberg-Essert family in Campbell collaborated with Acton ADU to create a versatile, comfortable, and valuable addition to their property. This ADU project is a shining example of how a well-designed accessory dwelling unit can increase property value and serve a family’s unique needs.
GoalsandVision
The family envisioned an ADU that would function as an independent living space for family members, enhance their property’s worth, and provide seamless integration with the main home They wanted a space that balanced privacy with connectivity, feeling like a natural extension of their residence
Design and Construction Details
Constructed at 747 square feet, this ADU was designed with modern, high-quality finishes to serve both aesthetic and practical needs. Key features include:
Vaulted Ceilings
Creates a spacious, open atmosphere
Senior-Friendly Living
Safe, independent space for elderly family members
Fully Equipped Kitchen
Modern amenities for everyday convenience
Open Living Area
Multipurpose area for relaxation and entertainment
Results and Impact
The completion of the Anenberg-Essert ADU led to several valuable outcomes:
Increased Property Value
The ADU addition significantly boosted property value
Flexible Living Space
A versatile space for family, guests, or as a rental
Modern Comforts
High-end finishes and amenities enhance both function and style.
Enhanced Family Living
The ADU enriches the AnenbergEssert family’s home with both privacy and connection
VENDOR DIRECTORY
When it comes to home ownership, knowing who you can trust is crucial. That's why we've curated a select list of trusted vendors who are ready to help with your home goals.
PaloAlto
What's in the Palo Alto data?
There were 29 single-family homes for sale, providing 1.9 months of inventory. There were 31 new listings, and 6 homes sold at a median price of $4.1m. The median overbid percentage was at 96%, with an average of 51 days on the market.
There were 8 condo and townhome units for sale, providing 1.1 months of inventory. There were 7 new listings and 8 units sold at a median sale price of $1.3m. The median overbid percentage was at 94%, with an average of 64 days on the market.
Single-Family Homes
31 New Listings
6 Sold Listings
1.9 Months of Inventory
$4.1M Median Sale Price
96%
Median Sale vs List
51 Avg Days on Market
The data, sourced from InfoSparks and Trend Graphix, includes all single-family homes, condos and townhomes in the California Area above from January 2024 to January 2025. This may include preliminary data, and may vary from the time the data was gathered. All data is deemed reliable but not guaranteed. DRE# 01511642. Copyright KW Advisors Palo Alto 2025. Each office is independently owned and operated.
Condo
New Listings
1.1
Months of Inventory 94%
Median Sale vs List
Median SalesPrice
Single-Family Homes
The median sale price has increased from $3 5m last January 2024, to $4 1m as of January 2025
Condos & Townhomes
The median sale price has increased from $1 2m last January 2024, to $1 3m as of January 2025
AVGDays OntheMarket
Single-Family Homes
The average time spent on the market went up from 18 days last January 2024, to 51 days as of January 2025
Condos & Townhomes
The average time spent on the market went down from 82 days in January 2024, to 64 days as of January 2025.
Overbids
Single-Family Homes
The overbid percentage has decreased from 102% last January 2024, to 96% a year later
Condos & Townhomes
The overbid percentage has decreased from 101% last January 2024, to 94% a year later.
Redwood City
What's in the Redwood City data?
There were 24 single-family homes for sale, providing 0.9 months of inventory. There were 40 new listings, and 20 homes sold at a median price of $2m. The median overbid percentage was at 104%, with an average of 29 days on the market
There were 9 condo and townhome units for sale, providing 1.3 months of inventory. There were 10 new listings and 5 units sold at a median sale price of $780k. The median overbid percentage was at 97%, with an average of 72 days on the market.
Single-Family Homes
40 New Listings
20 Sold Listings
0.9 Months of Inventory
$2M
Median Sale Price
104%
Median Sale vs List
29 Avg Days on Market
The data, sourced from InfoSparks and Trend Graphix, includes all single-family homes, condos and townhomes in the California Area above from January 2024 to January 2025. This may include preliminary data, and may vary from the time the data was gathered. All data is deemed reliable but not guaranteed. DRE# 01511642. Copyright KW Advisors Palo Alto 2025. Each office is independently owned and operated.
New Listings
Townhomes
5
Sold Listings
1.3
Months of Inventory
$780K
Median Sale Price 97%
Median Sale vs List
72 Avg Days on Market
RedwoodCity
JANUARY 2024 - JANUARY 2025
LISTINGS FOR SALE SOLD LISTINGS
Single-Family Homes
Last 12 months, year-over-year.
Condos & Townhomes
Last 12 months, year-over-year
Median SalesPrice
Single-Family Homes
The median sale price has increased from $1 6m last January 2024, to $2m as of January 2025
Condos & Townhomes
The median sale price has decreased from $798k last January 2024, to $780k as of January 2025
AVGDays OntheMarket
Single-Family Homes
The average time spent on the market went down from 35 days last January 2024, to 29 days as of January 2025
Condos & Townhomes
The average time spent on the market went up from 58 days in January 2024, to 72 days as of January 2025.
Overbids
Single-Family Homes
The overbid percentage has increased from 95% last January 2024, to 104% a year later
Condos & Townhomes
The overbid percentage has decreased from 99% last January 2024, to 97% a year later.
Portola Valley
What's in the Porto data?
There were 9 single-family ho providing 1.8 months of inve new listings, and 6 homes so of $4.1m. The median overbi 96%, with an average of 42 d
There was no data for condo for this month.
9 New Listings
1.8 Months of Inventory
96% Median Sale vs List
6 Sold Listings
$4.1M Median Sale Price
42 Avg Days on Market
all single-family homes, January 2024 to January 2025. the data was gathered. All Copyright KW Advisors Palo
No data for this month.
Median SalesPrice
Single-Family Homes
The median sale price has increased from $2 8m last January 2024, to $4 1m as of January 2025
Condos & Townhomes
No data for this month
AVGDays OntheMarket
Single-Family Homes
The average time spent on the market went up from 3 days last January 2024, to 42 days as of January 2025
Condos & Townhomes
No data for this month
Overbids
Single-Family Homes
The overbid percentage has decreased from 116% last January 2024, to 96% a year later
Condos & Townhomes
No data for this month
Menlo
What's in the Menl
There were 13 single-family h providing 2.2 months of inve new listings, and 4 homes so of $3.2m. The median overbi 97%, with an average of 32 d
There were 8 condo and tow providing 2.7 months of inve new listings and 3 units sold price of $1.5m. The median o was at 102%, with an average market.
15 New Listings
2.2 Months of Inventory
97% Median Sale vs List
4 Sold Listings
$3.2M Median Sale Price
32 Avg Days on Market
all single-family homes, January 2024 to January 2025. the data was gathered. All Copyright KW Advisors Palo
Condo & Townhomes
7
New Listings
3 Sold Listings
2.7
Months of Inventory
$1.5M
Median Sale Price
102%
Median Sale vs List
37 Avg Days on Market
MenloPark
JANUARY 2024 - JANUARY 2025
TINGS FOR SALE SOLD LISTINGS
Family Homes
2 months, year-over-year.
s & Townhomes
2 months, year-over-year
Median SalesPrice
Single-Family Homes
The median sale price has decreased from $3 7m last January 2024, to $3 2m as of January 2025
Condos & Townhomes
The median sale price has remained the same from $1 5m last January 2024, to $1 5m as of January 2025
AVGDays OntheMarket
Single-Family Homes
The average time spent on the market went up from 31 days last January 2024, to 32 days as of January 2025
Condos & Townhomes
The average time spent on the market went up from 30 days in January 2024, to 37 days as of January 2025.
Overbids
Single-Family Homes
The overbid percentage has decreased from 100% last January 2024, to 97% a year later
Condos & Townhomes
The overbid percentage has increased from 96% last January 2024, to 102% a year later.
Atherton
What's in the Atherton data?
There were 6 single-family homes for sale, providing 1.5 months of inventory. There wer new listings, and 3 homes sold at a median p of $5.5m. The median overbid percentage wa 88%, with an average of 113 days on the mar
There was no data for condo and townhouse for this month.
6 New Listings
3 Sold Listings
1.5 Months of Inventory
$5.5M Median Sale Price
88%
Median Sale vs List
113 Avg Days on Market
CONDO
Condo & Townhomes
No data for this month.
JANUARY 2024 - JANUARY 2025
LISTINGS FOR SALE SOLD LISTINGS
Single-Family Homes
Last 12 months, year-over-year.
Condos & Townhomes
Last 12 months, year-over-year
Median SalesPrice
Single-Family Homes
The median sale price has decreased from $15 5m last January 2024, to $5 5m as of January 2025
Condos & Townhomes
The median sale price has remained the same from $0 last January 2024, to $0 as of January 2025
AVGDays OntheMarket
Single-Family Homes
The average time spent on the market went down from 145 days last January 2024, to 113 days as of January 2025
Condos & Townhomes
The average time spent on the market remained the same from 0 days in January 2024, to 0 days as of January 2025.
Overbids
Single-Family Homes
The overbid percentage has decreased from 90% last January 2024, to 88% a year later
Condos & Townhomes
The overbid percentage has remained the same from 0% last January 2024, to 0% a year later.
LosAltos
What's in the Los Altos data?
There were 8 single-family homes for sale, providing 1.1 months of inventory. There were 12 new listings, and 8 homes sold at a median price of $5.4m. The median overbid percentage was at 99%, with an average of 35 days on the market.
There were 14 condo and townhome units for sale, providing 1.6 months of inventory. There were 16 new listings and 7 units sold at a median sale price of $1.2m. The median overbid percentage was at 98%, with an average of 33 days on the market.
Single-Family Homes
12 New Listings
8 Sold Listings
1.1 Months of Inventory
$5.4M Median Sale Price
99% Median Sale vs List
35 Avg Days on Market
The data, sourced from InfoSparks and Trend Graphix, includes all single-family homes, condos and townhomes in the California Area above from January 2024 to January 2025. This may include preliminary data, and may vary from the time the data was gathered. All data is deemed reliable but not guaranteed. DRE# 01511642. Copyright KW Advisors Palo Alto 2025. Each office is independently owned and operated.
Condo & Townhomes
16
New Listings
7
Sold Listings
1.6
Months of Inventory
$1.2M
Median Sale Price 98%
Median Sale vs List
33 Avg Days on Market
LosAltos
JANUARY 2024 - JANUARY 2025
LISTINGS FOR SALE SOLD LISTINGS
Single-Family Homes
Last 12 months, year-over-year.
Condos & Townhomes
Last 12 months, year-over-year
Median SalesPrice
Single-Family Homes
The median sale price has increased from $4m last January 2024, to $5 4m as of January 2025
Condos & Townhomes
The median sale price has increased from $1 2m last January 2024, to $1 22m as of January 2025
AVGDays OntheMarket
Single-Family Homes
The average time spent on the market went up from 13 days last January 2024, to 35 days as of January 2025
Condos & Townhomes
The average time spent on the market went down from 86 days in January 2024, to 33 days as of January 2025.
Overbids
Single-Family Homes
The overbid percentage has decreased from 102% last January 2024, to 99% a year later
Condos & Townhomes
The overbid percentage has increased from 93% last January 2024, to 98% a year later.
SanJose
What's in the San Jose data?
There were 175 single-family homes for sale, providing 0.9 months of inventory. There were 296 new listings, and 179 homes sold at a median price of $1.6m. The median overbid percentage was at 105% with an average of 27 days on the market.
There were 192 condo and townhome units for sale, providing 2 months of inventory There were 186 new listings and 77 units sold at a median sale price of $775k. The median overbid percentage was at 105%, with an average of 49 days on the market.
Single-Family Homes
296 New Listings
179 Sold Listings
0.9 Months of Inventory
$1.6M Median Sale Price
105%
Median Sale vs List
27 Avg Days on Market
The data, sourced from InfoSparks and Trend Graphix, includes all single-family homes, condos and townhomes in the California Area above from January 2024 to January 2025. This may include preliminary data, and may vary from the time the data was gathered. All data is deemed reliable but not guaranteed. DRE# 01511642. Copyright KW Advisors Palo Alto 2025. Each office is independently owned and operated.
Listings
Sold Listings
2 Months of Inventory
Price 105%
Median Sale vs List 49 Avg Days on Market
SanJose
JANUARY 2024 - JANUARY 2025
Single-Family Homes
Last 12 months, year-over-year.
Condos & Townhomes
Last 12 months, year-over-year
Median SalesPrice
Single-Family Homes
The median sale price has increased from $1 5m last January 2024, to $1 6m as of January 2025
Condos & Townhomes
The median sale price has decreased from $778k last January 2024, to $775k as of January 2025
AVGDays OntheMarket
Single-Family Homes
The average time spent on the market went up from 21 days last January 2024, to 27 days as of January 2025
Condos & Townhomes
The average time spent on the market went up from 38 days in January 2024, to 49 days as of January 2025.
Overbids
Single-Family Homes
The overbid percentage has increased from 103% last January 2024, to 105% a year later
Condos & Townhomes
The overbid percentage has increased from 99% last January 2024, to 105% a year later.
Mountain View
What's in the Mountain View data?
There were 11 single-family homes for sale, providing 1.6 months of inventory. There were 15 new listings, and 7 homes sold at a median price of $2.8m. The median overbid percentage was at 109% with an average of 16 days on the market
There were 21 condo and townhome units for sale, providing 1.3 months of inventory. There were 32 new listings and 10 units sold at a median sale price of $1.3m. The median overbid percentage was at 109%, with an average of 10 days on the market.
Single-Family Homes
15 New Listings
7 Sold Listings
1.6 Months of Inventory
$2.8M Median Sale Price
109%
Median Sale vs List
16 Avg Days on Market
The data, sourced from InfoSparks and Trend Graphix, includes all single-family homes, condos and townhomes in the California Area above from January 2024 to January 2025. This may include preliminary data, and may vary from the time the data was gathered. All data is deemed reliable but not guaranteed. DRE# 01511642. Copyright KW Advisors Palo Alto 2025. Each office is independently owned and operated.
32
New Listings
10
Sold Listings
1.3
Months of Inventory
$1.3M
Median Sale Price 109%
Median Sale vs List 10 Avg Days on Market
JANUARY 2024 - JANUARY 2025
TINGS FOR SALE SOLD LISTINGS
Family Homes
2 months, year-over-year.
s & Townhomes
2 months, year-over-year
Median SalesPrice
Single-Family Homes
The median sale price has increased from $2 3m last January 2024, to $2 8m as of January 2025
Condos & Townhomes
The median sale price has decreased from $1 4m last January 2024, to $1 3m as of January 2025
AVGDays OntheMarket
Single-Family Homes
The average time spent on the market went down from 25 days last January 2024, to 16 days as of January 2025
Condos & Townhomes
The average time spent on the market went down from 28 days in January 2024, to 10 days as of January 2025.
Overbids
Single-Family Homes
The overbid percentage has increased from 101% last January 2024, to 109% a year later
Condos & Townhomes
The overbid percentage has increased from 102% last January 2024, to 109% a year later.
SanMateo County
What's in the San Mateo County data?
There were 280 single-family homes for sale, providing 0.9 months of inventory. There were 323 new listings, and 155 homes sold at a median price of $1.8m. The median overbid percentage was at 100 4%, with an average of 39 days on the market.
There were 175 condo and townhome units for sale, providing 1.8 months of inventory. There were 133 new listings and 46 units sold at a median sale price of $919k. The median overbid percentage was at 98.6%, with an average of 57 days on the market
e-Family Homes
323 New Listings
155 Sold Listings
0.9 Months of Inventory
$1.8M Median Sale Price
100.4%
Median Sale vs List
39 Avg Days on Market
sourced from InfoSparks and Trend Graphix, includes all single-family homes, townhomes in the California Area above from January 2024 to January 2025. include preliminary data, and may vary from the time the data was gathered. All ed reliable but not guaranteed. DRE# 01511642. Copyright KW Advisors Palo Alto 2025. Each office is independently owned and operated.
133
New Listings
46
Sold Listings
1.8
Months of Inventory
$919K
Median Sale Price 98.6%
Median Sale vs List 57 Avg Days on Market
SanMateo
JANUARY 2024 - JANUARY 2025
LISTINGS FOR SALE SOLD LISTINGS
Single-Family Homes
Last 12 months, year-over-year.
Condos & Townhomes
Last 12 months, year-over-year
Median SalesPrice
Single-Family Homes
The median sale price has decreased from $1 84m last January 2024, to $1 8m as of January 2025
Condos & Townhomes
The median sale price has increased from $772k last January 2024, to $919k as of January 2025
AVGDays OntheMarket
Single-Family Homes
The average time spent on the market went down from 44 days last January 2024, to 39 days as of January 2025
Condos & Townhomes
The average time spent on the market went down from 68 days in January 2024, to 57 days as of January 2025.
Overbids
Single-Family Homes
The overbid percentage has increased from 100% last January 2024, to 100 4% a year later
Condos & Townhomes
The overbid percentage has decreased from 99.6% last January 2024, to 98.6% a year later.
Sant Cou
What's in t
County da
There were 492 providing 0.7 mo new listings, and price of $1.8m. T was at 101 4%, w market.
There were 428 sale, providing 1 were 463 new lis median sale pric percentage was days on the mar
678 New Listings
371 Sold Listings
0.7 Months of Inventory
$1.8M Median Sale Price
101.4% Median Sale vs List
28 Avg Days on Market
homes, 2025. All Palo
463
New Listings
1.4 Months of Inventory
Listings
Median SalesPrice
Single-Family Homes
The median sale price has increased from $1 7m last January 2024, to $1 8m as of January 2025
Condos & Townhomes
The median sale price has decreased from $922k last January 2024, to $920k as of January 2025
AVGDays OntheMarket
Single-Family Homes
The average time spent on the market went up from 25 days last January 2024, to 28 days as of January 2025
Condos & Townhomes
The average time spent on the market went up from 39 days in January 2024, to 45 days as of January 2025.
Overbids
Single-Family Homes
The overbid percentage has increased from 100 8% last January 2024, to 101 4% a year later
Condos & Townhomes
The overbid percentage has remained the same from 100% last January 2024, to 100% a year later.
Monter County
What's in the Mon data?
There were 334 single-family providing 3 months of invent new listings, and 127 homes price of $965k. The median o was at 94%, with an average market.
There were 46 condo and tow sale, providing 1.8 months of were 27 new listings and 19 sale price of $660k. The med percentage was at 96%, with days on the market
185 New Listings
3 Months of Inventory
94% Median Sale vs List
127 Sold Listings
$965K Median Sale Price
48 Avg Days on Market
all single-family homes, January 2024 to January 2025. the data was gathered. All Copyright KW Advisors Palo
New Listings
1.8
Sold Listings
Months of Inventory $660K
Median Sale Price 96%
Median Sale vs List 31 Avg Days on Market 19
Median SalesPrice
Single-Family Homes
The median sale price has increased from $828k last January 2024, to $965k as of January 2025
Condos & Townhomes
The median sale price has decreased from $735k last January 2024, to $660k as of January 2025
AVGDays OntheMarket
Single-Family Homes
The average time spent on the market remained the same from 48 days last January 2024, to 48 days as of January 2025
Condos & Townhomes
The average time spent on the market went down from 57 days in January 2024, to 31 days as of January 2025.
Overbids
Single-Family Homes
The overbid percentage has remained the same from 94% last January 2024, to 94% a year later
Condos & Townhomes
The overbid percentage has increased from 95% last January 2024, to 96% a year later.
SantaC County
What's in the Sant County data?
There were 213 single-family providing 2.7 months of inve new listings, and 68 homes s of $1.2m. The median overbi 96%, with an average of 39 d
There were 75 condo and tow sale, providing 2.7 months of were 53 new listings and 21 sale price of $819k. The med percentage was at 97%, with days on the market.
139 New Listings
2.7 Months of Inventory
96% Median Sale vs List
68 Sold Listings
$1.2M Median Sale Price
39 Avg Days on Market
all single-family homes, January 2024 to January 2025. the data was gathered. All Copyright KW Advisors Palo
New Listings
2.7
Months of Inventory
Sold Listings
$819K
Median Sale Price 97%
Median Sale vs List 40 Avg Days on Market 21
Median SalesPrice
Single-Family Homes
The median sale price has increased from $1 1m last January 2024, to $1 2m as of January 2025
Condos & Townhomes
The median sale price has increased from $729k last January 2024, to $819k as of January 2025
AVGDays OntheMarket
Single-Family Homes
The average time spent on the market went down from 50 days last January 2024, to 39 days as of January 2025
Condos & Townhomes
The average time spent on the market went up from 38 days in January 2024, to 40 days as of January 2025.
Overbids
Single-Family Homes
The overbid percentage has increased from 95% last January 2024, to 96% a year later
Condos & Townhomes
The overbid percentage has remained the same from 97% last January 2024, to 97% a year later.
East PaloAlto
What's in the East Palo Alto data?
There were 6 single-family homes for sale, providing 3 months of inventory. There were 6 new listings, and 1 home sold at a median price of $1.2m. The median overbid percentage was at 91%, with an average of 84 days on the market
There were 2 condo and townhome units for sale, providing 2 months of inventory. There were 0 new listings and 0 units sold at a median sale price of $0. The median overbid percentage was at 0%, with an average of 0 days on the market.
6 New Listings
1 Sold Listing
3 Months of Inventory
$1.2M Median Sale Price
91% Median Sale vs List
84 Avg Days on Market
New Listings 2
Months of Inventory
Sold Listings
Median Sale Price
Median Sale vs List
Avg Days on Market
Median SalesPrice
Single-Family Homes
The median sale price has increased from $900k last January 2024, to $1 2m as of January 2025
Condos & Townhomes
The median sale price has decreased from $775k last January 2024, to $0 as of January 2025
AVGDays OntheMarket
Single-Family Homes
The average time spent on the market went up from 11 days last January 2024, to 84 days as of January 2025
Condos & Townhomes
The average time spent on the market went down from 72 days in January 2024, to 0 days as of January 2025.
Overbids
Single-Family Homes
The overbid percentage has decreased from 106% last January 2024, to 91% a year later
Condos & Townhomes
The overbid percentage has decreased from 91% last January 2024, to 0% a year later.
Sunnyvale
What's in the Sunnyvale data?
There were 16 single-family homes for sale, providing 0.9 months of inventory. There were 29 new listings, and 10 homes sold at a median price of $2.7m. The median overbid percentage was at 118% with an average of 8 days on the market.
There were 24 condo and townhome units for sale, providing 1.1 months of inventory. There were 42 new listings and 11 units sold at a median sale price of $1.4m. The median overbid percentage was at 104%, with an average of 22 days on the market.
Single-Family Homes
29 New Listings
10 Sold Listings
0.9 Months of Inventory
$2.7M Median Sale Price
118%
Median Sale vs List
8 Avg Days on Market
The data, sourced from InfoSparks and Trend Graphix, includes all single-family homes, condos and townhomes in the California Area above from January 2024 to January 2025. This may include preliminary data, and may vary from the time the data was gathered. All data is deemed reliable but not guaranteed. DRE# 01511642. Copyright KW Advisors Palo Alto 2025. Each office is independently owned and operated.
Condo & Townhomes
42
New Listings
11
Sold Listings
1.1
Months of Inventory
$1.4M
Median Sale Price
104%
Median Sale vs List
22 Avg Days on Market
Sunnyvale
JANUARY 2024 - JANUARY 2025
LISTINGS FOR SALE SOLD LISTINGS
Single-Family Homes
Last 12 months, year-over-year.
Condos & Townhomes
Last 12 months, year-over-year
Median SalesPrice
Single-Family Homes
The median sale price has increased from $2 3m last January 2024, to $2 7m as of January 2025
Condos & Townhomes
The median sale price has increased from $970k last January 2024, to $1 4m as of January 2025
AVGDays OntheMarket
Single-Family Homes
The average time spent on the market went down from 12 days last January 2024, to 8 days as of January 2025
Condos & Townhomes
The average time spent on the market went down from 33 days in January 2024, to 22 days as of January 2025.
Overbids
Single-Family Homes
The overbid percentage has increased from 107% last January 2024, to 118% a year later
Condos & Townhomes
The overbid percentage has remained the same from 104% last January 2024, to 104% a year later.
SantaClara City
What's in the Santa Clara City data?
There were 15 single-family homes for sale, providing 0.6 months of inventory. There were 37 new listings, and 20 homes sold at a median price of $1.7m. The median overbid percentage was at 106%, with an average of 15 days on the market
There were 28 condo and townhome units for sale, providing 1.3 months of inventory. There were 37 new listings and 11 units sold at a median sale price of $755k. The median overbid percentage was at 101%, with an average of 46 days on the market.
Single-Family Homes
37 New Listings
20 Sold Listings
0.6 Months of Inventory
$1.7M Median Sale Price
106%
Median Sale vs List
15 Avg Days on Market
The data, sourced from InfoSparks and Trend Graphix, includes all single-family homes, condos and townhomes in the California Area above from January 2024 to January 2025. This may include preliminary data, and may vary from the time the data was gathered. All data is deemed reliable but not guaranteed. DRE# 01511642. Copyright KW Advisors Palo Alto 2025. Each office is independently owned and operated.
37
New Listings
11
Sold Listings
1.3
Months of Inventory
$755K
Median Sale Price 101%
Median Sale vs List
46 Avg Days on Market
SantaClaraCity
JANUARY 2024 - JANUARY 2025
LISTINGS FOR SALE SOLD LISTINGS
ngle-Family Homes st 12 months, year-over-year.
ondos & Townhomes st 12 months, year-over-year
Median SalesPrice
Single-Family Homes
The median sale price has increased from $1 7m last January 2024, to $1 79m as of January 2025
Condos & Townhomes
The median sale price has decreased from $1 1m last January 2024, to $755k as of January 2025
AVGDays OntheMarket
Single-Family Homes
The average time spent on the market went down from 19 days last January 2024, to 15 days as of January 2025
Condos & Townhomes
The average time spent on the market went up from 19 days in January 2024, to 46 days as of January 2025.
Overbids
Single-Family Homes
The overbid percentage has decreased from 109% last January 2024, to 106% a year later
Condos & Townhomes
The overbid percentage has decreased from 102% last January 2024, to 101% a year later.
Saratoga
What's in the Saratoga data
There were 11 single-family homes for sal providing 0.6 months of inventory. There w new listings, and 18 homes sold at a medi of $4.2m. The median overbid percentage 104%, with an average of 14 days on the m
There were 6 condo and townhome units f providing 2 months of inventory. There we new listings and 0 units sold at a median s price of $0. The median overbid percentag at 0%, with an average of 0 days on the ma
19 New Listings
0.6 Months of Inventory
18 Sold Listings
$4.2M Median Sale Price
104%
Median Sale vs List
14 Avg Days on Market
Trend Graphix, includes all single-family homes, Area above from January 2024 to January 2025. may vary from the time the data was gathered. All guaranteed. DRE# 01511642. Copyright KW Advisors Palo Alto 2025. Each office is independently owned and operated.
Condo & Townhomes
5
New Listings
2 Months of Inventory $0
Median Sale Price 0%
Median Sale vs List 0 Avg Days on Market 0 Sold Listings
JANUARY 2024 - JANUARY 2025
y Homes ths, year-over-year.
ownhomes ths, year-over-year
Median SalesPrice
Single-Family Homes
The median sale price has increased from $4 1m last January 2024, to $4 2m as of January 2025
Condos & Townhomes
The median sale price has decreased from $960k last January 2024, to $0 as of January 2025
AVGDays OntheMarket
Single-Family Homes
The average time spent on the market went down from 21 days last January 2024, to 14 days as of January 2025
Condos & Townhomes
The average time spent on the market went down from 29 days in January 2024, to 0 days as of January 2025.
Overbids
Single-Family Homes
The overbid percentage has increased from 100% last January 2024, to 104% a year later
Condos & Townhomes
The overbid percentage has decreased from 96% last January 2024, to 0% a year later.