Jaideep Singh - October 2024 Market Report Fremont
Fremont area
Milpitas
Jump to Milpitas Report
Fremont
Jump to Fremont City Report
Newark
Jump to Newark Report
Union City
Jump to Union City Report
Hayward
Jump to Hayward Report
Castro Valley
Jump to Castro Valley Report
San Leandro
Jump to San Leandro Report
Tri-Cities
(Fremont, Newark & Union City)
Jump to Tri-Cities Report
Pleasanton
Jump to Pleasanton Report
San Ramon
Jump to San Ramon Report
Livermore
Jump to Livermore Report
Cupertino
Jump to Cupertino Report
Oakland
Jump to Oakland Report
What’syourhome reallyworthin today’smarket?
That's the question you should be asking yourself.
Our market is incredibly diverse and rapidly changing. Values vary not just by neighborhood but by street. Your home isn't necessarily worth what your neighbors' home is. It's the current market that sets the value of your home.
So, do you know what your home is worth today's market?
Icanhelp
Contact me for a confidential, no obligation assessment of your home's value.
ThisIstheSweetSpotHomebuyers HaveBeenWaitingFor
After months of sitting on the sidelines, many homebuyers who were priced out by high mortgage rates and affordability challenges finally have an opportunity to make their move. With rates trending down, today’s market is a sweet spot for buyers— and it’s one that may not last long.
So, if you’ve put your own move on the back burner, here’s why maybe you shouldn’t delay your plans any longer.
As you weigh your options and decide if you should buy now or wait, ask yourself this: What do you think everyone else is going to do?
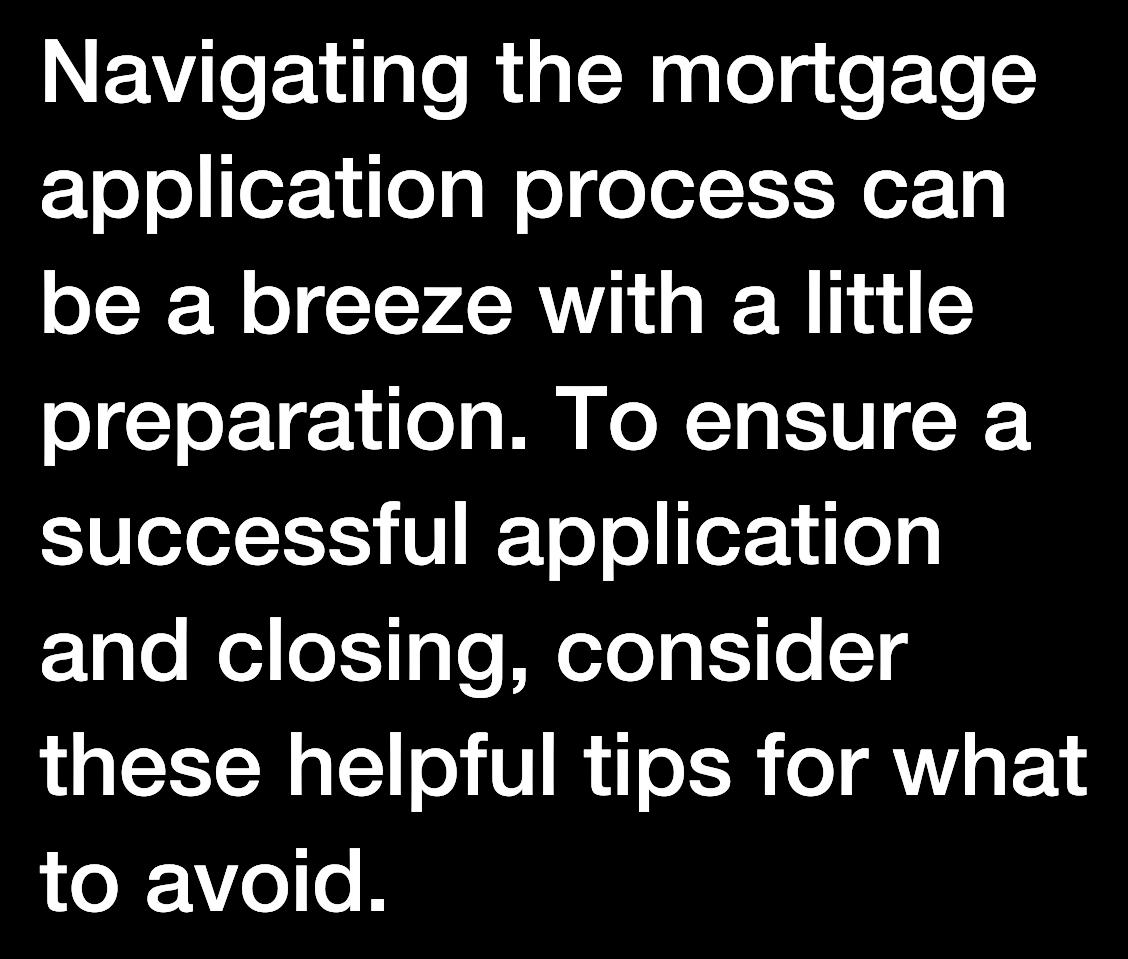
Smart Strategies for a Mortgage Application
Avoid paying off debts or collections without professional advice.
Don't have your credit report pulled too many times - this can hurt your credit score. 3 4 5 6 1 2
Always consult your mortgage professional before making large financial moves. Use verified funds for deposits to prevent closing delays.
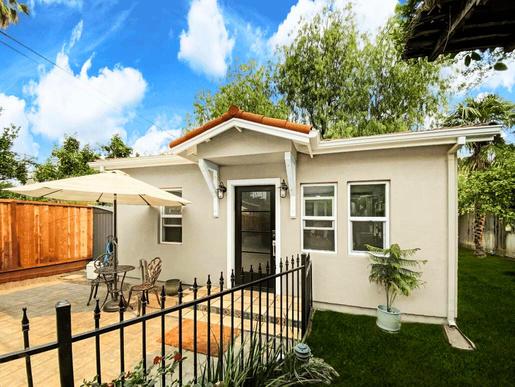
HomeRenovationsThatCanMakea BIG IMPACT AccordingtoExperts
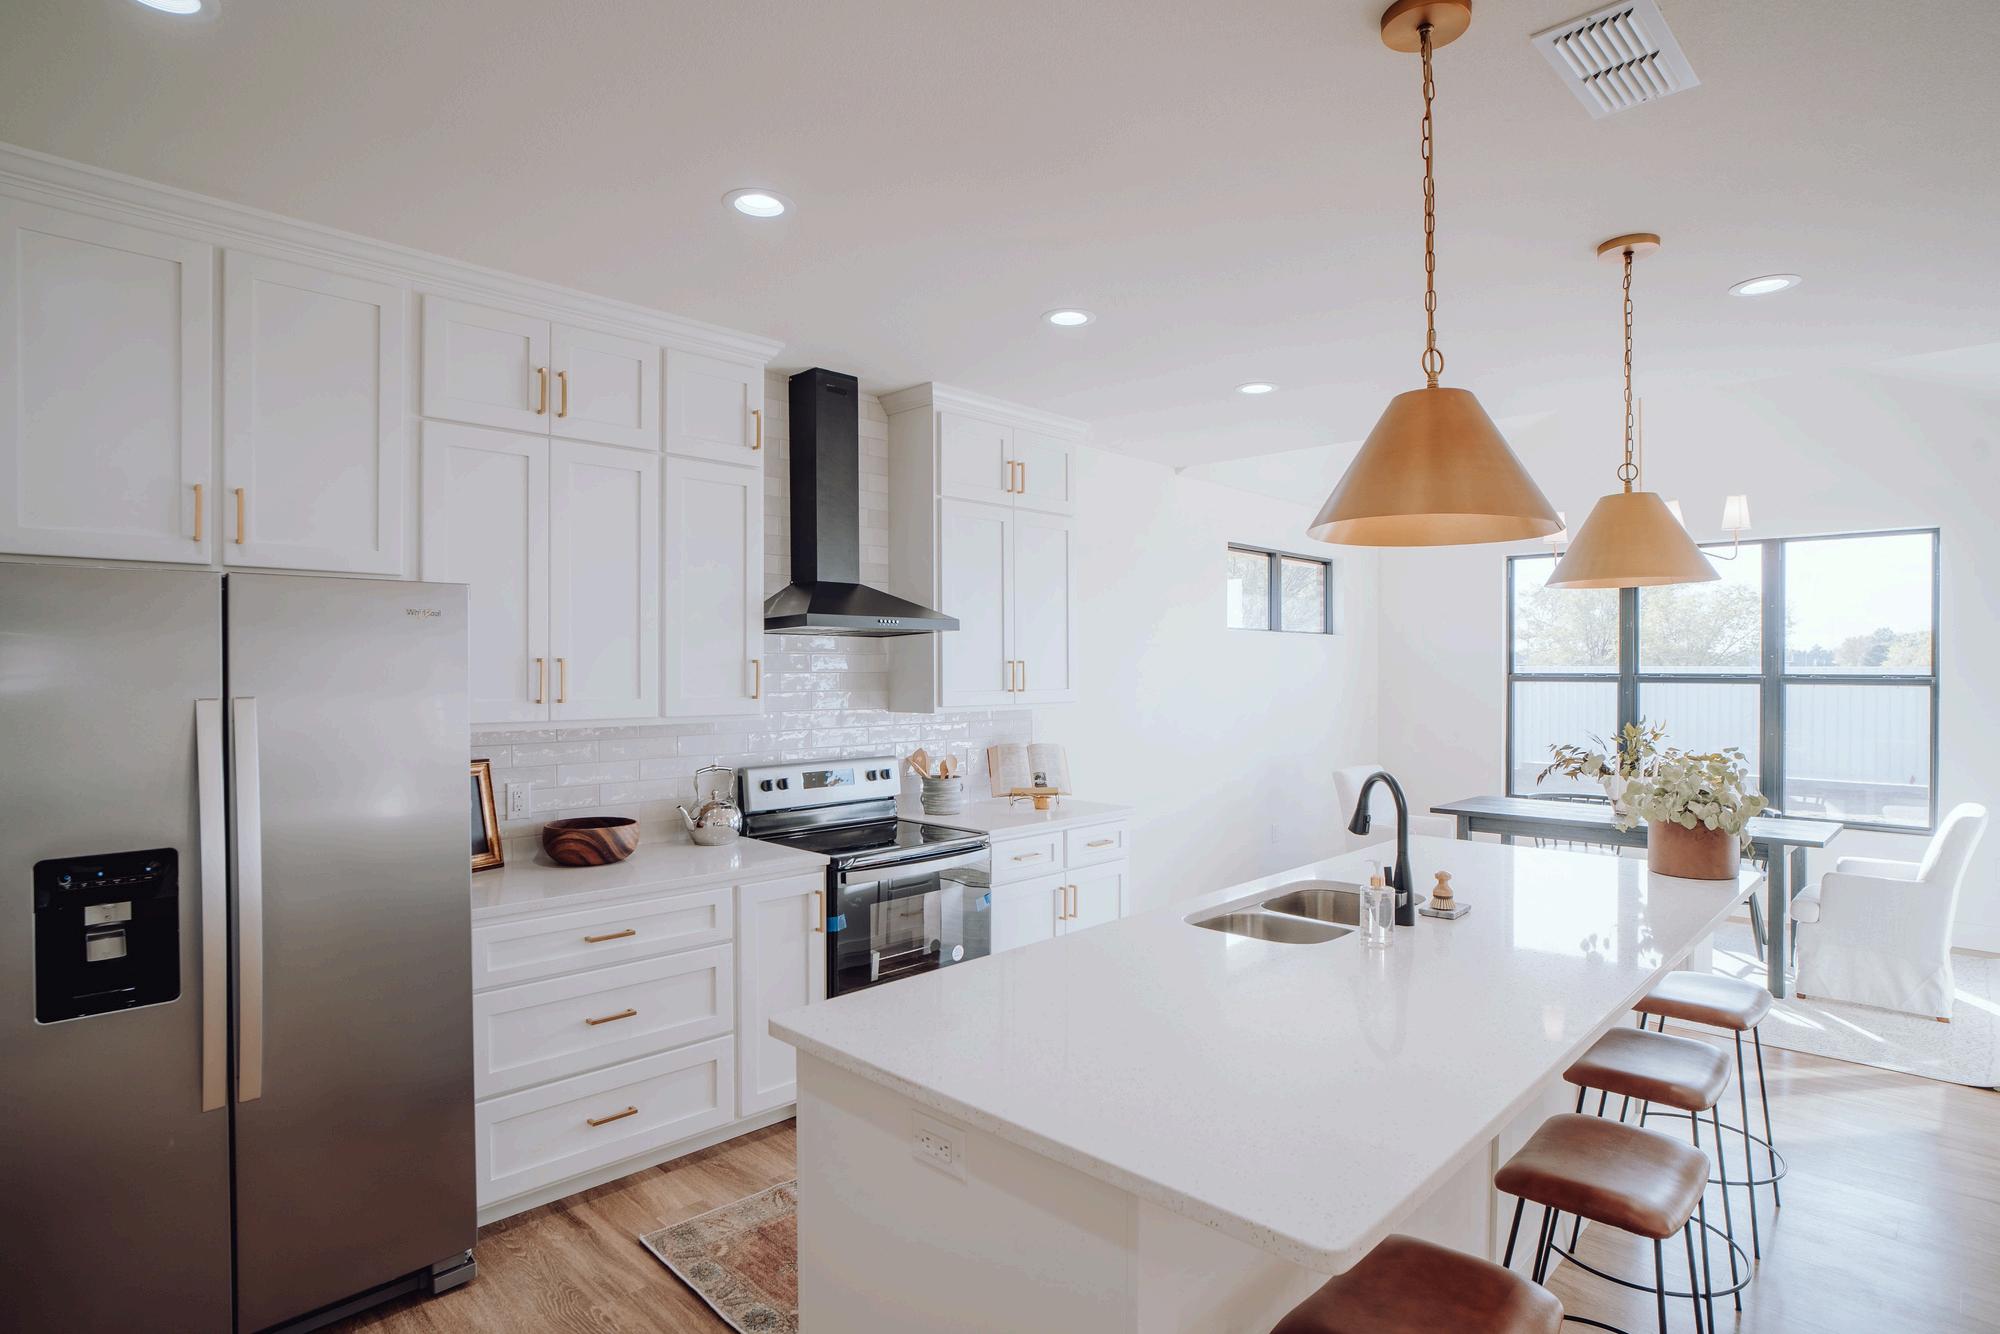
Adding an Accessory Dwelling Unit (ADU) boosts your property value and adds living space. Choose the right partner to ensure your project is smooth and successful.
Choose Expertise Over Inexperience
Building an ADU needs more than construction skills; it requires knowledge of local rules and design. Trust Acton ADU's expertise to avoid mistakes and ensure a seamless process.
Verify
Your ADU Partner’s Credentials
Check that your contractor knows ADU design and local rules to avoid errors. Choose someone with a strong track record in ADU projects.
Conduct Thorough Site Assessments
Not every property suits ADUs. Use experts for site assessments to avoid costly mistakes.
Put Your Trust in The Right Company
Acton ADU has been successfully helping homeowners achieve their property goals for over 35 years. Making the wrong choice in the ADU market can lead to serious financial setbacks. ADUs aren't always ways, but Acton ADU can make it feel that way.
START YOUR ADU PROJECT RIGHT
VENDOR DIRECTORY
When it comes to home ownership, knowing who you can trust is crucial. That's why we've curated a select list of trusted vendors who are ready to help with your home goals.
Milpitas
What's in the Milpitas data?
There were 44 single-family homes for sale, providing 3 months of inventory. There were 19 new listings, and 17 homes sold at a median price of $1.6m. The median overbid percentage was at 104%, with an average of 17 days on the market.
There were 62 condo and townhome units for sale, providing 2.7 months of inventory. There were 30 new listings and 22 units sold at a median sale price of $1m. The median overbid percentage was at 103.5%, with an average of 17 days on the market.
mily Homes tory
17 Sold Listings
$1.6M Median Sale Price
9% List
17 Avg Days on Market
Broker Metrics, includes all single-family homes, condos and California Area from September 2023 to September 2024. This may and may vary from the time the data was gathered. All data is guaranteed. DRE# 01345026. Copyright KW Advisors Fremont 2024. Each office is independently owned and operated.
Condo & Townhomes
30
New Listings
22 Sold Listings
2.7
Months of Inventory
$1M
Median Sale Price
103.5%
Median Sale vs List 17 Avg Days on Market
SEPTEMBER 2023 - SEPTEMBER 2024
Single-Family Homes
Last 12 months, year-over-year.
Condos & Townhomes
Last 12 months, year-over-year
Median SalesPrice
Single-Family Homes
The median sale price has increased from $1 4m last September 2023, to $1 6m as of September 2024
Condos & Townhomes
The median sale price has decreased from $1 1m last September 2023, to $1m as of September 2024
AVGDays OntheMarket
Single-Family Homes
The average time spent on the market went up from 14 days last September 2023, to 17 days as of September 2024
Condos & Townhomes
The average time spent on the market went down from 29 days in September 2023, to 17 days as of September 2024.
Overbids
Single-Family Homes
The overbid percentage has increased from 103 8% last September 2023, to 104% a year later
Condos & Townhomes
The overbid percentage has increased from 102.6% last September 2023, to 103.5% a year later.
Fremont
What's in the Fremont data?
There were 183 single-family homes for sale, providing 1.2 months of inventory. There were 96 new listings, and 73 homes sold at a median price of $1.7m. The median overbid percentage was at 103.2%, with an average of 16 days on the market.
There were 152 condo and townhome units for sale, providing 1.9 months of inventory. There were 65 new listings and 40 units sold at a median sale price of $910k. The median overbid percentage was at 102.3%, with an average of 25 days on the market.
SFH
Single-Family Homes
96 New Listings
73 Sold Listings
1.2 Months of Inventory
$1.7M
Median Sale Price
103.2%
Median Sale vs List
16 Avg Days on Market
The data, sourced from Broker Metrics, includes all single-family homes, condos and townhomes in the California Area from September 2023 to September 2024. This may include preliminary data, and may vary from the time the data was gathered. All data is deemed reliable but not guaranteed. DRE# 01345026. Copyright KW Advisors Fremont 2024. Each office is independently owned and operated.
65 New Listings
1.9 Months of Inventory $910K Median Sale Pric 102.3% Median Sale vs List 25 Avg Days on Marke 40 Sold Listing
SEPTEMBER 2023 - SEPTEMBER 2024
mes year-over-year. omes , year-over-year
Median SalesPrice
Single-Family Homes
The median sale price has increased from $1 6m last September 2023, to $1 7m as of September 2024
Condos & Townhomes
The median sale price has increased from $885k last September 2023, to $910k as of September 2024
AVGDays OntheMarket
Single-Family Homes
The average time spent on the market remained the same from 16 days last September 2023, to 16 days as of September 2024
Condos & Townhomes
The average time spent on the market went up from 19 days in September 2023, to 25 days as of September 2024.
Overbids
Single-Family Homes
The overbid percentage has decreased from 105 3% last September 2023, to 103 2% a year later
Condos & Townhomes
The overbid percentage has increased from 102% last September 2023, to 102.3% a year later.
Newark
What's in the Newark data?
There were 62 single-family homes for sale, providing 0.8 months of inventory. There were 31 new listings, and 23 homes sold at a median price of $1.3m. The median overbid percentage was at 101.6%, with an average of 19 days on the market.
There were 38 condo and townhome units for sale, providing 2.3 months of inventory. There were 19 new listings and 8 units sold at a median sale price of $1m. The median overbid percentage was at 101.6%, with an average of 28 days on the market.
Condo & Townhomes
19
New Listings
8 Sold Listings
2.3
Months of Inventory
$1M
Median Sale Price
101.6%
Median Sale vs List
28 Avg Days on Market
SEPTEMBER 2023 - SEPTEMBER 2024
LISTINGS FOR SALE
Single-Family Homes
Last 12 months, year-over-year.
Condos & Townhomes
Last 12 months, year-over-year
Median SalesPrice
Single-Family Homes
The median sale price has increased from $1 31m last September 2023, to $1 35m as of September 2024
Condos & Townhomes
The median sale price has increased from $665k last September 2023, to $1m as of September 2024
AVGDays OntheMarket
Single-Family Homes
The average time spent on the market went up from 7 days last September 2023, to 19 days as of September 2024
Condos & Townhomes
The average time spent on the market went up from 12 days in September 2023, to 28 days as of September 2024.
Overbids
Single-Family Homes
The overbid percentage has decreased from 106 1% last September 2023, to 101 6% a year later
Condos & Townhomes
The overbid percentage has decreased from 104.1% last September 2023, to 101.6% a year later.
UnionCity
What's in the Union City data?
There were 58 single-family homes for sale, providing 1.5 months of inventory. There were 26 new listings, and 24 homes sold at a median price of $1.4m. The median overbid percentage was at 99.6%, with an average of 20 days on the market.
There were 29 condo and townhome units for sale, providing 3 months of inventory. There were 13 new listings and 6 units sold at a median sale price of $887k. The median overbid percentage was at 100.3%, with an average of 14 days on the market.
% List
Broker Metrics, includes all single-family homes, condos and California Area from September 2023 to September 2024. This may and may vary from the time the data was gathered. All data is guaranteed. DRE# 01345026. Copyright KW Advisors Fremont 2024. Each office is independently owned and operated. mily Homes tory
24 Sold Listings
$1.4M Median Sale Price
20 Avg Days on Market
New Listings
Median Sale vs List 14 Avg Days on Market 6 Sold Listings
3 Months of Inventory $887K Median Sale Price 100.3%
UnionCity
SEPTEMBER 2023 - SEPTEMBER 2024 LISTINGS FOR SALE
gle-Family Homes
t 12 months, year-over-year.
ndos & Townhomes
t 12 months, year-over-year
Median SalesPrice
Single-Family Homes
The median sale price has decreased from $1 427m last September 2023, to $1 425m as of September 2024
Condos & Townhomes
The median sale price has increased from $690k last September 2023, to $887k as of September 2024
AVGDays OntheMarket
Single-Family Homes
The average time spent on the market went up from 16 days last September 2023, to 20 days as of September 2024
Condos & Townhomes
The average time spent on the market remained the same from 14 days in September 2023, to 14 days as of September 2024.
Overbids
Single-Family Homes
The overbid percentage has decreased from 106 8% last September 2023, to 99 6% a year later
Condos & Townhomes
The overbid percentage has decreased from 103.7% last September 2023, to 100.3% a year later.
He-Family
Homes
tings
59 Sold Listings
4 of Inventory
$950K Median Sale Price
2.5% Sale vs List
23 Avg Days on Market
sourced from Broker Metrics, includes all single-family homes, condos and in the California Area from September 2023 to September 2024. This may minary data, and may vary from the time the data was gathered. All data is reliable but not guaranteed. DRE# 01345026. Copyright KW Advisors Fremont 2024. Each office is independently owned and operated.
New Listings 3 Months of Inventory 99.6%
Median Sale vs List
Median SalesPrice
Single-Family Homes
The median sale price has decreased from $970k last September 2023, to $950k as of September 2024
Condos & Townhomes
The median sale price has decreased from $727k last September 2023, to $724k as of September 2024
AVGDays OntheMarket
Single-Family Homes
The average time spent on the market went up from 19 days last September 2023, to 23 days as of September 2024
Condos & Townhomes
The average time spent on the market remained the same from 40 days in September 2023, to 40 days as of September 2024.
Overbids
Single-Family Homes
The overbid percentage has decreased from 104 9% last September 2023, to 102 5% a year later
Condos & Townhomes
The overbid percentage has decreased from 101.5% last September 2023, to 99.6% a year later.
Castro Valley
What's in the Cast data?
There were 94 single-family h providing 1.5 months of inve new listings, and 24 homes s of $1.1m. The median overbi 102 6%, with an average of 1
There were 14 condo and tow sale, providing 1.8 months of were 4 new listings and 5 un sale price of $935k. The med percentage was at 96.8%, wi days on the market.
single-family homes, condos and September 2024. This may was gathered. All data is KW Advisors Fremont
New Listings
1.8 Months of Inventory 96.8%
Median Sale vs List
Median SalesPrice
Single-Family Homes
The median sale price has increased from $1 18m last September 2023, to $1 19m as of September 2024
Condos & Townhomes
The median sale price has increased from $420k last September 2023, to $935k as of September 2024
AVGDays OntheMarket
Single-Family Homes
The average time spent on the market went down from 21 days last September 2023, to 16 days as of September 2024
Condos & Townhomes
The average time spent on the market went up from 28 days in September 2023, to 35 days as of September 2024.
Overbids
Single-Family Homes
The overbid percentage has decreased from 107 1% last September 2023, to 102 6% a year later
Condos & Townhomes
The overbid percentage has increased from 93.5% last September 2023, to 96.8% a year later.
San Leandro
What's in the San Leandro data?
There were 115 single-family homes for sale, providing 1.4 months of inventory. There were 48 new listings, and 45 homes sold at a median price of $870k. The median overbid percentage was at 104 6%, with an average of 25 days on the market
There were 33 condo and townhome units for sale, providing 3.8 months of inventory. There were 10 new listings and 2 units sold at a median sale price of $645k. The median overbid percentage was at 104%, with an average of 34 days on the market.
SFH
Single-Family Homes
48 New Listings
45 Sold Listings
1.4 Months of Inventory
$870K
Median Sale Price
104.6%
Median Sale vs List
25 Avg Days on Market
The data, sourced from Broker Metrics, includes all single-family homes, condos and townhomes in the California Area from September 2023 to September 2024. This may include preliminary data, and may vary from the time the data was gathered. All data is deemed reliable but not guaranteed. DRE# 01345026. Copyright KW Advisors Fremont 2024. Each office is independently owned and operated.
New Listings
3.8
Months of Inventory 104%
Median Sale vs List
Median SalesPrice
Single-Family Homes
The median sale price has increased from $830k last September 2023, to $870k as of September 2024
Condos & Townhomes
The median sale price has decreased from $725k last September 2023, to $645k as of September 2024
AVGDays OntheMarket
Single-Family Homes
The average time spent on the market went up from 17 days last September 2023, to 25 days as of September 2024
Condos & Townhomes
The average time spent on the market went up from 17 days in September 2023, to 34 days as of September 2024.
Overbids
Single-Family Homes
The overbid percentage has decreased from 107 3% last September 2023, to 104 6% a year later
Condos & Townhomes
The overbid percentage has increased from 103.1% last September 2023, to 104% a year later.
Tri-Cities
What's in the Tri-Cities data?
There were 303 single-family homes for sale, providing 1 2 months of inventory There were 153 new listings, and 120 homes sold at a median price of $1.5m. The median overbid percentage was at 102.3%, with an average of 17 days on the market.
There were 219 condo and townhome units for sale, providing 2.1 months of inventory. There were 97 new listings and 54 units sold at a median sale price of $952k. The median overbid percentage was at 102%, with an average of 24 days on the market.
New Listings
2.1
Months of Inventory
102%
Median Sale vs List
Median SalesPrice
Single-Family Homes
The median sale price has increased from $1 55m last September 2023, to $1 59m as of September 2024
Condos & Townhomes
The median sale price has increased from $815k last September 2023, to $952k as of September 2024
AVGDays OntheMarket
Single-Family Homes
The average time spent on the market went up from 14 days last September 2023, to 17 days as of September 2024
Condos & Townhomes
The average time spent on the market went up from 16 days in September 2023, to 24 days as of September 2024.
Overbids
Single-Family Homes
The overbid percentage has decreased from 105 5% last September 2023, to 102 3% a year later
Condos & Townhomes
The overbid percentage has decreased from 102.6% last September 2023, to 102% a year later.
Pleasan
What's in the Plea
There were 120 single-family providing 1.4 months of inve new listings, and 36 homes s of $1.7m. The median overb 98.5%, with an average of 30
There were 38 condo and tow sale, providing 1.9 months o were 19 new listings and 9 u sale price of $685k. The med percentage was at 99.9%, wi days on the market.
homes, condos and September 2024. This may gathered. All data is KW Advisors Fremont
New Listings
1.9
Months of Inventory 99.9%
Median Sale vs List
Median SalesPrice
Single-Family Homes
The median sale price has decreased from $1 8m last September 2023, to $1 7m as of September 2024
Condos & Townhomes
The median sale price has decreased from $755k last September 2023, to $685k as of September 2024
AVGDays OntheMarket
Single-Family Homes
The average time spent on the market went up from 12 days last September 2023, to 30 days as of September 2024
Condos & Townhomes
The average time spent on the market went up from 13 days in September 2023, to 23 days as of September 2024.
Overbids
Single-Family Homes
The overbid percentage has decreased from 100 9% last September 2023, to 98 5% a year later
Condos & Townhomes
The overbid percentage has increased from 99.8% last September 2023, to 99.9% a year later.
SanRamon
What's in the San Ramon data?
There were 89 single-family homes for sale, providing 1 month of inventory. There were 37 new listings, and 32 homes sold at a median price of $1.6m. The median overbid percentage was at 97.4%, with an average of 22 days on the market.
There were 75 condo and townhome units for sale, providing 4.1 months of inventory. There were 30 new listings and 20 units sold at a median sale price of $1m. The median overbid percentage was at 98.7%, with an average of 30 days on the market.
SFH
Single-Family Homes
37 New Listings
32 Sold Listings
1 Month of Inventory
$1.6M
Median Sale Price
97.4%
Median Sale vs List
22 Avg Days on Market
The data, sourced from Broker Metrics, includes all single-family homes, condos and townhomes in the California Area from September 2023 to September 2024. This may include preliminary data, and may vary from the time the data was gathered. All data is deemed reliable but not guaranteed. DRE# 01345026. Copyright KW Advisors Fremont 2024. Each office is independently owned and operated.
Condo & Townhomes
30 New Listings
20 Sold Listings
4.1
Months of Inventory
$1M
Median Sale Price 98.7%
Median Sale vs List
30 Avg Days on Market
SEPTEMBER 2023 - SEPTEMBER 2024
LISTINGS FOR SALE SOLD LISTINGS
Single-Family Homes
Last 12 months, year-over-year.
Condos & Townhomes
Last 12 months, year-over-year
Median SalesPrice
Single-Family Homes
The median sale price has decreased from $1 7m last September 2023, to $1 6m as of September 2024
Condos & Townhomes
The median sale price has increased from $755k last September 2023, to $1m as of September 2024
AVGDays OntheMarket
Single-Family Homes
The average time spent on the market went up from 18 days last September 2023, to 22 days as of September 2024
Condos & Townhomes
The average time spent on the market went up from 17 days in September 2023, to 30 days as of September 2024.
Overbids
Single-Family Homes
The overbid percentage has decreased from 101 5% last September 2023, to 97 4% a year later
Condos & Townhomes
The overbid percentage has decreased from 99.1% last September 2023, to 98.7% a year later.
Livermore
What's in the Livermore data?
There were 144 single-family homes for sale, providing 1.4 months of inventory. There were 82 new listings, and 52 homes sold at a median price of $1.2m. The median overbid percentage was at 100.2%, with an average of 23 days on the market.
There were 53 condo and townhome units for sale, providing 1.5 months of inventory. There were 29 new listings and 18 units sold at a median sale price of $749k. The median overbid percentage was at 99%, with an average of 27 days on the market.
SFH
Single-Family Homes
82 New Listings
52 Sold Listings
1.4 Months of Inventory
$1.2M
Median Sale Price
100.2%
Median Sale vs List
23 Avg Days on Market
The data, sourced from Broker Metrics, includes all single-family homes, condos and townhomes in the California Area from September 2023 to September 2024. This may include preliminary data, and may vary from the time the data was gathered. All data is deemed reliable but not guaranteed. DRE# 01345026. Copyright KW Advisors Fremont 2024. Each office is independently owned and operated.
SEPTEMBER 2023 - SEPTEMBER 2024
R SALE SOLD LISTINGS
mes year-over-year.
omes year-over-year
Median SalesPrice
Single-Family Homes
The median sale price has decreased from $1 25m last September 2023, to $1 21m as of September 2024
Condos & Townhomes
The median sale price has decreased from $964k last September 2023, to $749k as of September 2024
AVGDays OntheMarket
Single-Family Homes
The average time spent on the market went up from 16 days last September 2023, to 23 days as of September 2024
Condos & Townhomes
The average time spent on the market went up from 19 days in September 2023, to 27 days as of September 2024.
Overbids
Single-Family Homes
The overbid percentage has decreased from 103 1% last September 2023, to 100 2% a year later
Condos & Townhomes
The overbid percentage has increased from 98.7% last September 2023, to 99% a year later.
Cupert
What's in the Cupe
There were 67 single-family h providing 2 months of invent new listings, and 19 homes s of $2.7m. The median overbi 104.6%, with an average of 2
There were 24 condo and tow sale, providing 2.8 months of were 11 new listings and 8 u sale price of $1.5m. The med percentage was at 106.6%, w days on the market.
homes, condos and September 2024. This may was gathered. All data is KW Advisors Fremont
Condo
New Listings
2.8
Months of Inventory
106.6%
Median Sale vs List
Median SalesPrice
Single-Family Homes
The median sale price has decreased from $3 3m last September 2023, to $2 7m as of September 2024
Condos & Townhomes
The median sale price has increased from $1 3m last September 2023, to $1 5m as of September 2024
AVGDays OntheMarket
Single-Family Homes
The average time spent on the market went up from 14 days last September 2023, to 25 days as of September 2024
Condos & Townhomes
The average time spent on the market went up from 12 days in September 2023, to 15 days as of September 2024.
Overbids
Single-Family Homes
The overbid percentage has decreased from 111 2% last September 2023, to 104 6% a year later
Condos & Townhomes
The overbid percentage has increased from 103.6% last September 2023, to 106.6% a year later.
Oakla
What's in the
There were 873 single providing 3 months of new listings, and 156 price of $916k. The m was at 111.3%, with a market.
There were 339 condo sale, providing 5 7 mo were 116 new listings median sale price of $ percentage was at 98 days on the market.
56 Listings
916K an Sale Price
4 Days on Market
single-family homes, condos and 2023 to September 2024. This may the data was gathered. All data is Copyright KW Advisors Fremont 2024. Each office is independently owned and operated.
Oakland
SEPTEMBER 2023 - SEPTEMBER 2024
LISTINGS FOR SALE SOLD LISTINGS
ngle-Family Homes ast 12 months, year-over-year.
ondos & Townhomes ast 12 months, year-over-year
Median SalesPrice
Single-Family Homes
The median sale price has decreased from $1m last September 2023, to $916k as of September 2024
Condos & Townhomes
The median sale price has decreased from $535k last September 2023, to $515k as of September 2024
AVGDays OntheMarket
Single-Family Homes
The average time spent on the market went up from 29 days last September 2023, to 34 days as of September 2024
Condos & Townhomes
The average time spent on the market went up from 37 days in September 2023, to 43 days as of September 2024.
Overbids
Single-Family Homes
The overbid percentage has decreased from 111 8% last September 2023, to 111 3% a year later
Condos & Townhomes
The overbid percentage has increased from 98% last September 2023, to 98.3% a year later.