Jaideep Singh - September 2024 Market Report | Fremont
Fremont area
Milpitas
Jump to Milpitas Report
Fremont
Jump to Fremont City Report
Newark
Jump to Newark Report
Union City
Jump to Union City Report
Hayward
Jump to Hayward Report
Castro Valley
Jump to Castro Valley Report
San Leandro
Jump to San Leandro Report
Tri-Cities
(Fremont, Newark & Union City)
Jump to Tri-Cities Report
Pleasanton
Jump to Pleasanton Report
San Ramon
Jump to San Ramon Report
Livermore
Jump to Livermore Report
Cupertino
Jump to Cupertino Report
Oakland
Jump to Oakland Report
What’syourhome reallyworthin today’smarket?
That's the question you should be asking yourself.
Our market is incredibly diverse and rapidly changing. Values vary not just by neighborhood but by street. Your home isn't necessarily worth what your neighbors' home is. It's the current market that sets the value of your home.
So, do you know what your home is worth today's market?
Icanhelp
Contact me for a confidential, no obligation assessment of your home's value.
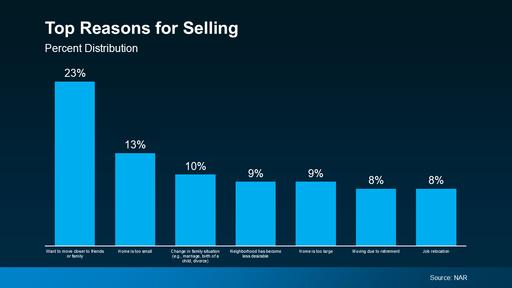
TheLifestyleFactorsThatCould TiptheScale
Are you on the fence about whether to sell your house now or hold off? It’s a common dilemma, but here’s a key point to consider: your lifestyle might be the biggest factor in your decision. While financial aspects are important, sometimes the personal motivations for moving are reason enough to make the leap sooner rather than later.
An annual report from the National Association of Realtors (NAR) offers insight into why homeowners like you chose to sell. All of the top reasons are related to life changes. As the graph below highlights:
Smart Strategies for a Mortgage Application
Avoid paying off debts or collections without professional advice.
Don't have your credit report pulled too many times - this can hurt your credit score. 3 4 5 6 1 2
Always consult your mortgage professional before making large financial moves. Use verified funds for deposits to prevent closing delays.
PROTECT
WHAT YOU DON’T EXPECT
You can’t always see a breakdown coming, but you can plan for it with American Home Shield. Our home service plans help fix or replace covered home systems and appliances, and help you stay on budget. Protect what you don’t expect.
CLICK HERE TO WATCH THE VIDEO
Looking to lighten the mood in your laundry room?
EIGHTEYECATCHING
Laundry Room Colors
To Look Out For
These refreshing colors make the wash-and-dry chore a little more pleasant.
Tranquil Blue
View it here
Sage Green
View it here
Eight Colrs fo Laundry
White
View it here
Yellow
View it here
Gray
View it here
Dusty Pink
View it here
View it here
Navy Blue Purple
View it here
Create a tranquil laundry space with Benjamin Moore's Beach Glass Its light blue shade, coupled with a subtle gray undertone, offers a clean and versatile aesthetic that avoids any baby nursery associations.
Transform your space with earthy tones like October Mist and Gloucester Sage from Benjamin Moore. Test out the trendy sage in your laundry room for a lowcommitment update easy to change and customize, ensuring lasting satisfaction with your design choice.
Create an elegant laundry room with Chantilly Lace by Benjamin Moore The classic white choice adds sophistication, opens up the space, and simplifies stain detection.
Elevate your laundry space with the energizing touch of yellow. Behr's Roasted Corn or Upbeat bring warmth and optimism, while Pearly White offers a mellow option a yellow-based white that brings a perfect harmony of vibrancy and calmness
Gray remains a top choice for laundry room walls, providing a timeless and serene backdrop A soft gray for a whisper of sophistication, easily personalized with printed patterned tile flooring or Behr's bold 2024 Color of the Year, Cracked Pepper.
Sherwin-Williams' Rosebud for a touch of romance in laundry rooms. The dusty pink hue, paired with gold accents, adds a luxurious and warm atmosphere
Navy as the key to a striking laundry room. Beyond lighter blues, navy paired with lighter accents or white fixtures, especially Benjamin Moore's Hale Navy, creates a bold choice that makes the laundry room stand out.
Dare to take a style risk in your laundry room with a pop of color Opt for the subtle smoky lavender of Farrow & Ball's Peignoir for a neutral touch or go all-out glam with Backdrop's dark and vampy McQueen, drawing inspiration from the famous fashion designer.
Adding an Accessory Dwelling Unit (ADU) boosts your property value and adds living space. Choose the right partner to ensure your project is smooth and successful.
Choose Expertise Over Inexperience
Building an ADU needs more than construction skills; it requires knowledge of local rules and design. Trust Acton ADU's expertise to avoid mistakes and ensure a seamless process.
Verify
Your ADU Partner’s Credentials
Check that your contractor knows ADU design and local rules to avoid errors. Choose someone with a strong track record in ADU projects.
Conduct Thorough Site Assessments
Not every property suits ADUs. Use experts for site assessments to avoid costly mistakes.
Put Your Trust in The Right Company
Acton ADU has been successfully helping homeowners achieve their property goals for over 35 years. Making the wrong choice in the ADU market can lead to serious financial setbacks. ADUs aren't always ways, but Acton ADU can make it feel that way.
START YOUR ADU PROJECT RIGHT
VENDOR DIRECTORY
When it comes to home ownership, knowing who you can trust is crucial. That's why we've curated a select list of trusted vendors who are ready to help with your home goals.
H Family Homes
s nventory
21 Sold Listings
$1.7M Median Sale Price
.7% vs List
14 Avg Days on Market
from Broker Metrics, includes all single-family homes, condos and California Area from August 2023 to August 2024. This may include and may vary from the time the data was gathered. All data is deemed guaranteed. DRE# 01345026. Copyright KW Advisors Fremont 2024. Each office is independently owned and operated.
Condo & Townhomes
26
New Listings
22 Sold Listings
1.4
Months of Inventory
$1.1M
Median Sale Price
102.2%
Median Sale vs List
23 Avg Days on Market
AUGUST 2023 - AUGUST 2024
Single-Family Homes
Last 12 months, year-over-year.
Condos & Townhomes
Last 12 months, year-over-year
Median SalesPrice
Single-Family Homes
The median sale price has increased from $1 6m last August 2023, to $1 7m as of August 2024
Condos & Townhomes
The median sale price has increased from $1m last August 2023, to $1 1m as of August 2024
AVGDays OntheMarket
Single-Family Homes
The average time spent on the market remained the same from 14 days last August 2023, to 14 days as of August 2024
Condos & Townhomes
The average time spent on the market went up from 12 days in August 2023, to 23 days as of August 2024.
Overbids
Single-Family Homes
The overbid percentage has increased from 104 8% last August 2023, to 106% a year later
Condos & Townhomes
The overbid percentage has increased from 102% last August 2023, to 102.2% a year later.
Frem
What's in
There were 19 providing 1 mo new listings, a of $1.9m. The 104.8%, with a
There were 15 sale, providing were 64 new li sale price of $ percentage wa days on the m
and include deemed 2024.
Condo & Town
1.8 Months of Inventory $91 Median 99.4%
Median Sale vs List Avg Days
AUGUST 2023 - AUGUST 2024
INGS FOR SALE SOLD LISTINGS
amily Homes months, year-over-year. & Townhomes months, year-over-year
Median SalesPrice
Single-Family Homes
The median sale price has increased from $1 6m last August 2023, to $1 9m as of August 2024
Condos & Townhomes
The median sale price has decreased from $928k last August 2023, to $918k as of August 2024
AVGDays OntheMarket
Single-Family Homes
The average time spent on the market went up from 13 days last August 2023, to 16 days as of August 2024
Condos & Townhomes
The average time spent on the market went up from 17 days in August 2023, to 23 days as of August 2024.
Overbids
Single-Family Homes
The overbid percentage has decreased from 105 9% last August 2023, to 104 8% a year later
Condos & Townhomes
The overbid percentage has decreased from 102.2% last August 2023, to 99.4% a year later.
Newark
What's in the Newark data?
There were 60 single-family homes for sale, providing 1.3 months of inventory. There we new listings, and 25 homes sold at a median of $1.3m. The median overbid percentage w 104.4%, with an average of 18 days on the m
There were 33 condo and townhome units fo sale, providing 1.4 months of inventory. Ther were 18 new listings and 12 units sold at a m sale price of $1m. The median overbid perce was at 102.1%, with an average of 23 days o market.
ngs
3 f Inventory
Homes
25 Sold Listings
$1.3M Median Sale Price
4.4% ale vs List
18 Avg Days on Market
sourced from Broker Metrics, includes all single-family homes, condos and the California Area from August 2023 to August 2024. This may include ata, and may vary from the time the data was gathered. All data is deemed not guaranteed. DRE# 01345026. Copyright KW Advisors Fremont 2024. Each office is independently owned and operated.
18
New Listings
12
Sold Listings
1.4
Months of Inventory
$1M
Median Sale Price
102.1%
Median Sale vs List
23 Avg Days on Market
Median SalesPrice
Single-Family Homes
The median sale price has increased from $1 35m last August 2023, to $1 37m as of August 2024
Condos & Townhomes
The median sale price has increased from $744k last August 2023, to $1m as of August 2024
AVGDays OntheMarket
Single-Family Homes
The average time spent on the market went up from 15 days last August 2023, to 18 days as of August 2024
Condos & Townhomes
The average time spent on the market went up from 6 days in August 2023, to 23 days as of August 2024.
Overbids
Single-Family Homes
The overbid percentage has decreased from 107 7% last August 2023, to 104 4% a year later
Condos & Townhomes
The overbid percentage has decreased from 104.5% last August 2023, to 102.1% a year later.
UnionCity
What's in the Union City data?
There were 67 single-family homes for sale, providing 0.9 months of inventory. There were 30 new listings, and 23 homes sold at a median price of $1.4m. The median overbid percentage was at 103.5%, with an average of 18 days on the market.
There were 27 condo and townhome units for sale, providing 2.5 months of inventory. There were 12 new listings and 7 units sold at a median sale price of $575k. The median overbid percentage was at 97.6%, with an average of 35 days on the market.
SFH
Single-Family Homes
30 New Listings
23 Sold Listings
0.9 Months of Inventory
$1.4M
Median Sale Price
103.5%
Median Sale vs List
18 Avg Days on Market
The data, sourced from Broker Metrics, includes all single-family homes, condos and townhomes in the California Area from August 2023 to August 2024. This may include preliminary data, and may vary from the time the data was gathered. All data is deemed reliable but not guaranteed. DRE# 01345026. Copyright KW Advisors Fremont 2024. Each office is independently owned and operated.
Condo & Townhomes
12
New Listings
7 Sold Listings
2.5
Months of Inventory
$575K
Median Sale Price 97.6%
Median Sale vs List
35 Avg Days on Market
AUGUST 2023 - AUGUST 2024
Single-Family Homes
Last 12 months, year-over-year.
Condos & Townhomes
Last 12 months, year-over-year
Median SalesPrice
Single-Family Homes
The median sale price has increased from $1 3m last August 2023, to $1 4m as of August 2024
Condos & Townhomes
The median sale price has decreased from $612k last August 2023, to $575k as of August 2024
AVGDays OntheMarket
Single-Family Homes
The average time spent on the market went up from 12 days last August 2023, to 18 days as of August 2024
Condos & Townhomes
The average time spent on the market went up from 12 days in August 2023, to 35 days as of August 2024.
Overbids
Single-Family Homes
The overbid percentage has remained the same from 103 5% last August 2023, to 103 5% a year later
Condos & Townhomes
The overbid percentage has decreased from 105.2% last August 2023, to 97.6% a year later.
Hayw
What's in the
There were 162 single providing 1.3 months new listings, and 61 h of $920k. The median 104.1%, with an avera
There were 108 condo sale, providing 2.8 mo were 44 new listings a sale price of $700k. T percentage was at 99 days on the market.
1 Listings
920K an Sale Price
1 Days on Market
single-family homes, condos and to August 2024. This may include was gathered. All data is deemed Copyright KW Advisors Fremont 2024.
Condo & Townhomes
44
New Listings
27 Sold Listings
2.8
Months of Inventory
$700K
Median Sale Price 99.2%
Median Sale vs List 33 Avg Days on Market
AUGUST 2023 - AUGUST 2024
Family Homes
2 months, year-over-year.
s & Townhomes
2 months, year-over-year
Median SalesPrice
Single-Family Homes
The median sale price has increased from $912k last August 2023, to $920k as of August 2024
Condos & Townhomes
The median sale price has increased from $600k last August 2023, to $700k as of August 2024
AVGDays OntheMarket
Single-Family Homes
The average time spent on the market went up from 13 days last August 2023, to 21 days as of August 2024
Condos & Townhomes
The average time spent on the market went up from 19 days in August 2023, to 33 days as of August 2024.
Overbids
Single-Family Homes
The overbid percentage has increased from 103 2% last August 2023, to 104 1% a year later
Condos & Townhomes
The overbid percentage has decreased from 101.1% last August 2023, to 99.2% a year later.
Castro Valley
What's in the Castro Valley
data?
There were 74 single-family homes for sale, providing 1 month of inventory. There were 35 new listings, and 30 homes sold at a median price of $1.1m. The median overbid percentage was at 101 3%, with an average of 19 days on the market
There were 16 condo and townhome units for sale, providing 1.3 months of inventory. There were 6 new listings and 4 units sold at a median sale price of $622k. The median overbid percentage was at 99.3%, with an average of 53 days on the market.
SFH
Single-Family Homes
35 New Listings
30 Sold Listings
1 Month of Inventory
$1.1M
Median Sale Price
101.3%
Median Sale vs List
19 Avg Days on Market
The data, sourced from Broker Metrics, includes all single-family homes, condos and townhomes in the California Area from August 2023 to August 2024. This may include preliminary data, and may vary from the time the data was gathered. All data is deemed reliable but not guaranteed. DRE# 01345026. Copyright KW Advisors Fremont 2024. Each office is independently owned and operated.
Listings
1.3 Months of Inventory
$622K Median Sale Price 99.3% Median Sale vs List 53 Avg Days on Market 4 Sold Listing
CastroValley
AUGUST 2023 - AUGUST 2024
LISTINGS FOR SALE SOLD LISTINGS
Single-Family Homes
Last 12 months, year-over-year.
Condos & Townhomes
Last 12 months, year-over-year
Median SalesPrice
Single-Family Homes
The median sale price has decreased from $1 2m last August 2023, to $1 1m as of August 2024
Condos & Townhomes
The median sale price has increased from $0 last August 2023, to $622k as of August 2024
AVGDays OntheMarket
Single-Family Homes
The average time spent on the market went up from 15 days last August 2023, to 19 days as of August 2024
Condos & Townhomes
The average time spent on the market went up from 49 days in August 2023, to 53 days as of August 2024.
Overbids
Single-Family Homes
The overbid percentage has decreased from 102% last August 2023, to 101 3% a year later
Condos & Townhomes
The overbid percentage has increased from 0% last August 2023, to 99.3% a year later.
San Leandro
What's in the San Leandro data?
There were 121 single-family homes for sale, providing 1.4 months of inventory. There were 60 new listings, and 47 homes sold at a median price of $860k. The median overbid percentage was at 104 3%, with an average of 22 days on the market
There were 39 condo and townhome units for sale, providing 2.4 months of inventory. There were 15 new listings and 9 units sold at a median sale price of $630k. The median overbid percentage was at 99.9%, with an average of 40 days on the market.
SFH
Single-Family Homes
60 New Listings
47 Sold Listings
1.4 Months of Inventory
$860K
Median Sale Price
104.3%
Median Sale vs List
22 Avg Days on Market
The data, sourced from Broker Metrics, includes all single-family homes, condos and townhomes in the California Area from August 2023 to August 2024. This may include preliminary data, and may vary from the time the data was gathered. All data is deemed reliable but not guaranteed. DRE# 01345026. Copyright KW Advisors Fremont 2024. Each office is independently owned and operated.
Condo & Townhomes
15
New Listings
9 Sold Listings
2.4
Months of Inventory
$630K
Median Sale Price 99.9%
Median Sale vs List
40 Avg Days on Market
SanLeandro
AUGUST 2023 - AUGUST 2024
Single-Family Homes
Last 12 months, year-over-year.
Condos & Townhomes
Last 12 months, year-over-year
Median SalesPrice
Single-Family Homes
The median sale price has decreased from $900k last August 2023, to $860k as of August 2024
Condos & Townhomes
The median sale price has increased from $552k last August 2023, to $630k as of August 2024
AVGDays OntheMarket
Single-Family Homes
The average time spent on the market went up from 12 days last August 2023, to 22 days as of August 2024
Condos & Townhomes
The average time spent on the market went up from 20 days in August 2023, to 40 days as of August 2024.
Overbids
Single-Family Homes
The overbid percentage has decreased from 106 3% last August 2023, to 104 3% a year later
Condos & Townhomes
The overbid percentage has decreased from 100.6% last August 2023, to 99.9% a year later.
Tri-Cit
What's in the Tri-C
There were 324 single-family providing 1 month of invento new listings, and 116 homes price of $1.6m. The median o was at 104.6%, with an avera market.
There were 211 condo and to sale, providing 1.8 months of were 94 new listings and 63 sale price of $875k. The med percentage was at 99.7%, wi days on the market.
single-family homes, condos and 2024. This may include gathered. All data is deemed Advisors Fremont 2024.
Condo & Townhomes
94
New Listings
63 Sold Listings
1.8
Months of Inventory
$875K
Median Sale Price 99.7%
Median Sale vs List 24 Avg Days on Market
AUGUST 2023 - AUGUST 2024
TINGS FOR SALE SOLD LISTINGS
Family Homes
months, year-over-year. & Townhomes
months, year-over-year
Median SalesPrice
Single-Family Homes
The median sale price has increased from $1 5m last August 2023, to $1 6m as of August 2024
Condos & Townhomes
The median sale price has increased from $815k last August 2023, to $875k as of August 2024
AVGDays OntheMarket
Single-Family Homes
The average time spent on the market went up from 13 days last August 2023, to 17 days as of August 2024
Condos & Townhomes
The average time spent on the market went up from 15 days in August 2023, to 24 days as of August 2024.
Overbids
Single-Family Homes
The overbid percentage has decreased from 105 7% last August 2023, to 104 6% a year later
Condos & Townhomes
The overbid percentage has decreased from 102.7% last August 2023, to 99.7% a year later.
Plea
What's in
There were 123 providing 1.4 m new listings, an of $1.6m. The m 98.3%, with an a
There were 37 c sale, providing 1 were 18 new lis sale price of $7 percentage was days on the ma
44 Sold Listings
$1.6M
Median Sale Price
20 Avg Days on Market
includes all single-family homes, condos and August 2023 to August 2024. This may include time the data was gathered. All data is deemed 01345026. Copyright KW Advisors Fremont 2024. Each office is independently owned and operated.
New Listing
1.2
Months of Inventor
103.1%
Median Sale vs Lis
Median SalesPrice
Single-Family Homes
The median sale price has decreased from $1 8m last August 2023, to $1 6m as of August 2024
Condos & Townhomes
The median sale price has decreased from $875k last August 2023, to $712k as of August 2024
AVGDays OntheMarket
Single-Family Homes
The average time spent on the market went up from 11 days last August 2023, to 20 days as of August 2024
Condos & Townhomes
The average time spent on the market went up from 14 days in August 2023, to 15 days as of August 2024.
Overbids
Single-Family Homes
The overbid percentage has increased from 98 2% last August 2023, to 98 3% a year later
Condos & Townhomes
The overbid percentage has increased from 100.1% last August 2023, to 103.1% a year later.
SanRamon
What's in the San Ramon data?
There were 96 single-family homes for sale, providing 1.4 months of inventory. There were 36 new listings, and 43 homes sold at a median price of $1.7m. The median overbid percentage was at 100.6%, with an average of 28 days on the market.
There were 77 condo and townhome units for sale, providing 2.2 months of inventory. There were 27 new listings and 18 units sold at a median sale price of $827k. The median overbid percentage was at 99.3%, with an average of 20 days on the market.
SFH
Single-Family Homes
36 New Listings
43 Sold Listings
1.4 Months of Inventory
$1.7M Median Sale Price
100.6%
Median Sale vs List
28 Avg Days on Market
The data, sourced from Broker Metrics, includes all single-family homes, condos and townhomes in the California Area from August 2023 to August 2024. This may include preliminary data, and may vary from the time the data was gathered. All data is deemed reliable but not guaranteed. DRE# 01345026. Copyright KW Advisors Fremont 2024. Each office is independently owned and operated.
AUGUST 2023 - AUGUST 2024
ISTINGS FOR SALE SOLD LISTINGS
le-Family Homes
12 months, year-over-year.
dos & Townhomes
12 months, year-over-year
Median SalesPrice
Single-Family Homes
The median sale price has increased from $1 6m last August 2023, to $1 7m as of August 2024
Condos & Townhomes
The median sale price has decreased from $890k last August 2023, to $827k as of August 2024
AVGDays OntheMarket
Single-Family Homes
The average time spent on the market went up from 13 days last August 2023, to 28 days as of August 2024
Condos & Townhomes
The average time spent on the market went up from 16 days in August 2023, to 20 days as of August 2024.
Overbids
Single-Family Homes
The overbid percentage has decreased from 102 3% last August 2023, to 100 6% a year later
Condos & Townhomes
The overbid percentage has remained the same from 99.3% last August 2023, to 99.3% a year later.
Liverm
What's in the Liver
There were 135 single-family providing 1 month of invento new listings, and 64 homes s of $1.3m. The median overbi 102.3%, with an average of 1
There were 47 condo and tow sale, providing 1.3 months of were 19 new listings and 10 sale price of $774k. The med percentage was at 99.2%, wi days on the market.
homes, condos and 2024. This may include gathered. All data is deemed Advisors Fremont 2024.
Condo & Townhomes
19
New Listings
10
Sold Listings
1.3
Months of Inventory
$774K
Median Sale Price 99.2%
Median Sale vs List 25 Avg Days on Market
AUGUST 2023 - AUGUST 2024
LISTINGS FOR SALE SOLD LISTINGS
Single-Family Homes
Last 12 months, year-over-year.
Condos & Townhomes
Last 12 months, year-over-year
Median SalesPrice
Single-Family Homes
The median sale price has decreased from $1 36m last August 2023, to $1 31m as of August 2024
Condos & Townhomes
The median sale price has decreased from $875k last August 2023, to $774k as of August 2024
AVGDays OntheMarket
Single-Family Homes
The average time spent on the market went up from 12 days last August 2023, to 18 days as of August 2024
Condos & Townhomes
The average time spent on the market went up from 18 days in August 2023, to 25 days as of August 2024.
Overbids
Single-Family Homes
The overbid percentage has decreased from 104 3% last August 2023, to 102 3% a year later
Condos & Townhomes
The overbid percentage has decreased from 100.4% last August 2023, to 99.2% a year later.
Cupertino
What's in the Cupertino data?
There were 63 single-family homes for sale, providing 2.1 months of inventory. There were 27 new listings, and 22 homes sold at a median price of $3.4m. The median overbid percentage was at 104.6%, with an average of 17 days on the market.
There were 29 condo and townhome units for sale, providing 1 month of inventory. There were 15 new listings and 13 units sold at a median sale price of $1.2m. The median overbid percentage was at 104.5%, with an average of 17 days on the market.
SFH
Single-Family Homes
27 New Listings
22 Sold Listings
2.1 Months of Inventory
$3.4M
Median Sale Price
104.6%
Median Sale vs List
17 Avg Days on Market
The data, sourced from Broker Metrics, includes all single-family homes, condos and townhomes in the California Area from August 2023 to August 2024. This may include preliminary data, and may vary from the time the data was gathered. All data is deemed reliable but not guaranteed. DRE# 01345026. Copyright KW Advisors Fremont 2024. Each office is independently owned and operated.
Condo & Townhomes
15
New Listings
13
Sold Listings
1
Month of Inventory
$1.2M
Median Sale Price
104.5%
Median Sale vs List
17 Avg Days on Market
Cupertino
AUGUST 2023 - AUGUST 2024
LISTINGS FOR SALE SOLD LISTINGS
Single-Family Homes
Last 12 months, year-over-year.
Condos & Townhomes
Last 12 months, year-over-year
Median SalesPrice
Single-Family Homes
The median sale price has increased from $3 1m last August 2023, to $3 4m as of August 2024
Condos & Townhomes
The median sale price has increased from $1 26m last August 2023, to $1 29m as of August 2024
AVGDays OntheMarket
Single-Family Homes
The average time spent on the market remained the same from 17 days last August 2023, to 17 days as of August 2024
Condos & Townhomes
The average time spent on the market went up from 9 days in August 2023, to 17 days as of August 2024.
Overbids
Single-Family Homes
The overbid percentage has decreased from 110 9% last August 2023, to 104 6% a year later
Condos & Townhomes
The overbid percentage has increased from 101.5% last August 2023, to 104.5% a year later.
Oakland
What's in the Oakland data?
There were 793 single-family homes for sale, providing 2.4 months of inventory. There were 273 new listings, and 183 homes sold at a median price of $875k. The median overbid percentage was at 106.9%, with an average of 36 days on the market.
There were 312 condo and townhome units for sale, providing 7 6 months of inventory There were 87 new listings and 44 units sold at a median sale price of $525k. The median overbid percentage was at 97.6%, with an average of 43 days on the market.
SFH
Single-Family Homes
273 New Listings
183 Sold Listings
2.4 Months of Inventory
$875K Median Sale Price
106.9%
Median Sale vs List
36 Avg Days on Market
The data, sourced from Broker Metrics, includes all single-family homes, condos and townhomes in the California Area from August 2023 to August 2024. This may include preliminary data, and may vary from the time the data was gathered. All data is deemed reliable but not guaranteed. DRE# 01345026. Copyright KW Advisors Fremont 2024. Each office is independently owned and operated.
AUGUST 2023 - AUGUST 2024
Median SalesPrice
Single-Family Homes
The median sale price has decreased from $969k last August 2023, to $875k as of August 2024
Condos & Townhomes
The median sale price has decreased from $604k last August 2023, to $525k as of August 2024
AVGDays OntheMarket
Single-Family Homes
The average time spent on the market went up from 26 days last August 2023, to 36 days as of August 2024
Condos & Townhomes
The average time spent on the market went up from 37 days in August 2023, to 43 days as of August 2024.
Overbids
Single-Family Homes
The overbid percentage has decreased from 109 9% last August 2023, to 106 9% a year later
Condos & Townhomes
The overbid percentage has increased from 96.6% last August 2023, to 97.6% a year later.