


April 2023 Copyright by KW Advisors 2023
San Francisco
Bay area
Alameda
Jump to Alameda Report
Contra Costa
Jump to Contra Costa Report
Napa
Jump to Napa Report
San Francisco County
Jump to San Francisco County Report
San Mateo

Jump to San Mateo Report
Santa Clara
Jump to Santa Clara Report
Solano
Jump to Solano Report
Sonoma
Jump to Sonoma Report
Southern/Central Marin
Jump to Marin Report
What’syourhome reallyworthin today’smarket?
That's really the question you should be asking yourself.
Our market is incredibly diverse, and rapidly changing. Values vary not just by neighborhood, but by street. Your home isn't necessarily worth what your neighbors’ home is. At the end of the day, it’s the current market that sets the value of your home.
So, do you know what your home is worth in today's market?
Contact me for a confidential, no obligation assessment of your home's value.
Icanhelp...
HowChangingMortgage RatesCanAffectYou
The 30-year fixed mortgage rate has been bouncing between 6% and 7% this year. If you’ve been on the fence about whether to buy a home or not, it’s helpful to know exactly how a 1%, or even a 0.5%, mortgage rate shift affects your purchasing power.

The chart below helps show the general relationship between mortgage rates and a typical monthly mortgage payment:
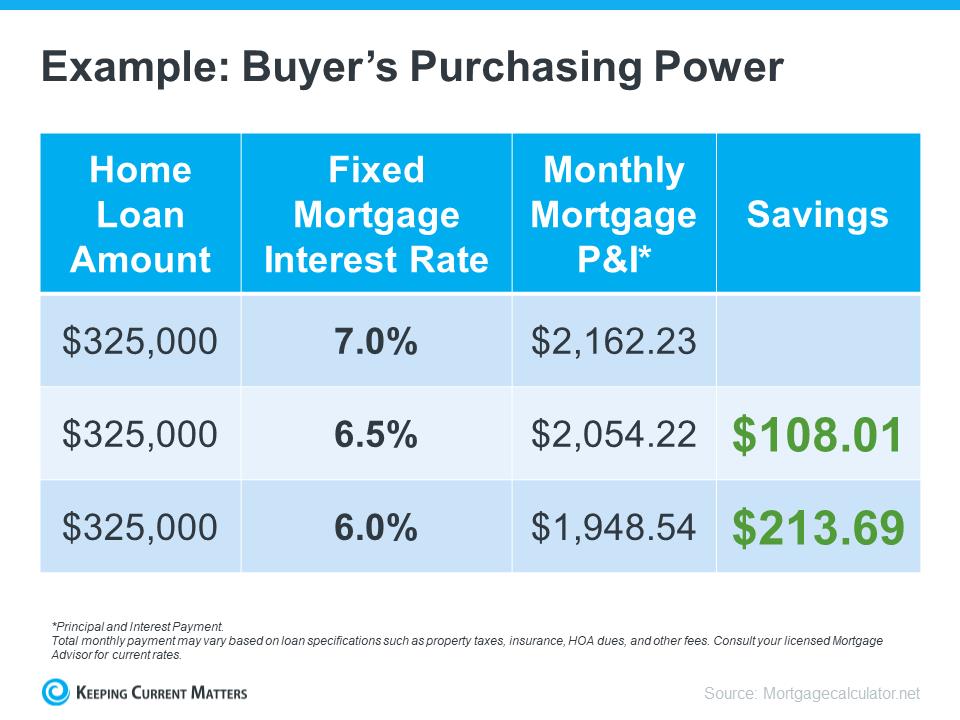
Even a 0.5% change can have a big impact on your monthly payment. And since rates have been moving between 6% and 7% for a while now, you can see how it impacts your purchasing power as rates go down.
What This Means for You
You may be tempted to put your homebuying plans on hold in hopes that rates will fall. But that can be risky. No one knows for sure where rates will go from here, and trying to time them for your benefit is tough Lisa Sturtevant, Housing Economist at Bright MLS, explains:
“It is typically a fool’s errand for a homebuyer to try to time rates in this market . . . But volatility in mortgage rates right now can have a real impact on buyers’ monthly payments.”
That’s why it’s critical to lean on your expert real estate advisors to explore your mortgage options, understand what impacts mortgage rates, and plan your homebuying budget around today’s volatility. They’ll also be able to offer advice tailored to your specific situation and goals, so you have what you need to make an informed decision.
Bottom Line
Your ability to buy a home could be impacted by changing mortgage rates. If you’re thinking about making a move, partner with a trusted real estate agent and lender so you have a strong plan in place.
Source: Keeping Current Matters

Alameda
What's in the Alameda data?
Currently, there are 1,353 single-family homes for sale, providing 0.9 months of inventory. There were 734 new listings, and 577 homes sold at a median sale price of $1.2m. The median overbid percentage was 105%, with an average of 21 days on the market.
There are currently 578 condo and townhome units for sale, providing 1 1 months of inventory There were 298 new listings, and 215 units sold at a median sale price of $763k. The median overbid percentage was 101%, with an average of 27 days on the market.

734 New Listings
577 Sold Listings
0.9 Months of Inventory
$1.2M Median Sale Price
105% Median Sale vs List
21 Avg Days on Market
SFH Single-Family Homes
298 New Listings
215 Sold Listings

1.1 Months of Inventory
$763K Median Sale Price
101% Median Sale vs List
27 Avg Days on Market
CONDO Condo & Townhomes
March2022 April2022 May2022 June2022 July2022August2022September2022October2022November2022December2022January2023February2023 March2023 4000 3000 2000 1000 0 March2022 April2022 May2022 June2022 July2022August2022September2022October2022November2022December2022January2023February2023 March2023 1500 1000 500 0 AlamedaCounty MARCH 2022 - MARCH 2023 Single-Family Homes
12 months, year-over-year.
& Townhomes
Last
Condos
year-over-year LISTINGS FOR SALE SOLD LISTINGS
Last 12 months,
Median SalesPrice
Single-Family Homes
The median sales price has decreased from $1 4m last March 2022, to $1 2m as of March 2023
Condos
The median sales price has decreased from $775k last March 2022, to $763k as of March 2023.
Overbids
Single-Family Homes
The overbid percentage has decreased from 120 8% last March 2022, to 105% a year later
Condos & Townhomes
The overbid percentage has decreased from 108.7% last March 2022, to 101% a year later.
Single-Family Homes
The average time spent on market went up from 11 days last March 2022, to 21 days as of March 2023
The average time spent on market went up from 15 days in March 2022, to 27 days as of March 2023
Back to Table of Contents March2022April2022May2022June2022July2022August2022September2022October2022November2022December2022January2023February2023March2023 $2,000,000 $1,500,000 $1,000,000 $500,000 $0 March2022April2022May2022June2022 July2022August2022September2022October2022November2022December2022January2023February2023March2023 50 40 30 20 10 0 March2022April2022May2022June2022 July2022August2022September2022October2022November2022December2022January2023February2023March2023 125% 100% 75% 50% 25% 0%
Townhomes
&
AVGDays OntheMarket
Condos & Townhomes

Contra Costa
What's in the Contra Costa data?
Currently, there are 704 single-family home sale, providing 1 month of inventory. There 795 new listings, and 704 homes sold at a sale price of $825k. The median overbid percentage was 100%, with an average of 3 on the market.
There are currently 210 condo and townho units for sale, providing 1.1 months of inve There were 233 new listings, and 179 units a median sale price of $580k. The median percentage was 100%, with an average of 2 on the market

825K
04
s
an Sale Price
d Listings
2023 and includes all single-family California Area above from March 2022 may vary from the time the data guaranteed. Questions may be 627.3700 DRE# 01995149 | DRE# Office is independently owned and 2 Days on Market

233 New Listings 1.1 Months of Inventory $580K Median Sale Pric 100% Median Sale vs List 27 Avg Days on Marke 179 Sold Listing CONDO Condo & Townhome
LISTINGS FOR SALE SOLD LISTINGS
y y
Median SalesPrice
Single-Family Homes
The median sales price has decreased from $950k last March 2022, to $825k as of March 2023
Condos
The median sales price has decreased from $585k last March 2022, to $580k as of March 2023.
Overbids
Single-Family Homes
The overbid percentage has decreased from 107 9% last March 2022, to 100% a year later
Condos & Townhomes
The overbid percentage has decreased from 105 7% last March 2022, to 100% a year later
Single-Family
The average time spent on market went up from 12 days last March 2022, to 32 days as of March 2023
The average time spent on market went up from 12 days in March 2022, to 27 days as of March 2023
March2022April2023May2023June2022July2022August2022September2022October2022November2022December2022January2023February2023March2023 $1,000,000 $750,000 $500,000 $250,000 $0 March2022April2023May2023June2022 July2022August2022September2022October2022November2022December2022January2023February2023March2023 50 40 30 20 10 0 March2022April2023May2023June2022 July2022August2022September2022October2022November2022December2022January2023February2023March2023 125% 100% 75% 50% 25% 0%
& Townhomes
AVGDays OntheMarket
Townhomes
Condos &
Homes
Back to Table of Contents

Napa Count
What's in the Na data?
Currently, there are 186 sin sale, providing 1 the marke inventory. There were 74 n homes sold at a median s median overbid percentag average of 56 days on the
There are currently 19 con for sale, providing the mar inventory. There were 10 n sold at a median sale price overbid percentage was 1 of 21 days on the market

on Market
includes all single-family Area above from March 2022 vary from the time the data guaranteed. Questions may be DRE# 01995149 | DRE# independently owned and
90K le Price ings

1
ne2022 July2022August2022September2022October2022November2022December2022January2023February2023 March2023 une2022 July2022August2022September2022October2022November2022December2022January2023February2023 March2023 a MARCH 2022 - MARCH 2023 omes , year-over-year. homes , year-over-year
FOR SALE SOLD LISTINGS
LISTINGS
Median SalesPrice
Single-Family Homes
The median sales price has decreased from $961k last March 2022, to $890k as of March 2023
Condos & Townhomes
The median sales price has increased from $710k last March 2022, to $789k as of March 2023.
Overbids
Single-Family Homes
The overbid percentage has decreased from 101 2% last March 2022, to 100% a year later
Condos & Townhomes
The overbid percentage has decreased from 101.9% last March 2022, to 101.3% a year later.
Single-Family Homes
The average time spent on market went up from 55 days last March 2022, to 56 days as of March 2023
Condos
The average time spent on market went down from 49 days in March 2022, to 21 days as of March 2023
March2022April2023May2023June2022July2022August2022September2022October2022November2022December2022January2023February2023March2023 $1,250,000 $1,000,000 $750,000 $500,000 $250,000 $0 March2022April2023May2023June2022 July2022August2022September2022October2022November2022December2022January2023February2023March2023 80 60 40 20 0 March2022April2023May2023June2022 July2022August2022September2022October2022November2022December2022January2023February2023March2023 125% 100% 75% 50% 25% 0%
AVGDays OntheMarket
& Townhomes
Back to Table of Contents

San Francisco County
What's in the San Francisco County data?
Currently, there are 292 single-family homes for sale, providing the market with 2 months of inventory. There were 242 new listings, and 147 homes were sold at a median sale price of $1.7m The median overbid percentage was 105.7%, with an average of 31 days on the market.
There are currently 567 condo and townhome units for sale, providing the market with 3 months of inventory. There were 306 new listings, and 201 units sold at a median sale price of $1.1m. The median overbid percentage was 100%, with an average of 51 days on the market.

SFH Single-Family Homes
242 New Listings
147 Sold Listings
2 Months of Inventory
$1.7M Median Sale Price
105.7% Median Sale vs List
31 Avg Days on Market
This data was sourced from InfoSparks on April 3rd, 2023 and includes all single-family homes, condos and townhomes in the displayed California Area above from March 2022 to March 2023. This may include preliminary data, and may vary from the time the data was gathered. All data is deemed reliable but not guaranteed. Questions may be directed to KW Advisors. 415.483.9285 - 650 627.3700 DRE# 01995149 | DRE# 01906450 Copyright KW Advisors 2023. Each Office is independently owned and operated.
CONDO
Condo & Townhomes
306 New Listings
201 Sold Listings

3 Months of Inventory
$1.1M Median Sale Price
100% Median Sale vs List
51 Avg Days on Market
Last
March2022 April2023 May2023 June2022 July2022August2022September2022October2022November2022December2022January2023February2023 March2023 750 500 250 0 March2022 April2023 May2023 June2022 July2022August2022September2022October2022November2022December2022January2023February2023 March2023 1500 1000 500 0 SanFranciscoCounty MARCH 2022 - MARCH 2023 Single-Family Homes
12 months, year-over-year. Condos & Townhomes
Last
12 months, year-over-year LISTINGS FOR SALE SOLD LISTINGS
Median SalesPrice
Single-Family Homes
The median sales price has decreased from $2m last March 2022, to $1 7m as of March 2023
Condos
The median sales price has decreased from $1.2m last March 2022, to $1.1m as of March 2023.
Overbids
Single-Family Homes
The overbid percentage has decreased from 121 4% last March 2022, to 105 7% a year later
Condos & Townhomes
The overbid percentage has decreased from 101.4% last March 2022, to 100% a year later.
The average time spent on market went up from 16 days last March 2022, to 31 days as of March 2023
Condos
The average time spent on market went up from 74 days in March 2022, to 51 days as of March 2023
March2022April2023May2023June2022July2022August2022September2022October2022November2022December2022January2023February2023March2023 $2,500,000 $2,000,000 $1,500,000 $1,000,000 $500,000 $0 March2022April2023May2023June2022 July2022August2022September2022October2022November2022December2022January2023February2023March2023 100 75 50 25 0 March2022April2023May2023June2022 July2022August2022September2022October2022November2022December2022January2023February2023March2023 125% 100% 75% 50% 25% 0%
& Townhomes
AVGDays OntheMarket
& Townhomes
Single-Family Homes
Back to Table of Contents

SanM Coun
What's in the data?
Currently, there are 33 sale, providing the ma inventory. There were homes were sold at a The median overbid p an average of 28 days
There are currently 13 units for sale, providin There were 87 new lis median sale price of $ percentage was 99.9% on the market

s
51 d Listings
1.7M an Sale Price
8 Days on Market
2023 and includes all single-family California Area above from March 2022 and may vary from the time the data guaranteed. Questions may be 627.3700 DRE# 01995149 | DRE# Office is independently owned and
87 New Listings
98 Sold Listings
1 Months of Inventory
$1M Median Sale Price

99.9% Median Sale vs List
36 Avg Days on Market
CONDO Condo & Townhomes
Last
Last
March2022 April2023 May2023 June2022 July2022August2022September2022October2022November2022December2022January2023February2023 March2023 1250 1000 750 500 250 0 March2022 April2023 May2023 June2022 July2022August2022September2022October2022November2022December2022January2023February2023 March2023 400 300 200 100 0 SanMateoCounty MARCH 2022 - MARCH 2023 Single-Family Homes
12
year-over-year.
& Townhomes
months,
Condos
year-over-year LISTINGS FOR SALE SOLD LISTINGS
12 months,
Median SalesPrice
Single-Family Homes
The median sales price has decreased from $2m last March 2022, to $1 7m as of March 2023
Condos
The median sales price has increased from $938k last March 2022, to $1m as of March 2023.
Overbids
Single-Family Homes
The overbid percentage has decreased from 114 4% last March 2022, to 100% a year later
Condos & Townhomes
The overbid percentage has decreased from 105.3% last March 2022, to 99.9% a year later.
Single-Family Homes
The average time spent on market went up from 12 days last March 2022, to 28 days as of March 2023
The average time spent on market went up from 16 days in March 2022, to 36 days as of March 2023
March2022April2023May2023June2022July2022August2022September2022October2022November2022December2022January2023February2023March2023 $2,500,000 $2,000,000 $1,500,000 $1,000,000 $500,000 $0 March2022April2023May2023June2022 July2022August2022September2022October2022November2022December2022January2023February2023March2023 60 40 20 0 March2022April2023May2023June2022 July2022August2022September2022October2022November2022December2022January2023February2023March2023 125% 100% 75% 50% 25% 0%
& Townhomes
AVGDays OntheMarket
Condos & Townhomes
Back to Table of Contents

Sant Cou
What's in t County dat
Currently, there a sale, providing th inventory. There homes sold at a median overbid p average of 25 da
There are curren units for sale, pro months of inven and 267 units we $940k. The med with an average

Msingle-family March 2022 time the data Questions may be 01995149 | DRE# owned and t

Last

March2022 April2023 May2023 June2022 July2022August2022September2022October2022November2022December2022January2023February2023 March2023 2500 2000 1500 1000 500 0 March2022 April2023 May2023 June2022 July2022August2022September2022October2022November2022December2022January2023February2023 March2023 1250 1000 750 500 250 0 SantaClaraCounty MARCH 2022 - MARCH 2023 Single-Family Homes
12 months, year-over-year. Condos & Townhomes
Last
12 months, year-over-year LISTINGS FOR SALE SOLD LISTINGS
Median SalesPrice
Single-Family Homes
The median sales price has decreased from $1 9m last March 2022, to $1 6m as of March 2023
Condos & Townhomes
The median sales price has decreased from $1m last March 2022, to $940k as of March 2023.
Overbids
Single-Family Homes
The overbid percentage has decreased from 116% last March 2022, to 100 9% a year later
Condos & Townhomes
The overbid percentage has decreased from 110.5% last March 2022, to 100% a year later.
Single-Family Homes
The average time spent on market went up from 12 days last March 2022, to 25 days as of March 2023
Condos
The average time spent on market went up from 11 days in March 2022, to 27 days as of March 2023
March2022April2023May2023June2022July2022August2022September2022October2022November2022December2022January2023February2023March2023 $2,000,000 $1,500,000 $1,000,000 $500,000 $0 March2022April2023May2023June2022 July2022August2022September2022October2022November2022December2022January2023February2023March2023 40 30 20 10 0 March2022April2023May2023June2022 July2022August2022September2022October2022November2022December2022January2023February2023March2023 125% 100% 75% 50% 25% 0%
AVGDays OntheMarket
& Townhomes
Back to Table of Contents
Solano County
What's in the Solano County data?
Currently, there are 322 single-family homes for sale, providing 0.9 months of inventory. There were 328 new listings, and 312 homes sold at a median sale price of $579k. The median overbid percentage was 100%, with an average of 57 days on the market.
There are currently 20 condo and townhome units for sale, providing 0.7 months of inventory. There were 17 new listings, and 22 units were sold at a median sale price of $397k. The median overbid percentage was 100.5%, with an average of 54 days on the market

SFH Single-Family Homes
328 New Listings
312 Sold Listings
0.9 Months of Inventory
$579k Median Sale Price
100% Median Sale vs List
57 Avg Days on Market
This data was sourced from InfoSparks on April 3rd, 2023 and includes all single-family homes, condos and townhomes in the displayed California Area above from March 2022 to March 2023. This may include preliminary data, and may vary from the time the data was gathered. All data is deemed reliable but not guaranteed. Questions may be directed to KW Advisors. 415.483.9285 - 650 627.3700 DRE# 01995149 | DRE# 01906450 Copyright KW Advisors 2023. Each Office is independently owned and operated.
17 New Listings
22 Sold Listings
0.7 Months of Inventory
$397K Median Sale Price
100.5% Median Sale vs List
54 Avg Days on Market
&
CONDO Condo
Townhomes
Last 12 months, year-over-year
March2022 April2023 May2023 June2022 July2022August2022September2022October2022November2022December2022January2023February2023 March2023 2000 1500 1000 500 0 March2022 April2023 May2023 June2022 July2022August2022September2022October2022November2022December2022January2023February2023 March2023 125 100 75 50 25 0 Solano MARCH 2022 - MARCH 2023
Homes
Single-Family
year-over-year.
& Townhomes
Last 12 months,
Condos
LISTINGS FOR SALE SOLD LISTINGS
Median SalesPrice
Single-Family Homes
The median sales price has decreased from $605k last March 2022, to $579k as of March 2023
Condos & Townhomes
The median sales price has increased from $360k last March 2022, to $397k as of March 2023.
Overbids
Single-Family Homes
The overbid percentage has decreased from 102 1% last March 2022, to 100% a year later
Condos & Townhomes
The overbid percentage has decreased from 102% last March 2022, to 100.5% a year later.
Single-Family Homes
The average time spent on market went up from 24 days last March 2022, to 57 days as of March 2023
Condos & Townhomes
The average time spent on market went up from 26 days in March 2022, to 54 days as of March 2023
March2022April2023May2023June2022July2022August2022September2022October2022November2022December2022January2023February2023March2023 $750,000 $500,000 $250,000 $0 March2022April2023May2023June2022 July2022August2022September2022October2022November2022December2022January2023February2023March2023 75 50 25 0 March2022April2023May2023June2022 July2022August2022September2022October2022November2022December2022January2023February2023March2023 125% 100% 75% 50% 25% 0%
AVGDays OntheMarket
Back to Table of Contents

Sonoma County
What's in the Sonoma data?
Currently, there are 374 single-family homes sale, providing the market with 1.2 months of inventory. There were 216 new listings, and 2 homes were sold at a median sale price of $8 The median overbid percentage was 100%, w an average of 54 days on the market.
There are currently 31 condo and townhome for sale, providing the market with 0.7 month inventory. There were 39 new listings, and 38 condos sold at a median sale price of $495k. median overbid percentage was 100%, with a average of 43 days on the market.

New Listings
Months of Inventory
Median Sale Price 100% Median Sale vs List
Avg Days on Market
Sold Listings
Condo & Townhomes
39
0.7
$495K
43
38
CONDO
Last
Last 12 months, year-over-year
March2022 April2023 May2023 June2022 July2022August2022September2022October2022November2022December2022January2023February2023 March2023 2000 1500 1000 500 0 March2022 April2023 May2023 June2022 July2022August2022September2022October2022November2022December2022January2023February2023 March2023 250 200 150 100 50 0 Sonoma MARCH 2022 - MARCH 2023
Homes
Single-Family
year-over-year.
& Townhomes
12 months,
Condos
LISTINGS FOR SALE SOLD LISTINGS
Median SalesPrice
Single-Family Homes
The median sales price has decreased from $825k last March 2022, to $824k as of March 2023
Condos & Townhomes
The median sales price has decreased from $499k last March 2022, to $495k as of March 2023.
Overbids
Single-Family Homes
The overbid percentage has decreased from 103 4% last March 2022, to 100% a year later
Condos & Townhomes
The overbid percentage has decreased from 103.8% last March 2022, to 100% a year later.
Single-Family Homes
The average time spent on market went up from 26 days last March 2022, to 54 days as of March 2023
Condos & Townhomes
The average time spent on market went up from 26 days in March 2022, to 43 days as of March 2023
March2022April2023May2023June2022July2022August2022September2022October2022November2022December2022January2023February2023March2023 $1,000,000 $750,000 $500,000 $250,000 $0 March2022April2023May2023June2022 July2022August2022September2022October2022November2022December2022January2023February2023March2023 75 50 25 0 March2022April2023May2023June2022 July2022August2022September2022October2022November2022December2022January2023February2023March2023 125% 100% 75% 50% 25% 0%
AVGDays OntheMarket
Back to Table of Contents

Southern/ Central Marin
What's in the Marin data?
Currently, there are 161 single-family homes for sale, providing the market with 1 month of inventory. There were 112 new listings, and 122 homes sold at a median sale price of $1.6m. The median overbid percentage was 101%, with an average of 39 days on the market.
There are currently 104 condo and townhome units for sale, providing the market with 2.2 months of inventory. There were 48 new listings, and 54 condos sold at a median sale price of $768k. The median overbid percentage was 100%, with an average of 56 days on the market.

SFH Single-Family Homes
122 New Listings
112 Sold Listings
1 Months of Inventory
$1.7M Median Sale Price
101% Median Sale vs List
39 Avg Days on Market
This data was sourced from InfoSparks on April 3rd, 2023 and includes all single-family homes, condos and townhomes in the displayed California Area above from March 2022 to March 2023. This may include preliminary data, and may vary from the time the data was gathered. All data is deemed reliable but not guaranteed. Questions may be directed to KW Advisors. 415.483.9285 - 650 627.3700 DRE# 01995149 | DRE# 01906450 Copyright KW Advisors 2023. Each Office is independently owned and operated.
48 New Listings
2.2 Months of Inventory

$769K Median Sale Price 100% Median Sale vs List 56 Avg Days on Market
& Townhomes
54 Sold Listings CONDO Condo
Last 12 months, year-over-year.
Condos
Last 12 months, year-over-year
March2022 April2023 May2023 June2022 July2022August2022September2022October2022November2022December2022January2023February2023 March2023 800 600 400 200 0 March2022 April2023 May2023 June2022 July2022August2022September2022October2022November2022December2022January2023February2023 March2023 250 200 150 100 50 0 S/CMarin MARCH 2022 - MARCH 2023
Single-Family Homes
& Townhomes
LISTINGS FOR SALE SOLD LISTINGS
Median SalesPrice
Single-Family Homes
The median sales price has decreased from $1 8m last March 2022, to $1 7m as of March 2023
Condos
The median sales price has decreased from $798k last March 2022, to $769k as of March 2023.
Overbids
Single-Family Homes
The overbid percentage has decreased from 111 8% last March 2022, to 101% a year later
Condos & Townhomes
The overbid percentage has decreased from 104.4% last March 2022, to 100% a year later.
Single-Family Homes
The average time spent on market went up from 29 days last March 2022, to 39 days as of March 2023
The average time spent on market went up from 29 days in March 2022, to 56 days as of March 2023
March2022April2023May2023June2022July2022August2022September2022October2022November2022December2022January2023February2023March2023 $2,500,000 $2,000,000 $1,500,000 $1,000,000 $500,000 $0 March2022April2023May2023June2022 July2022August2022September2022October2022November2022December2022January2023February2023March2023 75 50 25 0 March2022April2023May2023June2022 July2022August2022September2022October2022November2022December2022January2023February2023March2023 125% 100% 75% 50% 25% 0%
& Townhomes
AVGDays OntheMarket
Condos & Townhomes
Back to Table of Contents


1624 California Street, San Francisco CA 94109 2207 Lombard Street, San Francisco, CA 94123 SanFrancisco 1430 Howard Avenue, Burlingame, CA 94010 16 E 3rd Avenue, San Mateo, CA 94401 PeninsulaEstates 505 Hamilton Ave Suite #100, Palo Alto, CA 94301 PaloAlto 951 California Boulevard, Napa, CA 94559 NapaValley :
