




Copyright by KW Advisors 2023
Peninsula Estates
San Francisco County
Jump to San Francisco County Report
San Mateo County
Jump to San Mateo County Report
Burlingame
Jump to Burlingame Report
Daly City
Jump to Daly City Report
Foster City
Jump to Foster City Report
Half Moon Bay
Jump to Half Moon Bay Report
Hillsborough
Jump to Hillsborough Report
Millbrae
Jump to Millbrae Report
Pacifica
Jump to Pacifica Report
San Bruno
Jump to San Bruno Report
San Carlos
Jump to San Carlos Report
San Mateo
Jump to San Mateo Report
South San Francisco
Jump to South San Francisco Report

What’syourhome reallyworthin today’smarket?
That's really the question you should be asking yourself.
Our market is incredibly diverse, and rapidly changing. Values vary not just by neighborhood, but by street. Your home isn't necessarily worth what your neighbors’ home is. At the end of the day, it’s the current market that sets the value of your home.
So, do you know what your home is worth in today's market?
Icanhelp...
Contact me for a confidential, no obligation assessment of your home's value.

TheTrueValueof Homeownership
Buying and owning your home can make a big difference in your life by bringing you joy and a sense of belonging. And with June being National Homeownership Month, it’s the perfect time to think about all the benefits homeownership provides.
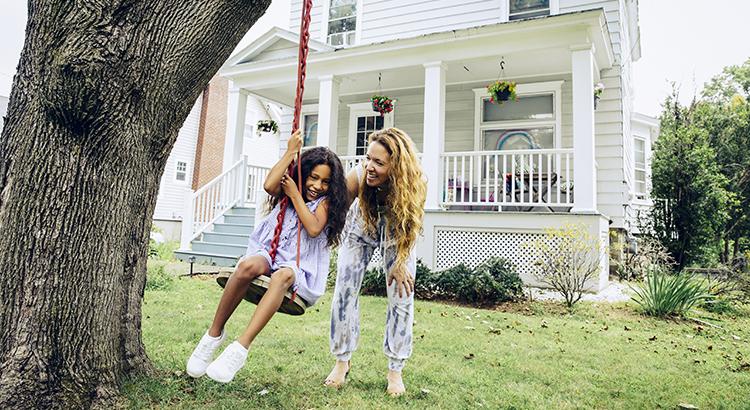
Of course, there are financial reasons to buy a house, but it’s important to consider the non-financial benefits that make a home more than just where you live.
Here are three ways owning your home can give you a sense of accomplishment, happiness, and pride.
S F C
Wh Cou There provi new price was mark There sale, were sale was mark

s
2M rice
condominium sales in San City, Half Moon Bay, Mateo, and South San sources deemed reliable reserved. Each Office Is

Market
5.9 Months of Inventory

18 New Listings
$1M Median Sale
97.6% Median Sale vs List
Condo & Townhom
5 Avg Days on M Sold Lis CONDO

y y
Median SalesPrice
Single-Family Homes
The median sales price has decreased from $1 4m last May 2022, to $1 2m as of May 2023
Condos & Townhomes
The median sales price has increased from $848k last May 2022, to $1m as of May 2023.
AVGDays OntheMarket
Single-Family Homes
The average time spent on the market went up from 15 days last May 2022, to 36 days as of May 2023
Condos & Townhomes
The average time spent on the market went up from 37 days in May 2022, to 56 days as of May 2023
Overbids
Single-Family Homes
The overbid percentage has decreased from 113% last May 2022, to 95% a year later
Condos & Townhomes
The overbid percentage has decreased from 100.4% last May 2022, to 97.6% a year later.
May2022Jun2022 Jul2022Aug2022Sep2022Oct2022Nov2022Dec2022 Jan2023Feb2023Mar2023Apr2023May2023 $2,000,000 $1,500,000 $1,000,000 $500,000 $0 May2022 Jun2022 Jul2022Aug2022Sep2022Oct2022Nov2022Dec2022 Jan2023Feb2023Mar2023Apr2023May2023 125 100 75 50 25 0 May2022 Jun2022 Jul2022Aug2022Sep2022Oct2022Nov2022Dec2022 Jan2023Feb2023Mar2023Apr2023May2023 125% 100% 75% 50% 25% 0%
Back to Table of Contents

Sa Co
What' data?
There we providing new listin price of $ 100 7%, There we sale, pro were 108 average was 101 market.


sales in San Half Moon Bay, and South San deemed reliable Each Office Is et

108 New Listings 1.5 Months of Inventory $915k Median Sale Pr 101.9% Median Sale vs List 20 Avg Days on Mar 86 Sold Listin CONDO Condo & Townhome

y y
Median SalesPrice
Single-Family Homes
The median sales price has decreased from $2 2m last May 2022, to $2m as of May 2023
Condos & Townhomes
The median sales price has decreased from $1m last May 2022, to $915k as of May 2023.
AVGDays OntheMarket
Single-Family Homes
The average time spent on the market went up from 15 days last May 2022, to 22 days as of May 2023
Condos & Townhomes
The average time spent on the market went up from 17 days in May 2022, to 20 days as of May 2023
Overbids
Single-Family Homes
The overbid percentage has decreased from 107 5% last May 2022, to 100 7% a year later
Condos & Townhomes
The overbid percentage has decreased from 107.2% last May 2022, to 101.9% a year later.
May2022Jun2022 Jul2022Aug2022Sep2022Oct2022Nov2022Dec2022 Jan2023Feb2023Mar2023Apr2023May2023 $2,500,000 $2,000,000 $1,500,000 $1,000,000 $500,000 $0 May2022 Jun2022 Jul2022Aug2022Sep2022Oct2022Nov2022Dec2022 Jan2023Feb2023Mar2023Apr2023May2023 50 40 30 20 10 0 May2022 Jun2022 Jul2022Aug2022Sep2022Oct2022Nov2022Dec2022 Jan2023Feb2023Mar2023Apr2023May2023 125% 100% 75% 50% 25% 0%
Back to Table of Contents
What' There we providing new listin $2.8m. T 98.9%, wi There we providing new listin of $1.3m 104.2%, w
Bu

M sales in San Half Moon Bay, South San deemed reliable Each Office Is et

MAY 2022 - MAY 2023
Single-Family Homes
Last 12 months, year-over-year.
Condos & Townhomes
Last 12 months, year-over-year

May2022 Jun2022 Jul2022 Aug2022 Sep2022 Oct2022 Nov2022 Dec2022 Jan2023 Feb2023 Mar2023 Apr2023 May2023 100 75 50 25 0 May2022 Jun2022 Jul2022 Aug2022 Sep2022 Oct2022 Nov2022 Dec2022 Jan2023 Feb2023 Mar2023 Apr2023 May2023 15 10 5 0
Burlingame
LISTINGS FOR SALE SOLD LISTINGS
Median SalesPrice
Single-Family Homes
The median sales price has decreased from $3m last May 2022, to $2 8m as of May 2023
Condos & Townhomes
The median sales price has decreased from $1.4m last May 2022, to $1.3m as of May 2023.
AVGDays OntheMarket
Single-Family Homes
The average time spent on the market went up from 8 days last May 2022, to 16 days as of May 2023
Condos & Townhomes
The average time spent on the market went up from 26 days in May 2022, to 14 days as of May 2023
Overbids
Single-Family Homes
The overbid percentage has decreased from 107 8% last May 2022, to 98 9% a year later
Condos & Townhomes
The overbid percentage has increased from 96.5% last May 2022, to 104.2% a year later.
May2022Jun2022 Jul2022Aug2022Sep2022Oct2022Nov2022Dec2022 Jan2023Feb2023Mar2023Apr2023May2023 $4,000,000 $3,000,000 $2,000,000 $1,000,000 $0 May2022 Jun2022 Jul2022Aug2022Sep2022Oct2022Nov2022Dec2022 Jan2023Feb2023Mar2023Apr2023May2023 75 50 25 0 May2022 Jun2022 Jul2022Aug2022Sep2022Oct2022Nov2022Dec2022 Jan2023Feb2023Mar2023Apr2023May2023 125% 100% 75% 50% 25% 0%
Back to Table of Contents

DalyCit
What's in the Daly Cit
There were 32 single-family home providing 0.4 months of inventory new listings, and 21 homes sold f $1.2m. The median overbid perce 107.8%, with an average of 14 da
There were 9 condo and townhom providing 2 months of inventory. listings, and 5 units sold at an ave The median overbid percentage w an average of 6 days on the mark


le Price ngs
Market
2M
condominium sales in San Foster City, Half Moon Bay, Mateo, and South San sources deemed reliable reserved. Each Office Is on

Mo 10 M

023 Apr2023 May2023 2023 Apr2023 May2023 y y S
Median SalesPrice
Single-Family Homes
The median sales price has decreased from $1 3m last May 2022, to $1 2m as of May 2023
Condos & Townhomes
The median sales price has decreased from $812k last May 2022, to $665k as of May 2023.
Overbids
Single-Family Homes
The overbid percentage has decreased from 112 3% last May 2022, to 107 8% a year later
Condos & Townhomes
The overbid percentage has decreased from 113.1% last May 2022, to 103.2% a year later.
Single-Family Homes
The average time spent on the market went down from 16 days last May 2022, to 14 days as of May 2023
Condos & Townhomes
The average time spent on the market went down from 11 days in May 2022, to 6 days as of May 2023
May2022Jun2022 Jul2022Aug2022Sep2022Oct2022Nov2022Dec2022 Jan2023Feb2023Mar2023Apr2023May2023 $1,500,000 $1,000,000 $500,000 $0 May2022 Jun2022 Jul2022Aug2022Sep2022Oct2022Nov2022Dec2022 Jan2023Feb2023Mar2023Apr2023May2023 100 75 50 25 0 May2022 Jun2022 Jul2022Aug2022Sep2022Oct2022Nov2022Dec2022 Jan2023Feb2023Mar2023Apr2023May2023 125% 100% 75% 50% 25% 0%
AVGDays OntheMarket
Back to Table of Contents

FosterCity
What's in the Foster City dat
There were 22 single-family homes for sale, providing 0.9 months of inventory. There we new listings, and 10 homes sold for an avera $2.3m. The median overbid percentage was 103.8%, with an average of 15 days on the m
There were 26 condo and townhome units fo sale, providing 1.4 months of inventory. Ther were 16 new listings, and 9 units sold for an average of of $1.3m. The median overbid percentage was 99.6%, with an average of 13 on the market.

He-Family Homes
ngs
9 f Inventory
10 Sold Listings
$2.3M Median Sale Price

3.8% ale vs List
15 Avg Days on Market
includes all single-family homes, townhome, and condominium sales in San unty, San Mateo County, Burlingame, Daly City, Foster City, Half Moon Bay, Millbrae, Pacifica, San Bruno, San Carlos, San Mateo, and South San sourced from Broker Metrics on June 5th. Data from sources deemed reliable errors and be subject to revision. © 2023. All rights reserved. Each Office Is Independently Owned and Operated. DRE# 01906450.

New Listings
Months of Inventory $1.3 Median S 99.6% Median Sale vs List Avg Days o Sold
Condo & Townh
16
1.4
COND
sterCity
MAY 2022 - MAY 2023
GS FOR SALE SOLD LISTINGS
mily Homes onths, year-over-year.
Townhomes onths, year-over-year

Jul2022 Aug2022 Sep2022 Oct2022 Nov2022 Dec2022 Jan2023 Feb2023 Mar2023 Apr2023 May2023 Jul2022 Aug2022 Sep2022 Oct2022 Nov2022 Dec2022 Jan2023 Feb2023 Mar2023 Apr2023 May2023
Median SalesPrice
Single-Family Homes
The median sales price has remained at $2 3m since May 2022
Condos & Townhomes
The median sales price has remained at $1.3m since May 2022.
AVGDays OntheMarket
Single-Family Homes
The average time spent on the market went up from 12 days last May 2022, to 15 days as of May 2023
Condos & Townhomes
The average time spent on the market went down from 15 days in May 2022, to 13 days as of May 2023
Overbids
Single-Family Homes
The overbid percentage has decreased from 116 3% last May 2022, to 103 8% a year later
Condos & Townhomes
The overbid percentage has decreased from 109.7% last May 2022, to 99.6% a year later.
May2022Jun2022 Jul2022Aug2022Sep2022Oct2022Nov2022Dec2022 Jan2023Feb2023Mar2023Apr2023May2023 $3,000,000 $2,000,000 $1,000,000 $0 May2022 Jun2022 Jul2022Aug2022Sep2022Oct2022Nov2022Dec2022 Jan2023Feb2023Mar2023Apr2023May2023 50 40 30 20 10 0 May2022 Jun2022 Jul2022Aug2022Sep2022Oct2022Nov2022Dec2022 Jan2023Feb2023Mar2023Apr2023May2023 125% 100% 75% 50% 25% 0%
Back to Table of Contents

HalfMoon Bay
What's in the Half Moon Bay data?
There were 22 single-family homes for sale, providing 0.6 months of inventory. There we new listings, and 8 homes sold for an averag $1.6m. The median overbid percentage was 90 1%, with an average of 17 days on the ma
There were 4 condo and townhome units for providing 1 month of inventory. There were 4 listings, and 3 units sold for an average of $7 The median overbid percentage was 99.3%, an average of 10 days on the market.
He-Family Homes
ngs
6 f Inventory
8 Sold Listings
$1.6M Median Sale Price

.1% ale vs List
17 Avg Days on Market
includes all single-family homes, townhome, and condominium sales in San unty, San Mateo County, Burlingame, Daly City, Foster City, Half Moon Bay, Millbrae, Pacifica, San Bruno, San Carlos, San Mateo, and South San sourced from Broker Metrics on June 5th. Data from sources deemed reliable errors and be subject to revision. © 2023. All rights reserved. Each Office Is Independently Owned and Operated. DRE# 01906450.

New Listings
Months of Inventory $705 Median Sale 99.3% Median Sale vs List 1 Avg Days on M Sold Lis
Condo & Townhom
4
1
CONDO

23 Apr2023 May2023 2023 Apr2023 May2023 y S
Median SalesPrice
Single-Family Homes
The median sales price remained from $1 6m last May 2022, to $1 6m as of May 2023
Condos & Townhomes
The median sales price has decreased from $1m last May 2022, to $705k as of May 2023.
AVGDays OntheMarket
Single-Family Homes
The average time spent on the market went up from 11 days last May 2022, to 17 days as of May 2023
Condos & Townhomes
The average time spent on the market went up from 0 days in May 2022, to 10 days as of May 2023
Overbids
Single-Family Homes
The overbid percentage has decreased from 109 5% last May 2022, to 90 1% a year later
Condos & Townhomes
The overbid percentage has decreased from 104.7% last May 2022, to 99.3% a year later.
May2022Jun2022 Jul2022Aug2022Sep2022Oct2022Nov2022Dec2022 Jan2023Feb2023Mar2023Apr2023May2023 $2,500,000 $2,000,000 $1,500,000 $1,000,000 $500,000 $0 May2022 Jun2022 Jul2022Aug2022Sep2022Oct2022Nov2022Dec2022 Jan2023Feb2023Mar2023Apr2023May2023 100 75 50 25 0 May2022 Jun2022 Jul2022Aug2022Sep2022Oct2022Nov2022Dec2022 Jan2023Feb2023Mar2023Apr2023May2023 125% 100% 75% 50% 25% 0%
Back to Table of Contents

Hillsborough
What's in the Hillsborough data?
There were 47 single-family homes for sale, providing 2 8 months of inventory There were 16 new listings, and 7 homes sold for an average of $4.7m. The median overbid percentage was 86.9%, with an average of 44 days on the market.
There was no data for condo or townhome units this month.


sales in San Moon Bay, South San deemed reliable Office Is
M

MAY 2022 - MAY 2023
LISTINGS
Single-Family Homes
Last 12 months, year-over-year.
LISTINGS
Condos & Townhomes

May2022 Jun2022 Jul2022 Aug2022 Sep2022 Oct2022 Nov2022 Dec2022 Jan2023 Feb2023 Mar2023 Apr2023 May2023 60 40 20 0 100 75 50 25 0
Hillsborough
Last 12 months, year-over-year FOR SALE SOLD
No Data For This Month.
Median SalesPrice
Single-Family Homes
The median sales price has decreased from $6 8m last May 2022, to $4 7m as of May 2023
Condos & Townhomes
No Data For This Month.
Overbids
Single-Family Homes
The overbid percentage has decreased from 102 6% last May 2022, to 86 9% a year later
Condos & Townhomes
No Data For This Month.
AVGDays OntheMarket
Single-Family Homes
The average days on market went up from 16 days last May 2022, to 44 days as of May 2023
Condos & Townhomes No Data For This Month
May2022Jun2022 Jul2022Aug2022Sep2022Oct2022Nov2022Dec2022 Jan2023Feb2023Mar2023Apr2023May2023 $7,500,000 $5,000,000 $2,500,000 $0 May2022 Jun2022 Jul2022Aug2022Sep2022Oct2022Nov2022Dec2022 Jan2023Feb2023Mar2023Apr2023May2023 75 50 25 0 May2022 Jun2022 Jul2022Aug2022Sep2022Oct2022Nov2022Dec2022 Jan2023Feb2023Mar2023Apr2023May2023 125% 100% 75% 50% 25% 0%
Back to Table of Contents

MWhat' There we providing new listin $2m. The with an a There we providing listings, a The med an averag


sales in San Half Moon Bay, South San deemed reliable Each Office Is et
CONDO
Condo & Townhomes
2 New Listings

3 Sold Listings
3 Months of Inventory
$950K Median Sale Price
108.1% Median Sale vs List
7 Avg Days on Market

y y
Median SalesPrice
Single-Family Homes
The median sales price has decreased from $2 5m last May 2022, to $2m as of May 2023
Condos & Townhomes
The median sales price has decreased from $1m last May 2022, to $950k as of May 2023.
AVGDays OntheMarket
Single-Family Homes
The average time spent on the market went up from 11 days last May 2022, to 13 days as of May 2023
Condos & Townhomes
The average time spent on the market went up from 5 days in May 2022, to 7 days as of May 2023
Overbids
Single-Family Homes
The overbid percentage has decreased from 113 4% last May 2022, to 102 8% a year later
Condos & Townhomes
The overbid percentage has increased from 96.9% last May 2022, to 108.1% a year later.
May2022Jun2022 Jul2022Aug2022Sep2022Oct2022Nov2022Dec2022 Jan2023Feb2023Mar2023Apr2023May2023 $3,000,000 $2,000,000 $1,000,000 $0 May2022 Jun2022 Jul2022Aug2022Sep2022Oct2022Nov2022Dec2022 Jan2023Feb2023Mar2023Apr2023May2023 75 50 25 0 May2022 Jun2022 Jul2022Aug2022Sep2022Oct2022Nov2022Dec2022 Jan2023Feb2023Mar2023Apr2023May2023 125% 100% 75% 50% 25% 0%
Back to Table of Contents

Pacifi
What's in the
There were 34 singleproviding 1 month of listings, and 18 home $1.3m. The median ov 104.7%, with an avera
There were 3 condo a providing 2 months of listings, but 3 units so The median overbid p an average of 67 days

s
8 d Listings

1.3M an Sale Price
6 Days on Market
townhome, and condominium sales in San Daly City, Foster City, Half Moon Bay, Carlos, San Mateo, and South San
Data from sources deemed reliable
All rights reserved. Each Office Is
M

Sep2022 Oct2022 Nov2022 Dec2022 Jan2023 Feb2023 Mar2023 Apr2023 May2023 Sep2022 Oct2022 Nov2022 Dec2022 Jan2023 Feb2023 Mar2023 Apr2023 May2023 a MAY 2022 - MAY 2023 mes ear-over-year. mes year-over-year
SOLD LISTINGS
SALE
Median SalesPrice
Single-Family Homes
The median sales price has decreased from $1 5m last May 2022, to $1 3m as of May 2023
Condos & Townhomes
The median sales price has decreased from $1m last May 2022, to $780k as of May 2023.
Overbids
Single-Family Homes
The overbid percentage has decreased from 113 3% last May 2022, to 104 7% a year later
Condos & Townhomes
The overbid percentage has decreased from 108.8% last May 2022, to 95.7% a year later.
Single-Family Homes
The average time spent on the market went up from 13 days last May 2022, to 36 days as of May 2023
Condos & Townhomes
The average time spent on the market went up from 7 days in May 2022, to 67 days as of May 2023
May2022Jun2022 Jul2022Aug2022Sep2022Oct2022Nov2022Dec2022 Jan2023Feb2023Mar2023Apr2023May2023 $2,000,000 $1,500,000 $1,000,000 $500,000 $0 May2022 Jun2022 Jul2022Aug2022Sep2022Oct2022Nov2022Dec2022 Jan2023Feb2023Mar2023Apr2023May2023 150 100 50 0 May2022 Jun2022 Jul2022Aug2022Sep2022Oct2022Nov2022Dec2022 Jan2023Feb2023Mar2023Apr2023May2023 125% 100% 75% 50% 25% 0%
AVGDays OntheMarket
Back to Table of Contents

SanB
What's in th
There were 26 sing providing 0.3 mon new listings, and 1 $1.4m. The media 105.3%, with an av
There were 9 cond providing 0.3 mon new listings, and 3 $490k. The median 107.6%, with an av


San Bay, San reliable Is
0. Months of Inven
107.6% Median Sale vs
New List
C

2022 Jan2023 Feb2023 Mar2023 Apr2023 May2023 2022 Jan2023 Feb2023 Mar2023 Apr2023 May2023 o y y
OLD LISTINGS
Median SalesPrice
Single-Family Homes
The median sales price has decreased from $1 5m last May 2022, to $1 4m as of May 2023
Condos & Townhomes
The median sales price has decreased from $545k last May 2022, to $490k as of May 2023.
Overbids
Single-Family Homes
The overbid percentage has decreased from 113 9% last May 2022, to 105 3% a year later
Condos & Townhomes
The overbid percentage has increased from 99.9% last May 2022, to 107.6% a year later.
Single-Family Homes
The average time spent on the market went down from 12 days last May 2022, to 10 days as of May 2023
Condos & Townhomes
The average time spent on the market went down from 17 days in May 2022, to 14 days as of May 2023
May2022Jun2022 Jul2022Aug2022Sep2022Oct2022Nov2022Dec2022 Jan2023Feb2023Mar2023Apr2023May2023 $2,000,000 $1,500,000 $1,000,000 $500,000 $0 May2022 Jun2022 Jul2022Aug2022Sep2022Oct2022Nov2022Dec2022 Jan2023Feb2023Mar2023Apr2023May2023 100 75 50 25 0 May2022 Jun2022 Jul2022Aug2022Sep2022Oct2022Nov2022Dec2022 Jan2023Feb2023Mar2023Apr2023May2023 125% 100% 75% 50% 25% 0%
AVGDays OntheMarket
Back to Table of Contents

SanCarlos
What's in the San Carlos data?
There were 62 single-family homes for sale, providing 1.3 months of inventory. There were 37 new listings, and 24 homes sold for an average of $2.4m. The median overbid percentage was 104.8%, with an average of 11 days on the market.
There were 30 condo and townhome units for sale, providing 1.3 months of inventory. There were 20 new listings, and 12 units sold for an average of $884k. The median overbid percentage was 98.9%, with an average of 12 days on the market.

SFH Single-Family Homes
37 New Listings

24 Sold Listings
1.3 Months of Inventory
$2.4M Median Sale Price
104.8% Median Sale vs List
11 Avg Days on Market
The data includes all single-family homes, townhome, and condominium sales in San Francisco County, San Mateo County, Burlingame, Daly City, Foster City, Half Moon Bay, Hillsborough, Millbrae, Pacifica, San Bruno, San Carlos, San Mateo, and South San Francisco sourced from Broker Metrics on June 5th. Data from sources deemed reliable may contain errors and be subject to revision. © 2023. All rights reserved. Each Office Is Independently Owned and Operated. DRE# 01906450.
New Listings 1.3 Months of Inventory $884K Median Sale Price 98.9% Median Sale vs List 12 Avg Days on Market 12 Sold Listings CONDO Condo & Townhomes
20
MAY 2022 - MAY 2023
Single-Family Homes
Last 12 months, year-over-year.
Condos & Townhomes
Last 12 months, year-over-year

May2022 Jun2022 Jul2022 Aug2022 Sep2022 Oct2022 Nov2022 Dec2022 Jan2023 Feb2023 Mar2023 Apr2023 May2023 100 75 50 25 0 May2022 Jun2022 Jul2022 Aug2022 Sep2022 Oct2022 Nov2022 Dec2022 Jan2023 Feb2023 Mar2023 Apr2023 May2023 50 40 30 20 10 0 SanCarlos
LISTINGS FOR SALE SOLD LISTINGS
Median SalesPrice
Single-Family Homes
The median sales price has decreased from $2 9m last May 2022, to $2 4m as of May 2023
Condos & Townhomes
The median sales price has decreased from $1.1m last May 2022, to $884k as of May 2023.
Overbids
Single-Family Homes
The overbid percentage has decreased from 111 2% last May 2022, to 104 8% a year later
Condos & Townhomes
The overbid percentage has decreased from 110.4% last May 2022, to 98.9% a year later.
Single-Family Homes
The average time spent on the market remained from 11 days last May 2022, to 11 days as of May 2023
Condos & Townhomes
The average time spent on the market went up from 10 days in May 2022, to 12 days as of May 2023
May2022Jun2022 Jul2022Aug2022Sep2022Oct2022Nov2022Dec2022 Jan2023Feb2023Mar2023Apr2023May2023 $3,000,000 $2,000,000 $1,000,000 $0 May2022 Jun2022 Jul2022Aug2022Sep2022Oct2022Nov2022Dec2022 Jan2023Feb2023Mar2023Apr2023May2023 75 50 25 0 May2022 Jun2022 Jul2022Aug2022Sep2022Oct2022Nov2022Dec2022 Jan2023Feb2023Mar2023Apr2023May2023 125% 100% 75% 50% 25% 0%
AVGDays OntheMarket
Back to Table of Contents
SanMateo
What's in the San Mateo data?
There were 75 single-family homes for sale, providing 0.9 months of inventory. There were 46 new listings, and 35 homes sold for an average of $2.1m. The median overbid percentage was 104.8%, with an average of 15 days on the market.
There were 84 condo and townhome units for sale, providing 2.2 months of inventory. There were 27 new listings, and 22 units sold for an average of $892k. The median overbid percentage was 101.7%, with an average of 34 days on the market.

sales in San Moon Bay, South San deemed reliable Each Office Is t
M


Oct2022 Nov2022 Dec2022 Jan2023 Feb2023 Mar2023 Apr2023 May2023 Oct2022 Nov2022 Dec2022 Jan2023 Feb2023 Mar2023 Apr2023 May2023 ateo ver-year. ver-year E SOLD LISTINGS
Median SalesPrice
Single-Family Homes
The median sales price remained from $2 1m last May 2022, to $2 1m as of May 2023
Condos & Townhomes
The median sales price has decreased from $985k last May 2022, to $892k as of May 2023.
AVGDays OntheMarket
Single-Family Homes
The average time spent on the market went up from 12 days last May 2022, to 15 days as of May 2023
Condos & Townhomes
The average time spent on the market went up from 22 days in May 2022, to 34 days as of May 2023
Overbids
Single-Family Homes
The overbid percentage has decreased from 114% last May 2022, to 104 8% a year later
Condos & Townhomes
The overbid percentage has decreased from 104.4% last May 2022, to 101.7% a year later.
May2022Jun2022 Jul2022Aug2022Sep2022Oct2022Nov2022Dec2022 Jan2023Feb2023Mar2023Apr2023May2023 $2,500,000 $2,000,000 $1,500,000 $1,000,000 $500,000 $0 May2022 Jun2022 Jul2022Aug2022Sep2022Oct2022Nov2022Dec2022 Jan2023Feb2023Mar2023Apr2023May2023 50 40 30 20 10 0 May2022 Jun2022 Jul2022Aug2022Sep2022Oct2022Nov2022Dec2022 Jan2023Feb2023Mar2023Apr2023May2023 125% 100% 75% 50% 25% 0%
Back to Table of Contents

SouthSan Francisco
What's in the South San Francisco data?
There were 18 single-family homes for sale, providing 0.7 months of inventory. There were 9 new listings, and 7 homes sold for an average of $1.1m. The median overbid percentage was 106 4%, with an average of 15 days on the market
There were 5 condo and townhome units for sale, providing 0.2 months of inventory. There were 3 new listings, and 3 units sold for an average of $765k. The median overbid percentage was 106.9%, with an average of 10 days on the market.

Listings
1.1M
n Sale Price
5 ys on Market
and condominium sales in San City, Foster City, Half Moon Bay, Carlos, San Mateo, and South San from sources deemed reliable rights reserved. Each Office Is

0. Months of Inven
106.9% Median Sale vs

New List
C

2022 Jan2023 Feb2023 Mar2023 Apr2023 May2023 2022 Jan2023 Feb2023 Mar2023 Apr2023 May2023 Francisco y y OLD LISTINGS
Median SalesPrice
Single-Family Homes
The median sales price has decreased from $1 6m last May 2022, to $1 1m as of May 2023
Condos & Townhomes
The median sales price has decreased from $952k last May 2022, to $765k as of May 2023.
Overbids
Single-Family Homes
The overbid percentage has decreased from 115 2% last May 2022, to 106 4% a year later
Condos & Townhomes
The overbid percentage has increased from 106.6% last May 2022, to 106.9% a year later.
Single-Family Homes
The average time spent on the market went down from 19 days last May 2022, to 15 days as of May 2023
Condos & Townhomes
The average time spent on the market went up from 9 days in May 2022, to 10 days as of May 2023
May2022Jun2022 Jul2022Aug2022Sep2022Oct2022Nov2022Dec2022 Jan2023Feb2023Mar2023Apr2023May2023 $2,000,000 $1,500,000 $1,000,000 $500,000 $0 May2022 Jun2022 Jul2022Aug2022Sep2022Oct2022Nov2022Dec2022 Jan2023Feb2023Mar2023Apr2023May2023 100 75 50 25 0 May2022 Jun2022 Jul2022Aug2022Sep2022Oct2022Nov2022Dec2022 Jan2023Feb2023Mar2023Apr2023May2023 125% 100% 75% 50% 25% 0%
AVGDays OntheMarket
Back to Table of Contents


1430 Howard Avenue, Burlingame, CA 94010 Mara Belluomini DRE#02152343
Address: Marabell@kw.com Website: mara.belluomini@kw.com Primary Office Location(s) 1430 Howard Avenue, Burlingame, CA 94010, 16 E 3rd Avenue, San Mateo, CA 94401 KellerWilliamsPeninsulaEstates :
Email


