Market Report


March 2023 Copyright by KW Advisors 2023
Palo Alto area
Palo Alto
Jump to Palo Alto Report
Redwood City
Jump to Redwood City Report
Portola Valley
Jump to Portola Valley Report
Menlo Park
Jump to Menlo Report
Atherton
Jump to Atherton Report
Los Altos
Jump to Los Altos Report
San Jose
Jump to San Jose Report
Mountain View
Jump to Mountain View
San Mateo County
Jump to San Mateo County
Santa Clara County
Jump to Santa Clara County
Monterey County
Jump to Monterey County Report
Santa Cruz County
Jump to Santa Cruz County Report
East Palo Alto
Jump to East Palo Alto Report
Sunnyvale

Jump to Sunnyvale Report
Santa Clara City
Jump to Santa Clara City Report
Saratoga
Jump to Saratoga Report
What’syourhome reallyworthintoday’s market?
That's really the question you should be asking yourself.
Our market is incredibly diverse, and rapidly changing. Values vary not just by neighborhood, but by street. Your home isn't necessarily worth what your neighbors’ home is. At the end of the day, it’s the current market that sets the value of your home.
So, do you know what your home is worth in today's market?
Icanhelp...
Contact me for a confidential, no obligation assessment of your home's value.
IsItReallyBetterToRent ThanToOwnaHomeRight Now?
You may have seen reports in the news recently saying it’s better to rent right now than it is to own your home. But before you let that impact your decisions, you should understand what these claims are based on.
A lot of the time, these reports are assuming things that aren’t realistic for the average household. For example, the methodology behind one of those reports says that renting is the smarter financial option because of the opportunity to invest money elsewhere. It assumes renters take the money they’d spend on costs tied to buying a home and put it in an investment portfolio.

But here’s the thing – most people who rent aren’t making those investments. Ken Johnson, Co-Author of the BH&J National Price-toRent Index, explains:
“One of the difficulties with the rent and reinvest model is many people . . . simply rent and spend the difference. . . . That’s wealth destroying. ”
So, before you renew your rental agreement, think about the opportunity to build wealth that homeownership provides.
Bottom Line
If you’re unsure whether to continue renting or to buy a home, work with a real estate advisor who can help you make the best decision.
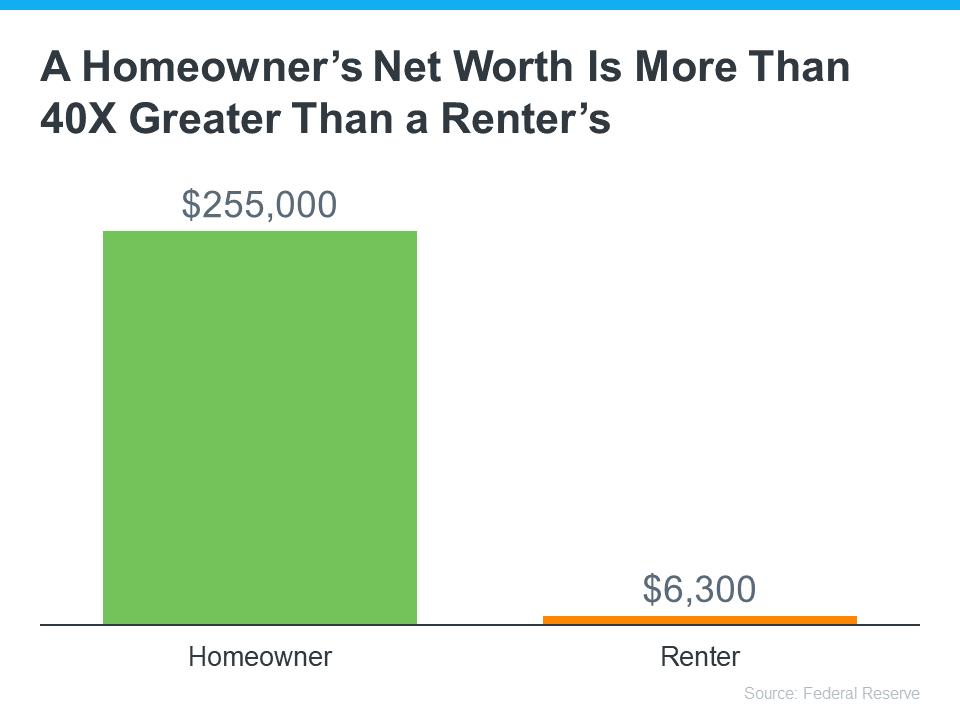
The reason homeownership is one of the best investments you can make is the wealth it helps you build. That’s why there’s a significant difference between the net worth of the average homeowner and the average renter (see graph below): Source: Keeping Current Matters
PaloAlto
What's in the Palo Alto data?
In February, Palo Alto had 79 homes for sale providing the market with 1.3 months of inventory. There were 36 new listings and a total of 12 homes sold The median sale price was $3.6m, and the median overbid was 102%. The average time on the market was 31 days.
There are 24 condo and townhome units for sale, providing the market with 2.2 months of inventory There were 5 new listings for sale and only 1 condo sold, with a median sale price of $1.8m, and a median overbid of 100%. The average time on the market was 24 days.

He-Family Homes
ings
3 of Inventory
12 Sold Listings
$3.6M Median Sale Price
2% Sale vs List
31 Avg Days on Market
was sourced from Broker Metrics on March 3rd, 2023 and includes all singles, condos, and townhomes in the California Area above from February 2022 2023. This may include preliminary data, and vary from the time the data gathered. All data is deemed reliable but not guaranteed. Questions may be KW Advisors. 415.483.9285. Palo Alto | DRE# 01511642 Copyright KW Advisors 2023. Each Office is independently owned and operated.
CONDO
Condo & Townhomes
5 New Listings

1 Sold Listings
2.2 Months of Inventory
$1.8M Median Sale Price
100% Median Sale vs List
24 Avg Days on Market
June2022 July2022August2022September2022October2022November2022December2022January2023February2023 June2022 July2022August2022September2022October2022November2022December2022January2023February2023 Alto FEBRUARY 2022 - FEBRUARY 2023 mes ear-over-year. mes year-over-year LISTINGS FOR SALE SOLD LISTINGS
Median SalesPrice
The median sales price has decreased from $4 1m last February 2022, to $3 6m as of February 2023
The median sales price has increased from $1m last February 2022, to $1 8m as of February 2023
Overbids
Single-Family Homes
The overbid percentage has decreased from 113 3% last February 2022, to 102% a year later
Condos & Townhomes
The overbid percentage has decreased from 99.1% last February 2022, to 100% a year later
Single-Family
The average days on market went up from 11 days last February 2022, to 31 days as of February 2023
Condos
The average days on market went up from 9 days in February 2022, to 24 days as of February 2023.
February2022March2022April2022May2022June2022July2022August2022September2022October2022November2022December2022January2023February2023 $5,000,000 $4,000,000 $3,000,000 $2,000,000 $1,000,000 $0 February2022March2022April2022May2022June2022 July2022August2022September2022October2022November2022December2022January2023February2023 150 100 50 0 February2022March2022April2022May2022June2022 July2022August2022September2022October2022November2022December2022January2023February2023 125% 100% 75% 50% 25% 0%
Condos & Townhomes
Single-Family Homes
AVGDays OntheMarket
& Townhomes
Homes
Back to Table of Contents

Redwood City
What's in the Redwood City data?
In February, Redwood City had 23 single-family homes sold, a median sale price of $1 8m The median overbid was at 97.7% and the average time on the market was 26 days. In terms of inventory, there are currently 26 homes for sale providing the market with 1.1 months of inventory.
For condos, there were a total of 5 units sold. The median sale price increased from to $1 2m, and the median overbid decreased to 95.2%. The average time on the market decreased to 30 days. There are currently 12 condos for sale providing the market with 1.2 months of inventory.

mes
23 Sold Listings
$1.8M Median Sale Price
26 Avg Days on Market
on March 3rd, 2023 and includes all singleCalifornia Area above from February 2022 preliminary data, and vary from the time the data but not guaranteed. Questions may be Palo Alto | DRE# 01511642 Copyright KW Each Office is independently owned and operated.
CONDO
Condo & Townhomes
12 New Listings
5 Sold Listings
1.2 Months of Inventory
$1.2M Median Sale Price

95.2% Median Sale vs List
30 Avg Days on Market
LISTINGS FOR SALE SOLD LISTINGS
y y
Median SalesPrice
The median sales price has decreased from $2 4m last February 2022, to $1 8m as of February 2023
Condos
The median sales price has decreased from $1 7m last February 2022, to $1 2m as of February 2023
Overbids
Single-Family Homes
The overbid percentage has decreased from 116 2% last February 2022, to 97 7% a year later
Condos & Townhomes
The overbid percentage has decreased from 112.3% last February 2022, to 95.2% a year later
Single-Family
The average days on market went up from 12 days last February 2022, to 26 days as of February 2023
Condos
The average days on market went up from 11 days in February 2022, to 30 days as of February 2023.
February2022March2022April2022May2022June2022July2022August2022September2022October2022November2022December2022January2023February2023 $3,000,000 $2,000,000 $1,000,000 $0 February2022March2022April2022May2022June2022 July2022August2022September2022October2022November2022December2022January2023February2023 60 40 20 0 February2022March2022April2022May2022June2022 July2022August2022September2022October2022November2022December2022January2023February2023 125% 100% 75% 50% 25% 0%
& Townhomes
Single-Family Homes
AVGDays OntheMarket
& Townhomes
Homes
Back to Table of Contents

Portola Valley
What's in the Portola Valley data?
In February, there were 12 single-family homes for sale with 6 new listings and 2 homes sold. The median sale price was $6.7m with an overbid of 84.3%. The average days on market was 15.
There are currently no condos for sale, inventory, new listings, or condo sales reported in February and January.

CONDO
Condo & Townhomes
No data for this month
r2022October2022November2022December2022January2023February2023 alley y y LISTINGS FOR SALE SOLD LISTINGS No data for this month
Median SalesPrice
Single-Family
The median sales price has increased from $0 last February 2022, to $6 7m as of February 2023
Condos
No data for this month
AVGDays OntheMarket
Single-Family Homes
The average days on market went up from 0 days last February 2022, to 15 days as of February 2023
Condos
The average days on market went up from 0 days in February 2022, to 0 days as of February 2023.
Overbids
Single-Family Homes
The overbid percentage has increased from 0% last February 2022, to 84 3% a year later
Condos & Townhomes
The overbid percentage has decreased from 0% last February 2022, to 0% a year later
February2022March2022April2022May2022June2022July2022August2022September2022October2022November2022December2022January2023February2023 $7,500,000 $5,000,000 $2,500,000 $0 February2022March2022April2022May2022June2022 July2022August2022September2022October2022November2022December2022January2023February2023 150 100 50 0 February2022March2022April2022May2022June2022 July2022August2022September2022October2022November2022December2022January2023February2023 125% 100% 75% 50% 25% 0%
& Townhomes
Homes
& Townhomes
Back to Table of Contents

MenloPark
What's in the Menlo Park data?
The real estate market in Menlo Park shows a strong demand for single-family homes, with only 0.8 months of inventory currently available for sale. In February, there were 21 new listings and 22 homes sold, providing 0.8 months of inventory; with a median sale price of $4.2m and median overbid of 96.5%. The average time on the market was 22 days.
The condo market in Menlo Park has 1.2 months of inventory currently available for sale There were 3 new condo listings and 1 condo sold, with a median sale price of $1.2m and a median overbid of 98.1%. The average time on the market for condos was 52 days.

CONDO
Condo & Townhomes
3 New Listings
1 Sold Listings
1.2 Months of Inventory
$1.2M Median Sale Price
98.1% Median Sale vs List
52 Avg Days on Market
l2022 May2022 June2022 July2022August2022September2022October2022November2022December2022January2023February2023 il2022 May2022 June2022 July2022August2022September2022October2022November2022December2022January2023February2023 nloPark FEBRUARY 2022 - FEBRUARY 2023 ly Homes nths, year-over-year. ownhomes nths, year-over-year LISTINGS FOR SALE SOLD LISTINGS
Median SalesPrice
The median sales price has increased from $3 4m last February 2022, to $4 2m as of February 2023
The
Overbids
Single-Family Homes
Condos & Townhomes
Single-Family
The average days on market went up from 8 days last February 2022, to 22 days as of February 2023
February2022March2022April2022May2022June2022July2022August2022September2022October2022November2022December2022January2023February2023 $5,000,000 $4,000,000 $3,000,000 $2,000,000 $1,000,000 $0 February2022March2022April2022May2022June2022 July2022August2022September2022October2022November2022December2022January2023February2023 75 50 25 0 February2022March2022April2022May2022June2022 July2022August2022September2022October2022November2022December2022January2023February2023 125% 100% 75% 50% 25% 0%
& Townhomes
Condos
median sales price has decreased from $1 8m last February 2022, to $1 2m as of February 2023 Single-Family Homes
& Townhomes
AVGDays OntheMarket Condos
The average days on market went up from 12 days in February 2022, to 52 days as of February 2023. Homes
The overbid percentage has decreased from 100.5% last February 2022, to 98.1% a year later
Back to Table of Contents
The overbid percentage has decreased from 107 6% last February 2022, to 96 5% a year later

Atherton
What's in the Atherton data?
In February, Atherton had 27 single-family homes for sale, providing the market with 2.7 months of inventory. There were 6 new listings and a total of 9 homes sold, with a median sale price of $10.5m. The median sale overbid was 89.0%, and the average time on the market was 89 days.
There are currently no condos for sale, inventory, new listings, or condo sales reported in February and January.

No data for this month

uly2022August2022September2022October2022November2022December2022January2023February2023 on FEBRUARY 2022 - FEBRUARY 2023 er-year. er-year LISTINGS FOR SALE SOLD LISTINGS No data for this month
Median SalesPrice
Single-Family
Overbids
Single-Family Homes
The overbid percentage has decreased from 96 1% last February 2022, to 89% a year later
Condos & Townhomes
The overbid percentage has decreased from 0% last February 2022, to 0% a year later
Back to Table of Contents
AVGDays OntheMarket Condos
The average days on market went up from 7 days last February 2022, to 89 days as of February 2023
& Townhomes
February2022March2022April2022May2022June2022July2022August2022September2022October2022November2022December2022January2023February2023 $20,000,000 $15,000,000 $10,000,000 $5,000,000 $0 February2022March2022April2022May2022June2022 July2022August2022September2022October2022November2022December2022January2023February2023 100 75 50 25 0 February2022March2022April2022May2022June2022 July2022August2022September2022October2022November2022December2022January2023February2023 125% 100% 75% 50% 25% 0%
& Townhomes
Condos
No data for this month Homes
The median sales price has decreased from $16 8m last February 2022, to $10 5m as of February 2023
The average days on market went up from 0 days in February 2022, to 0 days as of February 2023. Homes
Single-Family

LosAltos
What's in the Los Altos data?
In February, Los Altos had 32 single-family homes for sale, providing the market with only 0.7 months of inventory. There were 14 new listings added, and 10 homes sold The median sale price for singlefamily homes was $4.9m, with a median overbid of 94.3%. The average time on the market for singlefamily homes was 28 days.
On the other hand, the condo market in Los Altos has a much smaller inventory with only 8 units for sale. In February, 3 new listings were added, but no condos were sold The median sale price for condos was not available as there were no sales. The median sale over ask percentage for February was 94.3%.

SFH Single-Family Homes
14 New Listings
10 Sold Listings
0.7 Months of Inventory
$4.9M Median Sale Price
94.3% Median Sale vs List
28 Avg Days on Market
This data was sourced from Broker Metrics on March 3rd, 2023 and includes all singlefamily homes, condos, and townhomes in the California Area above from February 2022 to February 2023. This may include preliminary data, and vary from the time the data was gathered. All data is deemed reliable but not guaranteed. Questions may be directed to KW Advisors. 415.483.9285. Palo Alto | DRE# 01511642 Copyright KW Advisors 2023. Each Office is independently owned and operated.

New Listings 0 Months of Inventory $0 Median Sale Price 94.3% Median Sale vs List 0 Avg Days on Market 0 Sold Listings
Condo & Townhomes
3
CONDO
Single-Family Homes
Last 12 months, year-over-year.
Condos & Townhomes
Last 12 months, year-over-year
February2022 March2022 April2022 May2022 June2022 July2022August2022September2022October2022November2022December2022January2023February2023 125 100 75 50 25 0 February2022 March2022 April2022 May2022 June2022 July2022August2022September2022October2022November2022December2022January2023February2023 25 20 15 10 5 0 LosAltos FEBRUARY 2022 - FEBRUARY 2023
LISTINGS FOR SALE SOLD LISTINGS
Median SalesPrice
Single-Family Homes
The median sales price has increased from $4 6m last February 2022, to $4 9m as of February 2023
The median sales price has decreased from $1 3m last February 2022, to $0 as of February 2023
Overbids
Single-Family Homes
The overbid percentage has decreased from 115 2% last February 2022, to 94 3% a year later
Condos & Townhomes
The overbid percentage has decreased from 97.9% last February 2022, to 0% a year later
The average days on market went up from 9 days last February 2022, to 28 days as of February 2023
The average days on market went down from 12 days in February 2022, to 0 days as of February 2023.
February2022March2022April2022May2022June2022July2022August2022September2022October2022November2022December2022January2023February2023 $5,000,000 $4,000,000 $3,000,000 $2,000,000 $1,000,000 $0 February2022March2022April2022May2022June2022 July2022August2022September2022October2022November2022December2022January2023February2023 200 150 100 50 0 February2022March2022April2022May2022June2022 July2022August2022September2022October2022November2022December2022January2023February2023 125% 100% 75% 50% 25% 0%
Condos & Townhomes
AVGDays OntheMarket
Condos & Townhomes
Single-Family Homes
Back to Table of Contents

SanJose
What's in the San Jose data?
In February, San Jose had 520 single-family homes for sale, providing the market with only 0.8 months of inventory. There were 269 new listings, and 165 homes were sold The median sale price for single-family homes was $1.4m, and the median overbid was 99.8%. The average time on the market for single-family homes was 23 days.
There are 244 condo and townhome units, providing the market with 0.8 months of inventory There were 108 new listings and 102 condos sold. The median sale price for condos was $755k, and the median overbid was 99.6%. The average time on the market for condos was 30 days.

SFH Single-Family Homes
269 New Listings
165 Sold Listings
0.8 Months of Inventory
$1.4M Median Sale Price
99.8% Median Sale vs List
23 Avg Days on Market
This data was sourced from Broker Metrics on March 3rd, 2023 and includes all singlefamily homes, condos, and townhomes in the California Area above from February 2022 to February 2023. This may include preliminary data, and vary from the time the data was gathered. All data is deemed reliable but not guaranteed. Questions may be directed to KW Advisors. 415.483.9285. Palo Alto | DRE# 01511642 Copyright KW Advisors 2023. Each Office is independently owned and operated.
CONDO
Condo & Townhomes
108 New Listings

102 Sold Listings
0.8 Months of Inventory
$755K Median Sale Price
99.6% Median Sale vs List
30 Avg Days on Market
Single-Family Homes
Last 12 months, year-over-year.
Condos & Townhomes
Last 12 months, year-over-year
February2022 March2022 April2022 May2022 June2022 July2022August2022September2022October2022November2022December2022January2023February2023 2000 1500 1000 500 0 February2022 March2022 April2022 May2022 June2022 July2022August2022September2022October2022November2022December2022January2023February2023 750 500 250 0 SanJose FEBRUARY 2022 - FEBRUARY 2023
LISTINGS FOR SALE SOLD LISTINGS
Median SalesPrice
Single-Family Homes
The median sales price has decreased from $1 6m last February 2022, to $1 4m as of February 2023
Condos
The median sales price has decreased from $860k last February 2022, to $755k as of February 2023
Overbids
Single-Family Homes
The overbid percentage has decreased from 117 6% last February 2022, to 99 8% a year later
Condos & Townhomes
The overbid percentage has decreased from 109.5% last February 2022, to 99.6% a year later
Single-Family Homes
The average days on market went up from 9 days last February 2022, to 23 days as of February 2023
Condos
The average days on market went up from 11 days in February 2022, to 30 days as of February 2023.
February2022March2022April2022May2022June2022July2022August2022September2022October2022November2022December2022January2023February2023 $2,000,000 $1,500,000 $1,000,000 $500,000 $0 February2022March2022April2022May2022June2022 July2022August2022September2022October2022November2022December2022January2023February2023 50 40 30 20 10 0 February2022March2022April2022May2022June2022 July2022August2022September2022October2022November2022December2022January2023February2023 125% 100% 75% 50% 25% 0%
& Townhomes
AVGDays OntheMarket
& Townhomes
Back to Table of Contents

Mountain View

What's in the Mountain View data?
In February, Mountain View had 22 homes for sale, providing the market with 0.8 months of inventory There were 8 new listings added, and a total of 12 homes were sold with a median sale price of $2.6m. The median overbid was 100%, and the average time on the market was 25 days.
There are 41 condo and townhome units for sale, providing the market with 0.9 months of inventory 17 new listings were added, and a total of 13 condos were sold with a median sale price of $1.4m. The median overbid was 103%, and the average time on the market was 17 days.
M rice includes all singlefrom February 2022 the time the data Questions may be 01511642 Copyright KW Market
17 New Listings
Townhomes
13 Sold Listings
0.9 Months of Inventory
$1.4M Median Sale Price
103% Median Sale vs List
17 Avg Days on Market

&
CONDO Condo
Last 12 months, year-over-year.
Condos & Townhomes
Last 12 months, year-over-year
February2022 March2022 April2022 May2022 June2022 July2022August2022September2022October2022November2022December2022January2023February2023 100 75 50 25 0 February2022 March2022 April2022 May2022 June2022 July2022August2022September2022October2022November2022December2022January2023February2023 125 100 75 50 25 0 MountainView FEBRUARY 2022 - FEBRUARY 2023
Single-Family Homes
LISTINGS FOR SALE SOLD LISTINGS
Median SalesPrice
Single-Family Homes
The median sales price has increased from $2 5m last February 2022, to $2 6m as of February 2023
The median sales price is the same with $1 4m last February 2022 and $1 4m as of February 2023
Overbids
Single-Family Homes
The overbid percentage has decreased from 122 6% last February 2022, to 100% a year later
Condos & Townhomes
The overbid percentage has decreased from 107.7% last February 2022, to 103% a year later
Single-Family
The average days on market went up from 10 days last February 2022, to 25 days as of February 2023
Condos
The average days on market went up from 9 days in February 2022, to 17 days as of February 2023.
February2022March2022April2022May2022June2022July2022August2022September2022October2022November2022December2022January2023February2023 $4,000,000 $3,000,000 $2,000,000 $1,000,000 $0 February2022March2022April2022May2022June2022 July2022August2022September2022October2022November2022December2022January2023February2023 75 50 25 0 February2022March2022April2022May2022June2022 July2022August2022September2022October2022November2022December2022January2023February2023 125% 100% 75% 50% 25% 0%
Condos & Townhomes
AVGDays OntheMarket
& Townhomes
Homes
Back to Table of Contents

SanMateo County
What's in the San Mateo County data?
In February, San Mateo had 296 single-family homes for sale, providing the market with 0.9 months of inventory There were 264 new listings and a total of 176 homes sold. The median sale price for single-family homes was $2m. The median overbid for single-family homes was 100.0%, which is the same as in January. The average time on the market for single-family homes was 35 days.
There were 138 condo and townhome units for sale, providing the market with 1.3 months of inventory. There were 107 new listings for sale and a total of 72 condos sold. The median sale price for condos was $983k. The median overbid was 99 2% The average time on the market was 45 days.

2023 and includes all singleabove from February 2022 vary from the time the data guaranteed. Questions may be 01511642 Copyright KW Each Office is independently owned and operated.
M
ale Price 6 ngs
on Market
CONDO

Condo & Townhomes
107 New Listings
72 Sold Listings
1.3 Months of Inventory
$983K Median Sale Price
99.2% Median Sale vs List
45 Avg Days on Market
LISTINGS FOR SALE SOLD LISTINGS
uary2023 bruary2023 y y
Median SalesPrice
Single-Family Homes
The median sales price has decreased from $1 97m last February 2022, to $2m as of February 2023
Condos & Townhomes
The median sales price has decreased from $1m last February 2022, to $983k as of February 2023
Overbids
Single-Family Homes
The overbid percentage has decreased from 114% last February 2022, to 100% a year later
Condos & Townhomes
The overbid percentage has decreased from 105.4% last February 2022, to 99.2% a year later
The average days on market went up from 16 days last February 2022, to 35 days as of February 2023
The average days on market went up from 26 days in February 2022, to 45 days as of February 2023.
February2022March2022April2023May2023June2022July2023August2023September2023October2023November2022December2022January2023February2023 $2,500,000 $2,000,000 $1,500,000 $1,000,000 $500,000 $0 February2022March2022April2023May2023June2022 July2022August2022September2022October2022November2022December2022January2023February2023 60 40 20 0 February2022March2022April2023May2023June2022 July2022August2022September2022October2022November2022December2022January2023February2023 125% 100% 75% 50% 25% 0%
AVGDays OntheMarket
Condos & Townhomes
Single-Family Homes
Back to Table of Contents

SantaClara County
What's in the Santa Clara County data?
In February, Santa Clara had 543 single-family homes for sale providing the market with 0 8 months of inventory. In February, there were 624 new listings and a total of 352 homes sold, with a median sale price of $1.5m. The median overbid was 100%, and the average time on the market was 33 days.
There are currently a total of 229 units for sale providing the market with 0.7 months of inventory. There were 243 new listings for sale, and a total of 183 condos sold with a median sale price of $850k. The median overbid was 100%, and the average time on the market was 33 days

SFH Single-Family Homes
624 New Listings
352 Sold Listings
0.8 Months of Inventory
$1.5M Median Sale Price
100% Median Sale vs List
33 Avg Days on Market
This data was sourced from InfoSparks on March 3rd, 2023 and includes all singlefamily homes, condos, and townhomes in the California Area above from February 2022 to February 2023. This may include preliminary data, and vary from the time the data was gathered. All data is deemed reliable but not guaranteed. Questions may be directed to KW Advisors. 415.483.9285. Palo Alto | DRE# 01511642 Copyright KW Advisors 2023. Each Office is independently owned and operated.
243 New Listings
0.7 Months of Inventory
$850K Median Sale Price 100% Median Sale vs List 33 Avg Days on Market
& Townhomes
183 Sold Listings CONDO Condo
e2022 July2022August2022September2022October2022November2022December2022January2023February2023 ne2022 July2022August2022September2022October2022November2022December2022January2023February2023 ClaraCounty FEBRUARY 2022 - FEBRUARY 2023 s r-over-year. es y r-over-year LISTINGS FOR SALE SOLD LISTINGS
Median SalesPrice
Single-Family Homes
The median sales price has decreased from $1 8m last February 2022, to $1 5m as of February 2023
Condos & Townhomes
The median sales price has decreased from $985k last February 2022, to $850k as of February 2023
Overbids
Single-Family Homes
The overbid percentage has decreased from 115 8% last February 2022, to 100% a year later
Condos & Townhomes
The overbid percentage has decreased from 107.9% last February 2022, to 100% a year later
Single-Family Homes
The average days on market went up from 15 days last February 2022, to 33 days as of February 2023
Condos
The average days on market went up from 16 days in February 2022, to 33 days as of February 2023.
February2022March2022April2023May2023June2022July2022August2022September2022October2022November2022December2022January2023February2023 $2,000,000 $1,500,000 $1,000,000 $500,000 $0 February2022March2022April2023May2023June2022 July2022August2022September2022October2022November2022December2022January2023February2023 40 30 20 10 0 February2022March2022April2023May2023June2022 July2022August2022September2022October2022November2022December2022January2023February2023 125% 100% 75% 50% 25% 0%
AVGDays OntheMarket
& Townhomes
Back to Table of Contents

Monterey County
What's in the Monterey County data?
In February, Monterey had a total of 461 singlefamily homes on the market, providing 1.7 months of inventory. In February, there were 155 new listings and a total of 98 homes sold, with a median sale price of $783k and a median overbid of 96.5%. The average days on the market decreased to 54 days.
For condos and townhomes, there were 56 units for sale providing the market with 0.8 months of inventory. In February, there were 26 new listings and a total of 23 condos sold, with a median sale price of $645k and a median overbid of 97 1% The average time on the market remained relatively stable at 50 days.

Sold Listings
54 Avg Days on Market
from Broker Metrics on March 3rd, 2023 and includes all singletownhomes in the California Area above from February 2022 may include preliminary data, and vary from the time the data deemed reliable but not guaranteed. Questions may be 415.483.9285. Palo Alto | DRE# 01511642 Copyright KW Each Office is independently owned and operated.
ory
% ist 95
mily Homes
$783K Median Sale Price
26 New Listings

23 Sold Listings
0.8 Months of Inventory
$645K Median Sale Price
97.1% Median Sale vs List
50 Avg Days on Market
& Townhomes
CONDO Condo
January2023February2023 January2023February2023 nty LISTINGS FOR SALE SOLD LISTINGS
Median SalesPrice
Single-Family Homes
The median sales price has decreased from $882k last February 2022, to $783k as of February 2023
Condos
The median sales price has decreased from $607k last February 2022, to $645k as of February 2023
Overbids
Single-Family Homes
The overbid percentage has decreased from 95 7% last February 2022, to 96 5% a year later
Condos & Townhomes
The overbid percentage has decreased from 100.3% last February 2022, to 97.1% a year later
The average days on market went up from 24 days last February 2022, to 54 days as of February 2023
Condos
The average days on market went up from 24 days in February 2022, to 50 days as of February 2023.
February2022March2022April2022May2022June2022July2022August2022September2022October2022November2022December2022January2023February2023 $1,000,000 $750,000 $500,000 $250,000 $0 February2022March2022April2022May2022June2022 July2022August2022September2022October2022November2022December2022January2023February2023 75 50 25 0 February2022March2022April2022May2022June2022 July2022August2022September2022October2022November2022December2022January2023February2023 125% 100% 75% 50% 25% 0%
& Townhomes
AVGDays OntheMarket
Townhomes
&
Single-Family Homes
Back to Table of Contents
SantaCruz County
What's in the Santa Cruz County data?
In February, Santa Cruz had 251 single-family homes for sale, providing the market with 1.8 months of inventory There were 96 new listings added, and a total of 57 homes sold. The median sale price for single-family homes in February was $1.2m, and the median overbid was 95.4%. The average time on the market was 51 days.
For condos, there were 49 units for sale, providing the market with 1 5 months of inventory. There were 24 new listings for sale, and a total of 14 condos were sold. The median sale price for condos was $838k, with a median overbid of 99.8%. The average time on the market was 43 days.

mes
57 Sold Listings
$1.2M Median Sale Price
51 Avg Days on Market
March 3rd, 2023 and includes all singleCalifornia Area above from February 2022 preliminary data, and vary from the time the data but not guaranteed. Questions may be Palo Alto | DRE# 01511642 Copyright KW Each Office is independently owned and operated.
24 New Listings

14 Sold Listings
1.5 Months of Inventory
43 Avg Days on Market
$838K Median Sale Price 99.8% Median Sale vs List
Condo &
CONDO
Townhomes
ruary2022 March2022 April2022 May2022 June2022 July2022August2022September2022October2022November2022December2022January2023February2023 ruary2022 March2022 April2022 May2022 June2022 July2022August2022September2022October2022November2022December2022January2023February2023 SantaCruzCounty FEBRUARY 2022 - FEBRUARY 2023 ngle-Family Homes ast 12 months, year-over-year. ondos & Townhomes ast 12 months, year-over-year LISTINGS FOR SALE SOLD LISTINGS
Median SalesPrice
Single-Family Homes
The median sales price has decreased from $1 3m last February 2022, to $1 2m as of February 2023
Condos & Townhomes
The median sales price has decreased from $830k last February 2022, to $838k as of February 2023
Overbids
Single-Family Homes
The overbid percentage has decreased from 104 6% last February 2022, to 95 4% a year later
Condos & Townhomes
The overbid percentage has decreased from 108% last February 2022, to 99.8% a year later
Single-Family Homes
The average days on market went up from 22 days last February 2022, to 51 days as of February 2023
Condos & Townhomes
The average days on market went up from 13 days in February 2022, to 43 days as of February 2023.
February2022March2022April2022May2022June2022July2022August2022September2022October2022November2022December2022January2023February2023 $2,000,000 $1,500,000 $1,000,000 $500,000 $0 February2022March2022April2022May2022June2022 July2022August2022September2022October2022November2022December2022January2023February2023 75 50 25 0 February2022March2022April2022May2022June2022 July2022August2022September2022October2022November2022December2022January2023February2023 125% 100% 75% 50% 25% 0%
AVGDays OntheMarket
Back to Table of Contents

East PaloAlto
What's in the East Palo Alto data?
In February, East Palo Alto had 11 single-family homes for sale, providing the market with 2.3 months of inventory, and 4 new listings were added during the month. The median sale price for single-family homes was $950k with 3 homes sold, and the average time on the market was 15 days, with a median overbid of 92.5%.
For condos, there were only 2 units for sale, providing the market with 1 month of inventory, and there were no new listings added in February. No condos were sold in either January or February. The average time on the market for condos was 22 days.

SFH Single-Family Homes
4 New Listings
3 Sold Listings
2.3 Months of Inventory
$950K Median Sale Price
92.5% Median Sale vs List
15 Avg Days on Market
This data was sourced from Broker Metrics on March 3rd, 2023 and includes all singlefamily homes, condos, and townhomes in the California Area above from February 2022 to February 2023. This may include preliminary data, and vary from the time the data was gathered. All data is deemed reliable but not guaranteed. Questions may be directed to KW Advisors. 415.483.9285. Palo Alto | DRE# 01511642 Copyright KW Advisors 2023. Each Office is independently owned and operated.
0 New Listings
0 Sold Listings
1 Months of Inventory
$0 Median Sale Price

0% Median Sale vs List
22 Avg Days on Market
CONDO Condo & Townhomes
Single-Family Homes
Last 12 months, year-over-year.
Condos & Townhomes
Last 12 months, year-over-year
February2022 March2022 April2022 May2022 June2022 July2022August2022September2022October2022November2022December2022January2023February2023 50 40 30 20 10 0 February2022 March2022 April2022 May2022 June2022 July2022August2022September2022October2022November2022December2022January2023February2023 10 75 5 25 0 EastPaloAlto FEBRUARY 2022
FEBRUARY 2023
-
LISTINGS FOR SALE SOLD LISTINGS
Median SalesPrice
Single-Family Homes
The median sales price has decreased from $1 1m last February 2022, to $950k as of February 2023
Condos & Townhomes
The median sales price has decreased from $470k last February 2022, to $0 as of February 2023
Overbid
Single-Family Homes
The overbid percentage has decreased from 104 5% last February 2022, to 92 5% a year later
Condos & Townhomes
The overbid percentage has decreased from 94% last February 2022, to 0% a year later
Single-Family Homes
The average days on market went down from 25 days last February 2022, to 15 days as of February 2023
Condos
The average days on market went down from 40 days in February 2022, to 22 days as of February 2023.
February2022March2022April2022May2022June2022July2022August2022September2022October2022November2022December2022January2023February2023 $1,500,000 $1,000,000 $500,000 $0 February2022March2022April2022May2022June2022 July2022August2022September2022October2022November2022December2022January2023February2023 100 75 50 25 0 February2022March2022April2022May2022June2022 July2022August2022September2022October2022November2022December2022January2023February2023 125% 100% 75% 50% 25% 0%
AVGDays OntheMarket
& Townhomes
Back to Table of Contents

Sunnyvale
What's in the Sunnyvale data?
In February, Sunnyvale had 74 single-family homes for sale with 42 new listings, resulting in 0.7 months of inventory. The median sale price for single-family homes was $2m, and 20 homes were sold with a median overbid of 101.4% and average time on the market of 19 days.
For condos, there were 31 units for sale with 16 new listings in February, providing the market with 0.5 months of inventory. The median sale price for condos was $1 1m, and 9 condos were sold with a median sale over ask percentage of 103.7% and average of 31 days on the market.

SFH Single-Family Homes
42 New Listings
20 Sold Listings
0.7 Months of Inventory
$2M Median Sale Price
101.4% Median Sale vs List
19 Avg Days on Market
This data was sourced from Broker Metrics on March 3rd, 2023 and includes all singlefamily homes, condos, and townhomes in the California Area above from February 2022 to February 2023. This may include preliminary data, and vary from the time the data was gathered. All data is deemed reliable but not guaranteed. Questions may be directed to KW Advisors. 415.483.9285. Palo Alto | DRE# 01511642 Copyright KW Advisors 2023. Each Office is independently owned and operated.
CONDO

Condo & Townhomes
16 New Listings
9 Sold Listings
0.5 Months of Inventory
$1.1M Median Sale Price
103.7% Median Sale vs List
31 Avg Days on Market
mber2022October2022November2022December2022January2023February2023 ember2022October2022November2022December2022January2023February2023 e LISTINGS FOR SALE SOLD LISTINGS
Median SalesPrice
The median sales price has decreased from $2 5m last February 2022, to $2m as of February 2023
Condos
The median sales price has decreased from $1 4m last February 2022, to $1 1m as of February 2023
Overbids
Single-Family Homes
The overbid percentage has decreased from 123 5% last February 2022, to 101 4% a year later
Condos & Townhomes
The overbid percentage has decreased from 113.5% last February 2022, to 103.7% a year later
Single-Family
The average days on market went up from 8 days last February 2022, to 19 days as of February 2023
Condos
The average days on market went up from 11 days in February 2022, to 31 days as of February 2023.
February2022March2022April2022May2022June2022July2022August2022September2022October2022November2022December2022January2023February2023 $3,000,000 $2,000,000 $1,000,000 $0 February2022March2022April2022May2022June2022 July2022August2022September2022October2022November2022December2022January2023February2023 40 30 20 10 0 February2022March2022April2022May2022June2022 July2022August2022September2022October2022November2022December2022January2023February2023 125% 100% 75% 50% 25% 0%
& Townhomes
Single-Family Homes
AVGDays OntheMarket
& Townhomes
Homes
Back to Table of Contents

SantaClara City
What's in the Santa Clara City data?
In February, Santa Clara had total number of 53 single-family homes for sale, providing only 1 month of inventory There were 30 new listings and 15 homes sold, with the median sale price at $1.6m and the median overbid at 104%. There was an average of 14 days on the market.
For condos there were 37 units for sale, providing only 0.8 months of inventory. There were 18 new listings and 12 condo units sold, with the median sale price at $963k and the median overbid at 102%. The average days on the market also decreased to 17.

SFH Single-Family Homes
30 New Listings
15 Sold Listings
1 Months of Inventory
$1.6M Median Sale Price
104.4% Median Sale vs List
14 Avg Days on Market
The data, sourced from InfoSparks, on March 3rd, 2023 includes all single-family homes, condos, and townhomes in the California Area above from February 2022 to February 2023. This may include preliminary data, and vary from the time the data was gathered. All data is deemed reliable but not guaranteed. Questions may be directed to KW Advisors. 415.483.9285. Palo Alto | DRE# 01511642 Copyright KW Advisors 2023. Each Office is independently owned and operated.
18 New Listings
Townhomes
12 Sold Listings
0.8 Months of Inventory
$963K Median Sale Price

102.1% Median Sale vs List
17 Avg Days on Market
CONDO Condo &
rch2022 April2022 May2022 June2022 July2022August2022September2022October2022November2022December2022January2023February2023 arch2022 April2022 May2022 June2022 July2022August2022September2022October2022November2022December2022January2023February2023 antaClaraCity FEBRUARY 2022 - FEBRUARY 2023 -Family Homes 2 months, year-over-year. s & Townhomes 2 months, year-over-year LISTINGS FOR SALE SOLD LISTINGS
Median SalesPrice
Single-Family Homes
The median sales price has decreased from $1 9m last February 2022, to $1 6m as of February 2023
Condos & Townhomes
The median sales price has increased from $940k last February 2022, to $963k as of February 2023
Overbids
Single-Family Homes
The overbid percentage has decreased from 122 6% last February 2022, to 104 4% a year later
Condos & Townhomes
The overbid percentage has decreased from 109.8% last February 2022, to 102.1% a year later
Single-Family Homes
The average days on market went up from 9 days last February 2022, to 14 days as of February 2023
Condos & Townhomes
The average days on market went up from 10 days in February 2022, to 17 days as of February 2023.
February2022March2022April2022May2022June2022July2022August2022September2022October2022November2022December2022January2023February2023 $2,000,000 $1,500,000 $1,000,000 $500,000 $0 February2022March2022April2022May2022June2022 July2022August2022September2022October2022November2022December2022January2023February2023 60 40 20 0 February2022March2022April2022May2022June2022 July2022August2022September2022October2022November2022December2022January2023February2023 125% 100% 75% 50% 25% 0%
AVGDays OntheMarket
Back to Table of Contents

Saratoga
What's in the Saratoga data?
In February, Saratoga had 44 single-family homes for sale, providing the market with 1.7 months of inventory. There were 21 new listings, and a total of 5 homes sold, with a median sale price of $3.7m. The median overbid was 97.3%, and the average time on the market was 42 days.
In terms of condos, there are currently 4 units for sale, with no months of inventory. In February, there were no new listings for sale, and a total of 2 condos sold, with a median sale price of $928k.

SFH Single-Family Homes
21 New Listings
5 Sold Listings
1.7 Months of Inventory
$3.7M Median Sale Price
97.3% Median Sale vs List
42 Avg Days on Market
This data was sourced from Broker Metrics on March 3rd, 2023 and includes all singlefamily homes, condos, and townhomes in the California Area above from February 2022 to February 2023. This may include preliminary data, and vary from the time the data was gathered. All data is deemed reliable but not guaranteed. Questions may be directed to KW Advisors. 415.483.9285. Palo Alto | DRE# 01511642 Copyright KW Advisors 2023. Each Office is independently owned and operated.
0 New Listings

2 Sold Listings
0 Months of Inventory
$928K Median Sale Price
89.4% Median Sale vs List
0 Avg Days on Market
CONDO Condo & Townhomes
Single-Family Homes
Last 12 months, year-over-year.
Condos & Townhomes
Last 12 months, year-over-year
February2022 March2022 April2022 May2022 June2022 July2022August2022September2022October2022November2022December2022January2023February2023 100 75 50 25 0 February2022 March2022 April2022 May2022 June2022 July2022August2022September2022October2022November2022December2022January2023February2023 15 10 5 0 Saratoga FEBRUARY 2022 - FEBRUARY 2023
LISTINGS FOR SALE SOLD LISTINGS
Median SalesPrice
Single-Family Homes
The median sales price has decreased from $3 9m last February 2022, to $3 7m as of February 2023
Condos & Townhomes
The median sales price has decreased from $990k last February 2022, to $928k as of February 2023
Overbids
Single-Family Homes
The overbid percentage has decreased from 122 6% last February 2022, to 104 4% a year later
Condos & Townhomes
The overbid percentage has decreased from 111.9% last February 2022, to 89.4% a year later
AVGDays OntheMarket
Single-Family Homes
The average days on market went up from 14 days last February 2022, to 42 days as of February 2023
Condos & Townhomes
The average days on market went down from 8 days in February 2022, to 0 days as of February 2023.
February2022March2022April2022May2022June2022July2022August2022September2022October2022November2022December2022January2023February2023 $5,000,000 $4,000,000 $3,000,000 $2,000,000 $1,000,000 $0 February2022March2022April2022May2022June2022 July2022August2022September2022October2022November2022December2022January2023February2023 125 100 75 50 25 0 February2022March2022April2022May2022June2022 July2022August2022September2022October2022November2022December2022January2023February2023 125% 100% 75% 50% 25% 0%
Back to Table of Contents


505 Hamilton Ave Suite #100, Palo Alto, CA 94301 PaloAlto :