MARKET REPORT


May 2023 Copyright by KW Advisors 2023


Atherton
Jump to Atherton Report
Belmont
Jump to Belmont Report
Burlingame
Jump to Burlingame Report
Foster City
Jump to Foster City Report
Hillsborough
Jump to Hillsborough Report
Menlo Park
Jump to Menlo Park Report

Palo Alto
Jump to Palo Alto Report
Portola Valley
Jump to Portola Valley Report
Redwood City
Jump to Redwood City Report
San Carlos
Jump to San Carlos County
Santa Clara County
Jump to Santa Clara County Report
Jump to Woodside Report
Woodside
A local Bay Area Pioneer- Sarah is the 5th Generation in San Mateo County She began her career over 30 years ago as the owner and operator of her own real estate company Then went onto opening two Century 21 franchises, followed by opening a RE/MAX franchise.

She earned the prestigious “Centurion” and “Platinum” top producer awards. Both of these awards acknowledge Sarah’s accomplishments that lead her to ranking in the top 1% of Sales Professionals Nationwide
In addition to her vast real estate experience, and successfully closing over 575 sales in her career she also has background and experience in interior design, construction and remodeling. Sarah has built 2 custom luxury homes, as well as...
Sarah advised us on what truly needed to be done to get the most 'bang' for our dollar. She sold our house in 13 days, with 4 bids all over asking price. It closed in 21 days and we were super happy with her skills to accomplish this in such a short period of time Our house sold for $116,000 Over the last sale in our neighborhood, on the market for only 14 days, Closed escrow in 21 days!
- Jim & Margaret MThank you so much for making a 20 year dream of mine come true! When I tell people that we found our home, put in a bid and the bid was accepted (in one day)
UNDER ASKING PRICE all they could say was ”WOW, in this market, I can’t believe it. Truly I don’t think I could have done this without your support, you had some amazing tricks up your sleeve! Glad you were referred to us!”
What a pleasure it has been working with you in the sale of our home. We had been listed with another brokerage with no results but were pleasantly surprised at how efficient your system was You made the entire process seem so easy compared to what we previously experienced! We thank you and your team! Please stay in touch with us.
- Stan and EveFor more testimonials, click here
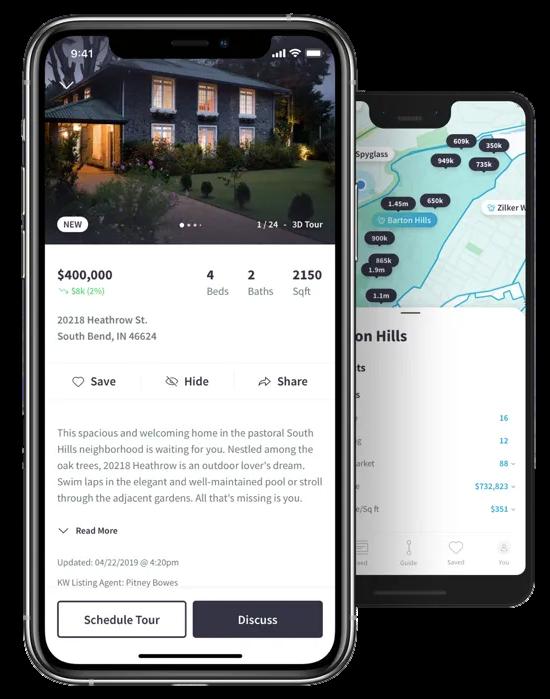
Curious about what’s trending in your neighborhood? Ready to make a move? Download our app for real estate insights, on demand.
Work with an Agent Custom Searches
Dynamic Map Get Local
Anytime Access
Share Information
Download the Keller Williams Real Estate Mobile App for iPhone, iPad, and Android via the links below:
For more information, click here


Downsizing has long been a popular option when homeowners reach retirement age But there are plenty of other life changes that could make downsizing worthwhile Homeowners who have experienced a change in their lives or no longer feel like their house fits their needs may benefit from downsizing too. U.S. News explains:
“Downsizing is somewhat common among older people and retirees who no longer have children living at home. But these days, younger people are also looking to downsize to save money on housing ”

And when inflation has made most things significantly more expensive, saving money where you can has a lot of appeal. So, if you’re thinking about ways to budget differently, it could be worthwhile to take your home into consideration.
When you think about cutting down on your spending, odds are you think of frequent purchases, like groceries and other goods But when you downsize your house, you often end up downsizing the bills that come with it, like your mortgage payment, energy costs, and maintenance requirements. Realtor.com shares:
“A smaller home typically means lower bills and less upkeep. Then there’s the potential windfall that comes from selling your larger home and buying something smaller”
That windfall is thanks to your home equity. If you’ve been in your house for a while, odds are you’ve developed a considerable amount of equity. Your home equity is an asset you can use to help you buy a home that better suits your needs today.
And when you’re ready to make a move, your team of real estate experts will be your guides through every step of the process That includes setting the right price for your house when you sell, finding the best location and size for your next home, and understanding what you can afford at today’s mortgage rate.
If you’re thinking about downsizing, ask yourself these questions:
Do the original reasons I bought my current house still stand, or have my needs changed since then? Do I really need and want the space I have right now, or could somewhere smaller be a better fit?
What are my housing expenses right now, and how much do I want to try to save by downsizing?
Once you know the answers to these questions, meet with a real estate advisor to get an answer to this one: What are my options in the market right now? A local housing market professional can walk you through how much equity you have in your house and how it positions you to win when you downsize
If you’re looking to save money, downsizing your home could be a great help toward your goal. Talk with a real estate agent about your goals in the housing market this year.
Source: Keeping Current Matters
In April, Los Altos had 39 single-family homes for sale, providing the market with only 5.3 months of inventory. There are 16 new listings added, and 4 homes sold for a median sale price of $12.5m. The median overbid was 89.8%, with an average of 38 days on the market.
The condo and townhouse market had 0 units for sale, providing the market with only 5.3 months of inventory. There was a total of 4 new listings, but 0 units were sold. The median sale price was not available as There are no sales. The median overbid was 0%.

16 New Listings
4 Sold Listings
5.3 Months of Inventory
$12.5M Median Sale Price
89.8% Median Sale vs List
38 Avg Days on Market
This data was sourced from Broker Metrics on May 5th, 2023 and includes all single-family homes, condos, and townhomes in the California Area above from April 2022 to April 2023 This may include preliminary data, and vary from the time the data was gathered All data is deemed reliable but not guaranteed Questions may be directed to KW Advisors 4154839285 Palo Alto | DRE# 01511642 Copyright KW Advisors 2023 Each Office is independently owned and operated
4

Single-Family Homes
Last 12 months, year-over-year.
Condos & Townhomes
Last 12 months, year-over-year
Single-Family Homes
The median sale price has increased from $96m in April 2022, to $125m as of April 2023
Condos & Townhomes
The median sale price has remained at $0 since April 2022
Single-Family Homes
The average time spent on the market decreased from 39 days in April 2022, to 38 days as of April 2023
Condos & Townhomes
The average time spent on the market has remained at 0 days since April 2022
Single-Family Homes
The overbid percentage has decreased from 989% in April 2022, to 898% a year later
Condos & Townhomes
The overbid percentage has remained at 0 since April 2022.


In April, Belmont Ci homes sold, with a $2.4m. The median and the average tim 23 days. In terms of currently 33 homes market with 0.9 mo
For condos, there w median sale price o overbid was at 104. time on the market were 2 condos for s market with 0 mon
mes
2 Listings
2.4M ian Sale Price
3 Days on Market
May 11th, 2023 and includes all in the California Area above eliminary data, and vary from s deemed reliable but not
Advisors 4154839285 Palo sors 2023 Each Office is

Single-Family Homes
The median sale price has decreased from $26m last April 2022, to $24m as of April 2023
Condos
The median sale price has increased from $1m last April 2022, to $13 as of April 2023
Single-Family Homes
The overbid percentage has decreased from 122.1% last April 2022, to 98.5% a year later.
Condos
The overbid percentage has decreased from 113.9% last April 2022, to 104.3% a year later.
The average days on market went up from 9 days last April 2022, to 23 days as of April 2023.
Condos
The average days on market went down from 7 days in April 2022, to 0 days as of April 2023.

In April, Burlingame had 9 single-family homes sold, a median sale price of $2.9m. The median overbid was at 96.8% and the average time on the market was 16 days. In terms of inventory, there were 44 homes for sale providing the market with 1.4 months of inventory.
For condos, there were 2 units sold, with a median sale price of $1.4m. The median overbid was at 100% and the average time on the market was 0 days. There were 3 condos for sale providing the market with 0 months of inventory.

19 New Listings
9 Sold Listings
1.4 Months of Inventory
$2.9M Median Sale Price
96.8% Median Sale vs List
16 Avg Days on Market
This data was sourced from Broker Metrics on May 11th, 2023 and includes all single-family homes, condos, and townhomes in the California Area above from April 2022 to April 2023 This may include preliminary data, and vary from the time the data was gathered All data is deemed reliable but not guaranteed Questions may be directed to KW Advisors 4154839285 Palo Alto | DRE# 01511642 Copyright KW Advisors 2023 Each Office is independently owned and operated
2 New Listings

2 Sold Listings
0 Months of Inventory
$1.4M Median Sale Price
100% Median Sale vs List
0 Avg Days on Market
Single-Family Homes
Last 12 months, year-over-year.
Last 12 months, year-over-year
The median sale price has decreased from $31m last April 2022, to $29m as of April 2023
Condos
The median sale price has increased from $1.1 last April 2022, to $14m as of
Single-Family
The average days on market went up from 10 days last April 2022, to 16 days as of April 2023.
Single-Family Homes
The overbid percentage has decreased from 114.2% last April 2022, to 96.8% a year later.
Condos
The overbid percentage has decreased from 105.2% last April 2022, to 100% a year later.
The average days on market went down from 127 days in April 2022, to 0 days as of April 2023.

In April, Foster City had 3 single-family homes sold, with a median sale price of $2.3m. The median overbid was at 106.9% and the average time on the market was 7 days. In terms of inventory, there were 16 homes for sale providing the market with 2.5 months of inventory.
For condos, there were 9 units sold, with a median sale price of $930K. The median overbid was at 103.3% and the average time on the market was 37 days. There were 24 condos for sale providing the market with 0.6 months of inventory.

12 New Listings
3 Sold Listings
2.5 Months of Inventory
$2.3M Median Sale Price
106.9% Median Sale vs List
7 Avg Days on Market
This data was sourced from Broker Metrics on May 11th, 2023 and includes all single-family homes, condos, and townhomes in the California Area above from April 2022 to April 2023 This may include preliminary data, and vary from the time the data was gathered All data is deemed reliable but not guaranteed Questions may be directed to KW Advisors 4154839285 Palo Alto | DRE# 01511642 Copyright KW Advisors 2023 Each Office is independently owned and operated

Last 12 months, year-over-year.
Condos
Last 12 months, year-over-year
Single-Family
The median sale price has decreased from $26m last April 2022, to $23m as of April 2023
Condos
The median sale price has decreased from $1.3m last April 2022, to $930k as of April 2023
Single-Family Homes
The overbid percentage has decreased from 115.3% last April 2022, to 106.9% a year later.
Condos
The overbid percentage has decreased from 111.8% last April 2022, to 103.3% a year later.
Single-Family
The average days on market went down from 12 days last April 2022, to 7 days as of April 2023.
Condos
The average days on market went up from 12 days in April 2022, to 37 days as of April 2023.

In April, Hillsborough had 8 single-family homes sold, a median sale price of $5.2m. The median overbid was at 99% and the average time on the market was 57 days. In terms of inventory, there were 41 homes for sale providing the market with 0.8 months of inventory.
There were no condos for sale, inventory, new listings, or condo sales reported in April and January.

14 New Listings
8 Sold Listings
0.8 Months of Inventory
$5.2M Median Sale Price
99% Median Sale vs List
57 Avg Days on Market
This data was sourced from Broker Metrics on May 11th, 2023 and includes all single-family homes, condos, and townhomes in the California Area above from April 2022 to April 2023 This may include preliminary data, and vary from the time the data was gathered All data is deemed reliable but not guaranteed Questions may be directed to KW Advisors 4154839285 Palo Alto | DRE# 01511642 Copyright KW Advisors 2023 Each Office is independently owned and operated

Single-Family Homes
Last 12 months,
Condos & Townhomes
Last 12 months, year-over-year
Single-Family Homes
The median sale price has decreased from $64m last April 2022, to $52m as of April 2023
Condos & Townhomes
No data for this month.
The average days on market went up from 13 days last April 2022, to 57 days as of April 2023.
Single-Family Homes
The overbid percentage has increased from 94.9% last April 2022, to 99% a year later.
Condos & Townhomes
No data for this month.
No data for this month.

In April, Menlo Park had 51 homes for sale; providing the market with 1.5 months of inve
There are 30 new listings and a total of 16 ho sold. The median sale price was $3.5m, and median overbid was 96.8%. The average tim the market was 19 days.
There are 18 condo and townhome units for providing the market with 4 months of inven
There are 9 new listings for sale, and 1 cond with a median sale price of $1.7m. The medi overbid was 93.2%, with an average of 15 da the market.

ngs
16 Sold Listings
f Inventory
$3.5M Median Sale Price
.8% ale vs List
19 Avg Days on Market
sourced from Broker Metrics on May 5th, 2023 and includes all singlecondos, and townhomes in the California Area above from April 2022 to This may include preliminary data, and vary from the time the data was data is deemed reliable but not guaranteed. Questions may be directed to 415.483.9285. Palo Alto | DRE# 01511642 Copyright KW Advisors 2023. Each Office is independently owned and operated.
9 New Listings

1 Sold Listings
4 Months of Inventory
$1.7M Median Sale Price
93.2% Median Sale vs List
9 Avg Days on Market
Single-Family
Last 12 months, year-over-year.
Condos
Last 12 months, year-over-year
The median sale price has increased from $3m in April 2022, to $35m as of April 2023
The median sale price has increased from $1.3m in April 2022, to $17m as of April 2023
Single-Family Homes
The overbid percentage has decreased from 1087% in April 2022, to 968% a year later
Condos
The overbid percentage has decreased from 106% in April 2022, to 93.2% a year later.
Single-Family
The average days on market went up from 15 days in April 2022, to 19 days as of April 2023
The average days on market went down from 19 days in April 2022, to 15 days as of April 2023

In April, Palo Alto had 101 homes for sale; providing the market with 16 months of inventory. There are 50 new listings and a total of 27 homes sold. The median sale price was $3.1m, and the median overbid was 100.5%. The average time on the market was 21 days.
There are 27 condo and townhome units for sale, providing the market with 2 months of inventory. There are 11 new listings for sale, and 7 condo sold with a median sale price of $1.7m. The median overbid was 96.3%, with an average of 31 days on the market.

50 New Listings
27 Sold Listings
1.6 Months of Inventory
$3.1M Median Sale Price
100.1% Median Sale vs List
21 Avg Days on Market
This data was sourced from Broker Metrics on May 5th, 2023 and includes all single-family homes, condos, and townhomes in the California Area above from April 2022 to April 2023 This may include preliminary data, and vary from the time the data was gathered All data is deemed reliable but not guaranteed Questions may be directed to KW Advisors 4154839285 Palo Alto | DRE# 01511642 Copyright KW Advisors 2023 Each Office is independently owned and operated
Condo & Townhomes
11 New Listings

7 Sold Listings
2 Months of Inventory
$1.7M Median Sale Price
96.3% Median Sale vs List
31 Avg Days on Market
The median sale price has decreased from $4m in April 2022, to $31m as of April 2023
The median sale price has increased from $1.6m in April 2022, to $17m as of
Single-Family
The average time spent on the market increased from 15 days in April 2022, to 21 days as of April 2023
The average time spent on the market increased from 18 days in April 2022, to 31 days as of April 2023
Single-Family Homes
The overbid percentage has decreased from 1081% in April 2022, to 1001% a year later
Condos
The overbid percentage has decreased from 105.1% in April 2022, to 96.3% a year later.

In April, Portola Valley had 24 sale; providing the market wit of inventory. There are 17 new total of 2 homes sold. The med was $2.9m, and the median ov 92.2%. The average time on th 21 days.
There are currently no condos townhouse units for sale, inve listings, or condo sales reporte

2 Sold Listings
$2.9M Median Sale Price
21 Avg Days on Market

Single-Family
The median sale price has decreased from $4m in April 2022, to $29m as of April 2023
No data for this month.
The average time spent on the market increased from 12 days in April 2022, to 21 days as of April 2023
No data for this month
Single-Family Homes
The overbid percentage has decreased from 1011% in April 2022, to 922% a year later
Condos
No data for this month.

In April, Redwood had 68 homes for sale; providing the market with 09 months of inventory. There are 36 new listings and a total of 33 homes sold. The median sale price was $1.9m, and the median overbid was 98.8%. The average time on the market was 18 days.
There are 18 condo and townhome units for sale, providing the market with 0.9 months of inventory. There are 11 new listings for sale, and 2 condo sold with a median sale price of $1.2m. The median overbid was 102%, with an average of 26 days on the market.

CO Condo & To
11 New Listings

0.9 Months of Inventory $
102% Median Sale vs List Av
The median sale price has decreased from $23m in April 2022, to $19m as of April 2023
The
Single-Family
The average time spent on the market increased from 16 days in April 2022, to 18 days as of April 2023
Condos
The average time spent on the market increased from 8 days in April 2022, to 26 days as of April 2023
Single-Family Homes
The overbid percentage has decreased from 1127% in April 2022, to 989% a year later
Condos
The overbid percentage has decreased from 105.1% in April 2022, to 102% a year later.

In April, San Carlos had 19 single-family homes sold, a median sale price of $2.2m. The median overbid was at 103.2% and the average time on the market was 12 days. In terms of inventory, there were 47 homes for sale providing the market with 1.1 months of inventory.
For condos, there were 5 units sold, with a median sale price of $1.4m. The median overbid was at 103.8% and the average time on the market was 26 days. There were 29 condos for sale providing the market with 0.9 months of inventory.

21 New Listings
19 Sold Listings
1.1 Months of Inventory
$2.2M Median Sale Price
103.2% Median Sale vs List
12 Avg Days on Market
This data was sourced from Broker Metrics on May 11th, 2023 and includes all single-family homes, condos, and townhomes in the California Area above from April 2022 to April 2023 This may include preliminary data, and vary from the time the data was gathered All data is deemed reliable but not guaranteed Questions may be directed to KW Advisors 4154839285 Palo Alto | DRE# 01511642 Copyright KW Advisors 2023 Each Office is independently owned and operated
Condo & Townhomes
12 New Listings
5 Sold Listings
0.9 Months of Inventory
$1.4M Median Sale Price
103.8% Median Sale vs List
26 Avg Days on Market

Single-Family Homes
Last 12 months, year-over-year.
Condos
Last 12 months, year-over-year
Single-Family
The median sale price has decreased from $33m last April 2022, to $22m as of April 2023
Condos
The median sale price has decreased from $1.5 last April 2022, to $14m as of April 2023
Single-Family Homes
The overbid percentage has decreased from 110.6% last April 2022, to 103.2% a year later.
Condos & Townhomes
The overbid percentage has decreased from 106.8% last April 2022, to 103.8% a year later.
Single-Family
The average days on market went up from 7 days last April 2022, to 12 days as of April 2023.
Condos
The average days on market went up from 11 days in April 2022, to 26 days as of April 2023.

In April, San Mateo City had 26 singlefamily homes sold, a median sale price of $19m The median overbid was at 977% and the average time on the market was 12 days. In terms of inventory, there were 78 homes for sale providing the market with 1.2 months of inventory.
For condos, there were 18 units sold, with a median sale price of $746k. The median overbid was at 96.5% and the average time on the market was 30 days. There were 90 condos for sale providing the market with 3.2 months of inventory.

43 New Listings
26 Sold Listings
1.2 Months of Inventory
$1.9M Median Sale Price
97.7% Median Sale vs List
12 Avg Days on Market
This data was sourced from Broker Metrics on May 11th, 2023 and includes all single-family homes, condos, and townhomes in the California Area above from April 2022 to April 2023 This may include preliminary data, and vary from the time the data was gathered All data is deemed reliable but not guaranteed Questions may be directed to KW Advisors 4154839285 Palo Alto | DRE# 01511642 Copyright KW Advisors 2023 Each Office is independently owned and operated
Condo & Townhomes

33 New Listings
18 Sold Listings
3.2 Months of Inventory
$746K Median Sale Price
96.5% Median Sale vs List
30 Avg Days on Market
Last
Last 12 months,
The median sale price has decreased from $24m last April 2022, to $19m as of April 2023
Condos
The median sale price has decreased from $1.1m last April 2022, to $746k as of April 2023
The overbid percentage has decreased from 114% last April 2022, to 97.7% a year later.
Condos
The overbid percentage has decreased from 106.9% last April 2022, to 96.5% a year later.
The average days on market went up from 11 days last April 2022, to 12 days as of April 2023.
The average days on market went up from 15 days in April 2022, to 30 days as of April 2023.

There are 380 singl providing 1.4 month 388 new listings, an median sale price o overbid percentage average of 25 days
There are 139 condo sale, providing 1.5 m There are 133 new li at a median sale pr overbid percentage average of 36 days

388 New Listings
227 Sold Listings
1.4 Months of Inventory
$1.8M Median Sale Price
100.3% Median Sale vs List
25 Avg Days on Market
The data, sourced from InfoSparks, includes all single-family homes, condos and townhomes in the California Area from April 2022 to April 2023 This may include preliminary data, and may vary from the time the data was gathered All data is deemed reliable but not guaranteed Questions may be directed to KW Advisors 4154839285 DRE# 01995149 | DRE# 01906450 Copyright KW Advisors 2023 Each Office is independently owned and operated
133 New Listings

70 Sold Listings
1.5 Months of Inventory
$857K Median Sale Price
100% Median Sale vs List
36 Avg Days on Market
Single-Family
Last 12 months, year-over-year.
Condos
Last 12 months, year-over-year
Single
The median sale price has decreased from $22m in April 2022, to $18m as of April 2023
The median sale price has decreased from $1m in April 2022, to $857k as of
The average time spent on the market increased from 13 days in April 2022, to 25 days as of April 2023
The average time spent on the market increased from 18 days in April 2022, to 36 days as of April 2023
Single
The overbid percentage has decreased from 1125% in April 2022, to 1003% a year later
The overbid percentage has decreased from 105.3% in April 2022, to 100% a year later.

There are 651 single-family homes for sale, providing 1 month of inventory. There are 834 new listings, and 584 homes sold at a median sale price of $1.7m. The median overbid percentage was 1027%, with an average of 19 days on the market.
There are 254 condo and townhome units for sale, providing 0.9 months of inventory. There are 324 new listings, and 239 units sold at a median sale price of $928k. The median overbid percentage was 101.6%, with an average of 20 days on the market.

834 New Listings
584 Sold Listings
1 Months of Inventory
$1.7M Median Sale Price
102.7% Median Sale vs List
19 Avg Days on Market
The data, sourced from InfoSparks, includes all single-family homes, condos and townhomes in the California Area from April 2022 to April 2023 This may include preliminary data, and may vary from the time the data was gathered All data is deemed reliable but not guaranteed Questions may be directed to KW Advisors 4154839285 DRE# 01995149 | DRE# 01906450 Copyright KW Advisors 2023 Each Office is independently owned and operated
324 New Listings
239 Sold Listings
0.9 Months of Inventory
$928K Median Sale Price

101.6% Median Sale vs List
20 Avg Days on Market
Single-Family Homes
The median sale price has decreased from $19m last April 2022, to $17m as of April 2023
Condos
The median sale price has decreased from $1m last April 2022, to $928k as of April 2023
Single-Family Homes
The overbid percentage has decreased from 1144% last April 2022, to 1027% a year later
Condos & Townhomes
The overbid percentage has decreased from 110% last April 2022, to 101.6% a year later.
Single-Family Homes
The average days on market went up from 10 days last April 2022, to 19 days as of April 2023
Condos & Townhomes
The average days on market went up from 11 days in April 2022, to 20 days as of April 2023


In April, Woodside had 4 single-family homes sold, a median sale price of $0. The median overbid was at 83.1% and the average time on the market was 43 days. In terms of inventory, there were 42 homes for sale, providing the market with 4.9 months of inventory.
There are currently no condos for sale, inventory, new listings, or condo sales reported in April and January.
22 New Listings
4 Sold Listings
4.9 Months of Inventory
$0 Median Sale Price
83.1% Median Sale vs List
43 Avg Days on Market
This data was sourced from Broker Metrics on May 11th, 2023 and includes all single-family homes, condos, and townhomes in the California Area above from April 2022 to April 2023 This may include preliminary data, and vary from the time the data was gathered All data is deemed reliable but not guaranteed Questions may be directed to KW Advisors 4154839285 Palo Alto | DRE# 01511642 Copyright KW Advisors 2023 Each Office is independently owned and operated

Single-Family Homes
Last 12 months, year-over-year.
Condos & Townhomes
Last 12 months, year-over-year
Single-Family Homes
The median sale price has increased from $55m last April 2022, to $7m as of April 2023
Condos & Townhomes
No data for this month.
Single-Family Homes
The average days on market went up from 18 days last April 2022, to 43 days as of April 2023.
Condos & Townhomes
No data for this month.
Single-Family Homes
The overbid percentage has decreased from 98.6% last April 2022, to 83.1% a year later.
Condos & Townhomes
No data for this month.