


Santa Clara County
Jump to Santa Clara County Report

That's the question you should be asking yourself.
Our market is incredibly diverse and rapidly changing. Values vary not just by neighborhood but by street. Your home isn't necessarily worth what your neighbors' home is. It's the current market that sets the value of your home.
So, do you know what your home is worth in today's market?
Icanhelp...
Contact me for a confidential, no obligation assessment of your home's value.


Are you on the fence about whether to sell your house now or hold off? It’s a common dilemma, but here’s a key point to consider: your lifestyle might be the biggest factor in your decision. While financial aspects are important, sometimes the personal motivations for moving are reason enough to make the leap sooner rather than later.
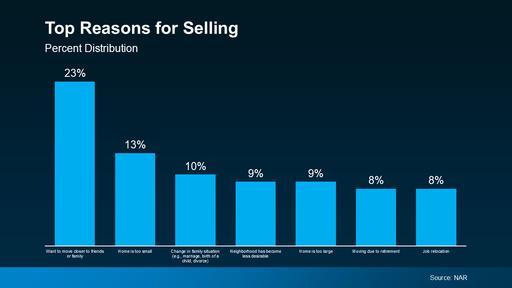
An annual report from the National Association of Realtors (NAR) offers insight into why homeowners like you chose to sell. All of the top reasons are related to life changes. As the graph below highlights:
There were 791 single-family homes for sale, providing 1.2 months of inventory. There were 846 new listings, and 749 homes sold at a median price of $1.8m. The median overbid percentage was at 103%, with an average of 19 days on the market.
There were 516 condo and townhome units for sale, providing 1.8 months of inventory. There were 430 new listings and 295 units sold at a median sale price of $1m. The median overbid percentage was at 100.1%, with an average of 24 days on the market

846 New Listings
749 Sold Listings
1.2 Months of Inventory
$1.8M Median Sale Price
103% Median Sale vs List
19 Avg Days on Market
The data, sourced from InfoSparks and Trend Graphix, includes all single-family homes, condos and townhomes in the California Area above from August 2023 to August 2024. This may include preliminary data, and may vary from the time the data was gathered. All data is deemed reliable but not guaranteed. DRE# 01511642. Copyright KW Advisors Palo Alto 2024. Each office is independently owned and operated.
430
New Listings
295 Sold Listings
1.8
Months of Inventory
$1M
Median Sale Price 100.1%
Median Sale vs List 24 Avg Days on Market

AUGUST 2023 - AUGUST 2024
Single-Family Homes
Last 12 months, year-over-year.
Last 12 months, year-over-year
The median sale price has increased from $1 82m last August 2023, to $1 83m as of August 2024
Condos & Townhomes
The median sale price has increased from $950k last August 2023, to $1m as of August 2024
The average time spent on the market went up from 18 days last August 2023, to 19 days as of August 2024
Condos & Townhomes
The average time spent on the market went up from 19 days in August 2023, to 24 days as of August 2024.
Single-Family Homes
The overbid percentage has decreased from 104% last August 2023, to 103% a year later
Condos & Townhomes
The overbid percentage has decreased from 102% last August 2023, to 100.1% a year later.