That's the question you should be asking yourself.
Our market is incredibly diverse and rapidly changing. Values vary not just by neighborhood but by street. Your home isn't necessarily worth what your neighbors' home is. It's the current market that sets the value of your home.
So, do you know what your home is worth in today's market?
Icanhelp...
Contact me for a confidential, no obligation assessment of your home's value.
ThisIstheSweetSpotHomebuyers HaveBeenWaitingFor
After months of sitting on the sidelines, many homebuyers who were priced out by high mortgage rates and affordability challenges finally have an opportunity to make their move. With rates trending down, today’s market is a sweet spot for buyers— and it’s one that may not last long.
So, if you’ve put your own move on the back burner, here’s why maybe you shouldn’t delay your plans any longer.
As you weigh your options and decide if you should buy now or wait, ask yourself this: What do you think everyone else is going to do?
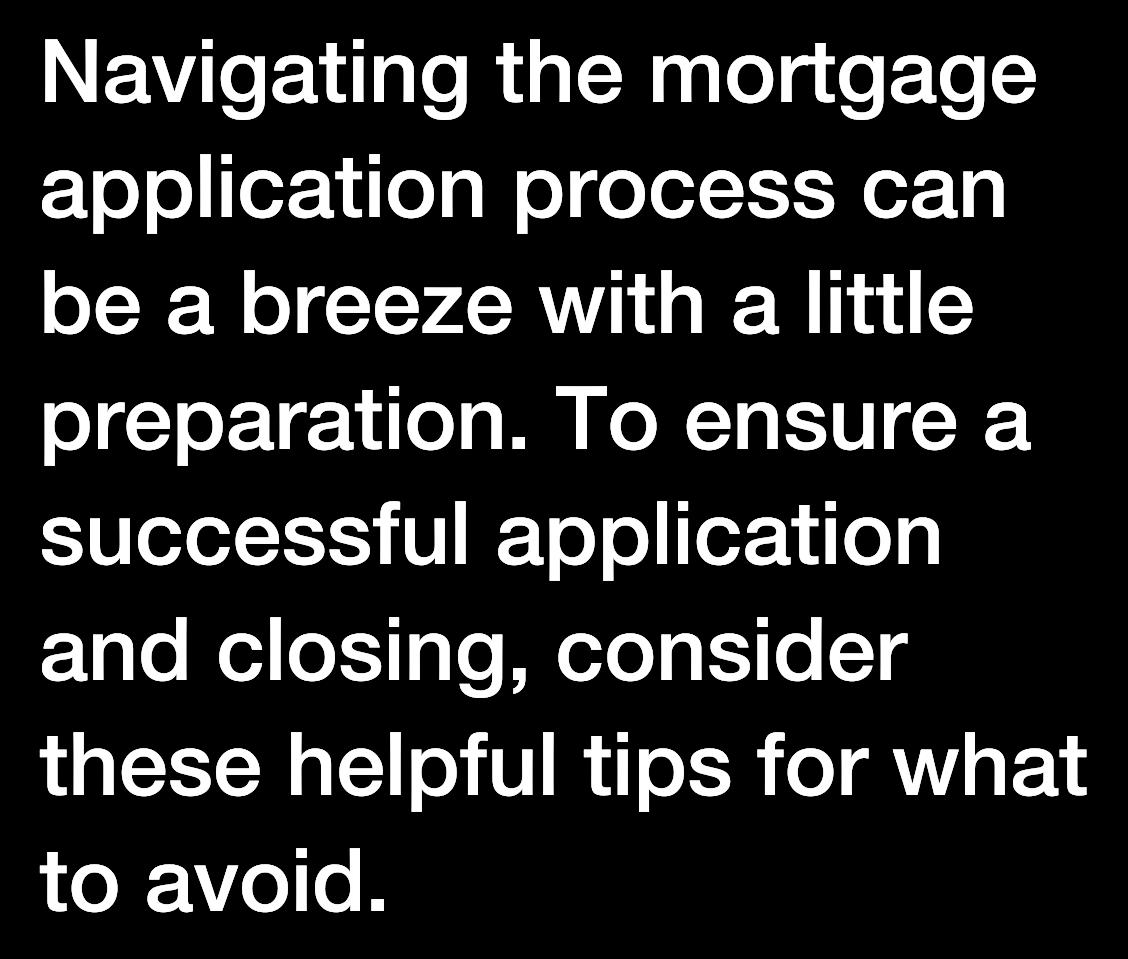
Smart Strategies for a Mortgage Application
Avoid paying off debts or collections without professional advice.
Don't have your credit report pulled too many times - this can hurt your credit score. 3 4 5 6 1 2
Always consult your mortgage professional before making large financial moves. Use verified funds for deposits to prevent closing delays.
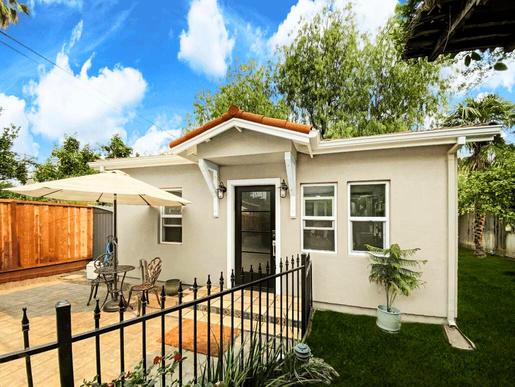
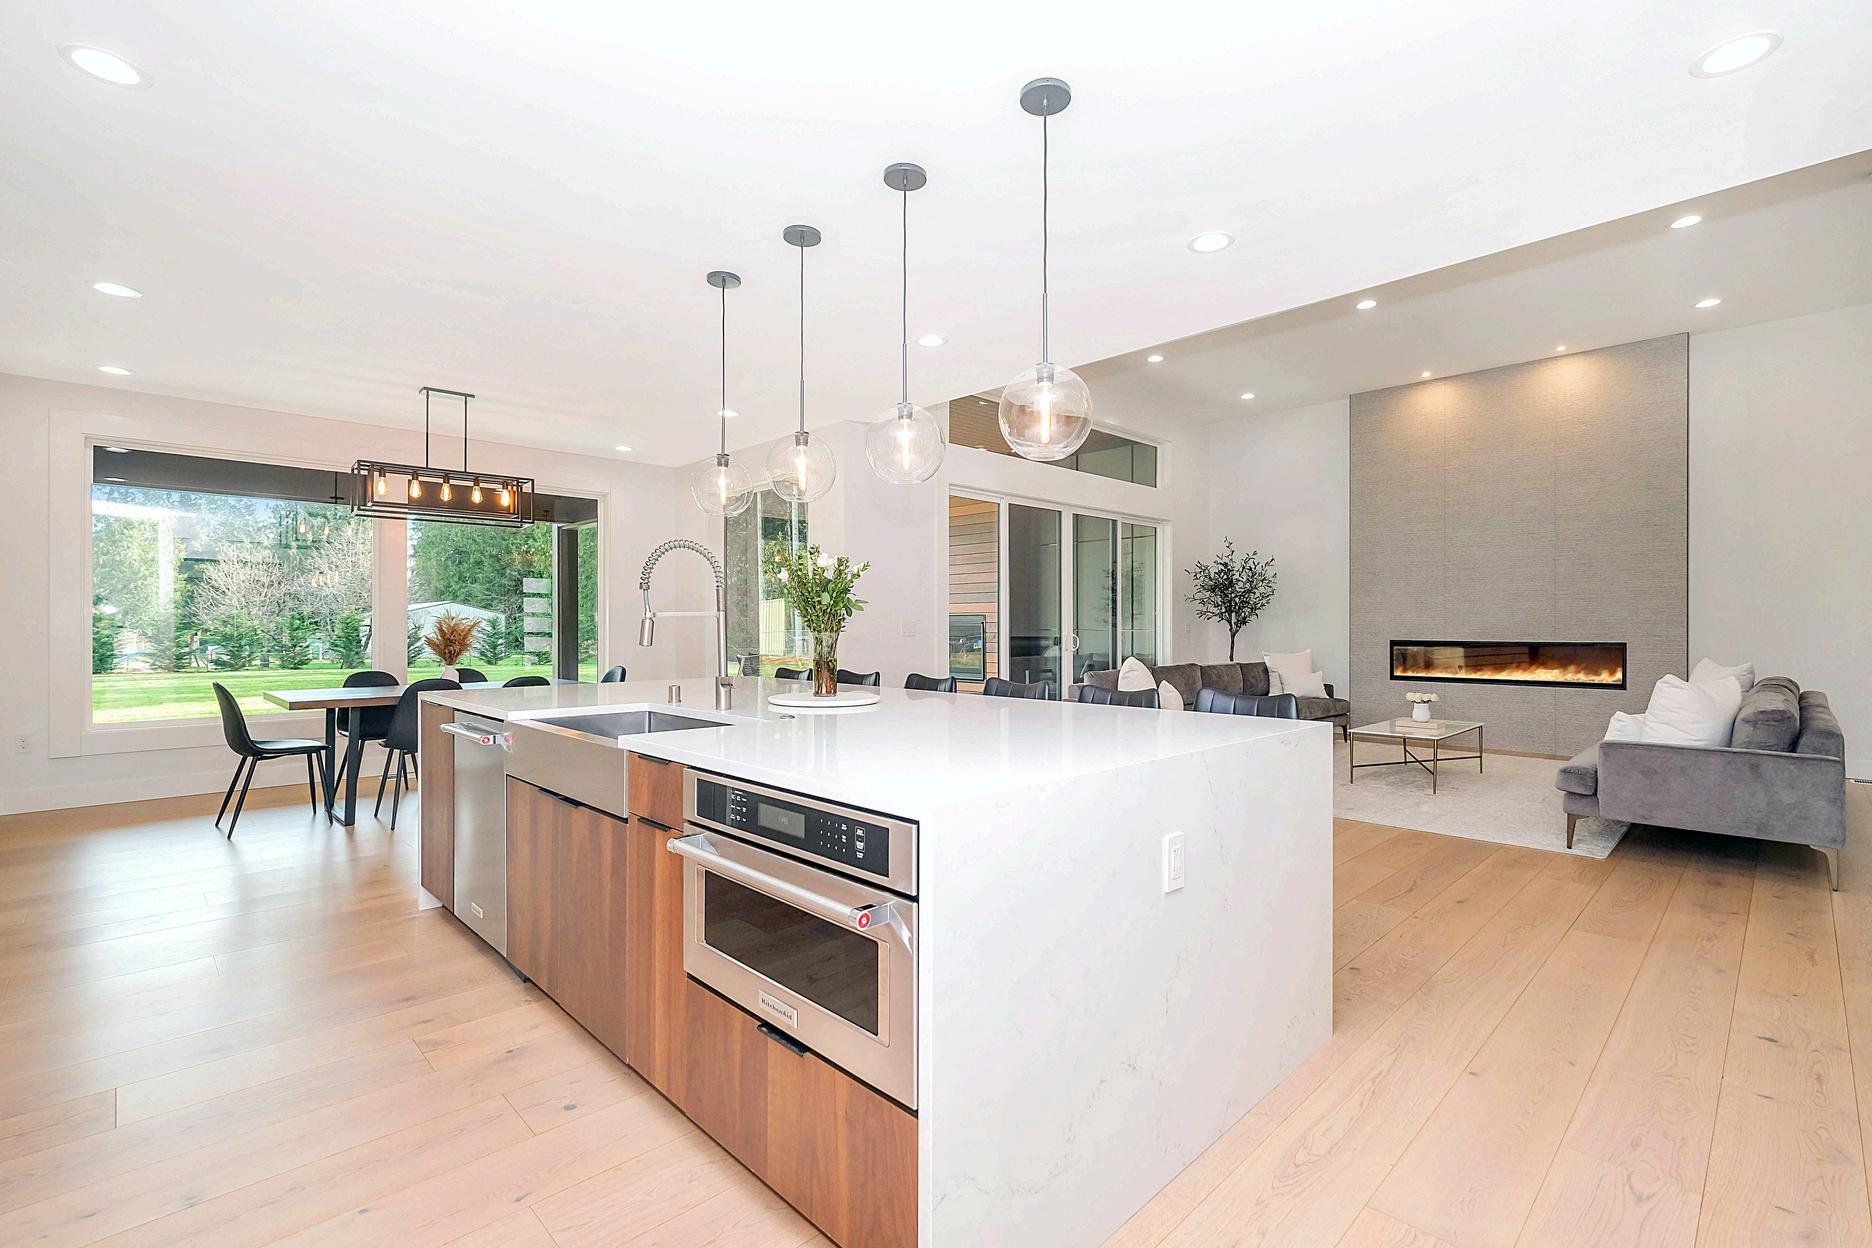
HomeRenovationsThatCanMakea BIG IMPACT AccordingtoExperts
Adding an Accessory Dwelling Unit (ADU) boosts your property value and adds living space. Choose the right partner to ensure your project is smooth and successful.
Choose Expertise Over Inexperience
Building an ADU needs more than construction skills; it requires knowledge of local rules and design. Trust Acton ADU's expertise to avoid mistakes and ensure a seamless process.
Verify
Your ADU Partner’s Credentials
Check that your contractor knows ADU design and local rules to avoid errors. Choose someone with a strong track record in ADU projects.
Conduct Thorough Site Assessments
Not every property suits ADUs. Use experts for site assessments to avoid costly mistakes.
Put Your Trust in The Right Company
Acton ADU has been successfully helping homeowners achieve their property goals for over 35 years. Making the wrong choice in the ADU market can lead to serious financial setbacks. ADUs aren't always ways, but Acton ADU can make it feel that way.
START YOUR ADU PROJECT RIGHT
VENDOR DIRECTORY
When it comes to home ownership, knowing who you can trust is crucial. That's why we've curated a select list of trusted vendors who are ready to help with your home goals.
PaloAlto
What's in the Palo Alto data?
There were 48 single-family homes for sale, providing 1.5 months of inventory. There were 44 new listings, and 32 homes sold at a median price of $3.6m. The median overbid percentage was at 100%, with an average of 20 days on the market.
There were 24 condo and townhome units for sale, providing 2.7 months of inventory. There were 16 new listings and 6 units sold at a median sale price of $1.1m. The median overbid percentage was at 96%, with an average of 46 days on the market.
Single-Family Homes
44 New Listings
32 Sold Listings
1.5 Months of Inventory
$3.6M Median Sale Price
100% Median Sale vs List
20 Avg Days on Market
The data, sourced from InfoSparks and Trend Graphix, includes all single-family homes, condos and townhomes in the California Area above from September 2023 to September 2024. This may include preliminary data, and may vary from the time the data was gathered. All data is deemed reliable but not guaranteed. DRE# 01511642. Copyright KW Advisors Palo Alto 2024. Each office is independently owned and operated.
16
New Listings
6
Sold Listings
2.7
Months of Inventory
$1.1M
Median Sale Price 96%
Median Sale vs List
46
Avg Days on Market
SEPTEMBER 2023 - SEPTEMBER 2024
Single-Family Homes
Last 12 months, year-over-year.
Condos & Townhomes
Last 12 months, year-over-year
Median SalesPrice
Single-Family Homes
The median sale price has increased from $3 2m last September 2023, to $3 6m as of September 2024
Condos & Townhomes
The median sale price has decreased from $1 5m last September 2023, to $1 1m as of September 2024
AVGDays OntheMarket
Single-Family Homes
The average time spent on the market went down from 27 days last September 2023, to 20 days as of September 2024
Condos & Townhomes
The average time spent on the market went up from 32 days in September 2023, to 46 days as of September 2024.
Overbids
Single-Family Homes
The overbid percentage has increased from 99% last September 2023, to 100% a year later
Condos & Townhomes
The overbid percentage has remained the same from 96% last September 2023, to 96% a year later.
Redwood City
What's in the Redwood City data?
There were 52 single-family homes for sale, providing 1.5 months of inventory. There were 47 new listings, and 35 homes sold at a median price of $2.2m. The median overbid percentage was at 102%, with an average of 17 days on the market
There were 19 condo and townhome units for sale, providing 2.1 months of inventory. There were 12 new listings and 11 units sold at a median sale price of $1.2m. The median overbid percentage was at 97%, with an average of 33 days on the market.
Single-Family Homes
47 New Listings
35 Sold Listings
1.5 Months of Inventory
$2.2M Median Sale Price
102%
Median Sale vs List
17 Avg Days on Market
The data, sourced from InfoSparks and Trend Graphix, includes all single-family homes, condos and townhomes in the California Area above from September 2023 to September 2024. This may include preliminary data, and may vary from the time the data was gathered. All data is deemed reliable but not guaranteed. DRE# 01511642. Copyright KW Advisors Palo Alto 2024. Each office is independently owned and operated.
woodCity
SEPTEMBER
2023 - SEPTEMBER 2024
SALE SOLD LISTINGS
mes year-over-year. omes year-over-year
Median SalesPrice
Single-Family Homes
The median sale price has increased from $1 8m last September 2023, to $2 2m as of September 2024
Condos & Townhomes
The median sale price has increased from $1m last September 2023, to $1 2m as of September 2024
AVGDays OntheMarket
Single-Family Homes
The average time spent on the market went down from 39 days last September 2023, to 17 days as of September 2024
Condos & Townhomes
The average time spent on the market went up from 16 days in September 2023, to 33 days as of September 2024.
Overbids
Single-Family Homes
The overbid percentage has remained the same from 102% last September 2023, to 102% a year later
Condos & Townhomes
The overbid percentage has decreased from 109% last September 2023, to 97% a year later.
Portola Valley
What's in the Portola Valley data?
There were 23 single-family homes for sale, providing 7.7 months of inventory. There were 12 new listings, and 2 homes sold at a median price of $4m. The median overbid percentage was at 83%, with an average of 81 days on the market
There was no data for condo and townhouse units for this month.
Single-Family Homes
12 ew Listings
2 Sold Listings
7.7 Months of Inventory
$4M Median Sale Price
83%
Median Sale vs List
81 Avg Days on Market
The data, sourced from InfoSparks and Trend Graphix, includes all single-family homes, condos and townhomes in the California Area above from September 2023 to September 2024. This may include preliminary data, and may vary from the time the data was gathered. All data is deemed reliable but not guaranteed. DRE# 01511642. Copyright KW Advisors Palo Alto 2024. Each office is independently owned and operated.
CONDO Condo & Townhomes
No data for this month.
PortolaValley
SEPTEMBER 2023 - SEPTEMBER 2024
LISTINGS FOR SALE SOLD LISTINGS
Single-Family Homes
Last 12 months, year-over-year.
No data for this month.
Condos & Townhomes
Last 12 months, year-over-year
Median SalesPrice
Single-Family Homes
The median sale price has decreased from $5 1m last September 2023, to $4m as of September 2024
Condos & Townhomes
No data for this month
AVGDays OntheMarket
Single-Family Homes
The average time spent on the market went up from 63 days last September 2023, to 81 days as of September 2024
Condos & Townhomes
No data for this month
Overbids
Single-Family Homes
The overbid percentage has decreased from 91% last September 2023, to 83% a year later
Condos & Townhomes
No data for this month
Menlo
What's in the Men
There were 20 single-family providing 1.2 months of inve new listings, and 17 homes s of $4m. The median overbid 101%, with an average of 22
There were 18 condo and tow sale, providing 3 months of i 15 new listings and 6 units s price of $1.5m. The median was at 99%, with an average market.
all single-family homes, September 2023 to September the time the data was 01511642. Copyright KW Advisors Palo Alto 2024. Each office is independently owned and operated.
New Listings 3
Months of Inventory 99%
Median Sale vs List
Median SalesPrice
Single-Family Homes
The median sale price has increased from $2 9m last September 2023, to $4m as of September 2024
Condos & Townhomes
The median sale price has increased from $1 2m last September 2023, to $1 5m as of September 2024
AVGDays OntheMarket
Single-Family Homes
The average time spent on the market went up from 18 days last September 2023, to 22 days as of September 2024
Condos & Townhomes
The average time spent on the market went up from 9 days in September 2023, to 23 days as of September 2024.
Overbids
Single-Family Homes
The overbid percentage has decreased from 103% last September 2023, to 101% a year later
Condos & Townhomes
The overbid percentage has decreased from 101% last September 2023, to 99% a year later.
Atherton
What's in the Atherton data?
There were 18 single-family homes for sale, providing 1.4 months of inventory. There were 9 new listings, and 4 homes sold at a median price of $5.6m. The median overbid percentage was at 94%, with an average of 37 days on the market.
There was no data for condo and townhouse units for this month.
C Condo
No data for this month.
Median SalesPrice
Single-Family Homes
The median sale price has decreased from $7 9m last September 2023, to $5 6m as of September 2024
Condos & Townhomes
No data for this month
AVGDays OntheMarket
Single-Family Homes
The average time spent on the market went down from 56 days last September 2023, to 37 days as of September 2024
Condos & Townhomes
No data for this month
Overbids
Single-Family Homes
The overbid percentage has increased from 93% last September 2023, to 94% a year later
Condos & Townhomes
No data for this month
LosAltos
What's in the Los Altos data?
There were 28 single-family homes for sale, providing 1.3 months of inventory. There were 33 new listings, and 17 homes sold at a median price of $4.6m. The median overbid percentage was at 101%, with an average of 33 days on the market.
There were 16 condo and townhome units for sale, providing 8 months of inventory. There were 9 new listings and 6 units sold at a median sale price of $2.3m. The median overbid percentage was at 100%, with an average of 28 days on the market.
Single-Family Homes
33 New Listings
17 Sold Listings
1.3 Months of Inventory
$4.6M Median Sale Price
101% Median Sale vs List
33 Avg Days on Market
The data, sourced from InfoSparks and Trend Graphix, includes all single-family homes, condos and townhomes in the California Area above from September 2023 to September 2024. This may include preliminary data, and may vary from the time the data was gathered. All data is deemed reliable but not guaranteed. DRE# 01511642. Copyright KW Advisors Palo Alto 2024. Each office is independently owned and operated.
Median Sale vs List
Median SalesPrice
Single-Family Homes
The median sale price has increased from $4 2m last September 2023, to $4 6m as of September 2024
Condos & Townhomes
The median sale price has increased from $1 8m last September 2023, to $2 3m as of September 2024
AVGDays OntheMarket
Single-Family Homes
The average time spent on the market went up from 22 days last September 2023, to 33 days as of September 2024
Condos & Townhomes
The average time spent on the market went up from 26 days in September 2023, to 28 days as of September 2024.
Overbids
Single-Family Homes
The overbid percentage has remained the same from 101% last September 2023, to 101% a year later
Condos & Townhomes
The overbid percentage has increased from 93% last September 2023, to 100% a year later.
SanJos
What's in the San
There were 320 single-family providing 1 month of invento new listings, and 307 homes price of $1.6m. The median o was at 103% with an average market.
There were 240 condo and to sale, providing 1 9 months of were 182 new listings and 13 median sale price of $810k. T percentage was at 101%, wit days on the market.
all single-family homes, September 2023 to September the time the data was 01511642. Copyright KW Advisors Palo Alto 2024. Each office is independently owned and operated.
New Listings
1.9
Months of Inventory 101%
Median Sale vs List
Median SalesPrice
Single-Family Homes
The median sale price has increased from $1 6m last September 2023, to $1 62m as of September 2024
Condos & Townhomes
The median sale price has decreased from $863k last September 2023, to $810k as of September 2024
AVGDays OntheMarket
Single-Family Homes
The average time spent on the market went down from 18 days last September 2023, to 17 days as of September 2024
Condos & Townhomes
The average time spent on the market went up from 16 days in September 2023, to 28 days as of September 2024.
Overbids
Single-Family Homes
The overbid percentage has decreased from 104% last September 2023, to 103% a year later
Condos & Townhomes
The overbid percentage has decreased from 103% last September 2023, to 101% a year later.
e-Family Homes
14 Sold Listings
3 of Inventory
$2.9M Median Sale Price
7% Sale vs List
10 Avg Days on Market
sourced from InfoSparks and Trend Graphix, includes all single-family homes, townhomes in the California Area above from September 2023 to September may include preliminary data, and may vary from the time the data was data is deemed reliable but not guaranteed. DRE# 01511642. Copyright KW Advisors Palo Alto 2024. Each office is independently owned and operated.
New Listings
1.6
Months of Inventory 101%
Median Sale vs List
Median SalesPrice
Single-Family Homes
The median sale price has increased from $2 5m last September 2023, to $2 9m as of September 2024
Condos & Townhomes
The median sale price has decreased from $1 4m last September 2023, to $1 3m as of September 2024
AVGDays OntheMarket
Single-Family Homes
The average time spent on the market went down from 12 days last September 2023, to 10 days as of September 2024
Condos & Townhomes
The average time spent on the market went up from 18 days in September 2023, to 35 days as of September 2024.
Overbids
Single-Family Homes
The overbid percentage has decreased from 109% last September 2023, to 107% a year later
Condos & Townhomes
The overbid percentage has decreased from 103% last September 2023, to 101% a year later.
SanMate County
What's in the San Mate data?
There were 505 single-family homes providing 1.7 months of inventory. Th new listings, and 325 homes sold at price of $1.9m. The median overbid p was at 103 1%, with an average of 24 market.
There were 271 condo and townhom sale, providing 3 months of inventory 153 new listings and 108 units sold a sale price of $894k. The median ove percentage was at 100%, with an ave days on the market
25 Listings
1.9M ian Sale Price
4 Days on Market
Graphix, includes all single-family homes, above from September 2023 to September may vary from the time the data was guaranteed. DRE# 01511642. Copyright KW Advisors Palo Alto 2024. Each office is independently owned and operated.
New Listings
108
Sold Listings
3
Months of Inventory $894K
Median Sale Price 100%
Median Sale vs List
41 Avg Days on Market
SanMateo
SEPTEMBER 2023 - SEPTEMBER 2024
LISTINGS FOR SALE SOLD LISTINGS
Single-Family Homes
Last 12 months, year-over-year.
Condos & Townhomes
Last 12 months, year-over-year
Median SalesPrice
Single-Family Homes
The median sale price has increased from $1 8m last September 2023, to $1 9m as of September 2024
Condos & Townhomes
The median sale price has increased from $890k last September 2023, to $894k as of September 2024
AVGDays OntheMarket
Single-Family Homes
The average time spent on the market went down from 25 days last September 2023, to 24 days as of September 2024
Condos & Townhomes
The average time spent on the market went up from 38 days in September 2023, to 41 days as of September 2024.
Overbids
Single-Family Homes
The overbid percentage has increased from 101 9% last September 2023, to 103 1% a year later
Condos & Townhomes
The overbid percentage has remained the same from 100% last September 2023, to 100% a year later.
SantaClara County
What's in the Santa Clara County data?
There were 914 single-family homes for sale, providing 1.4 months of inventory. There were 961 new listings, and 631 homes sold at a median price of $1.9m. The median overbid percentage was at 102 9%, with an average of 22 days on the market.
There were 599 condo and townhome units for sale, providing 2.1 months of inventory. There were 449 new listings and 279 units sold at a median sale price of $1m. The median overbid percentage was at 100.7%, with an average of 29 days on the market
mily Homes
631 Sold Listings
$1.9M Median Sale Price
InfoSparks and Trend Graphix, includes all single-family homes, the California Area above from September 2023 to September preliminary data, and may vary from the time the data was med reliable but not guaranteed. DRE# 01511642. Copyright KW Advisors Palo Alto 2024. Each office is independently owned and operated. ory
9% ist
22 Avg Days on Market
Condo
& Townhomes
449
New Listings
279
Sold Listings
2.1
Months of Inventory
$1M
Median Sale Price
100.7%
Median Sale vs List
29 Avg Days on Market
SantaClaraCounty
SEPTEMBER 2023 - SEPTEMBER 2024
LISTINGS FOR SALE SOLD LISTINGS
gle-Family Homes
t 12 months, year-over-year.
ndos & Townhomes
t 12 months, year-over-year
Median SalesPrice
Single-Family Homes
The median sale price has increased from $1 8m last September 2023, to $1 9m as of September 2024
Condos & Townhomes
The median sale price has decreased from $1 03m last September 2023, to $1m as of September 2024
AVGDays OntheMarket
Single-Family Homes
The average time spent on the market went up from 18 days last September 2023, to 22 days as of September 2024
Condos & Townhomes
The average time spent on the market went up from 18 days in September 2023, to 29 days as of September 2024.
Overbids
Single-Family Homes
The overbid percentage has decreased from 103 9% last September 2023, to 102 9% a year later
Condos & Townhomes
The overbid percentage has decreased from 101.6% last September 2023, to 100.7% a year later.
Monterey County
What's in the Monterey County data?
There were 439 single-family homes for sale, providing 2.8 months of inventory. There were 178 new listings, and 147 homes sold at a median price of $1m. The median overbid percentage was at 93%, with an average of 37 days on the market
There were 65 condo and townhome units for sale, providing 2.3 months of inventory. There were 35 new listings and 19 units sold at a median sale price of $858k. The median overbid percentage was at 96%, with an average of 41 days on the market.
35
New Listings
19
Sold Listings
2.3
Months of Inventory
$858K
Median Sale Price 96%
Median Sale vs List
41 Avg Days on Market
MontereyCounty
SEPTEMBER 2023 - SEPTEMBER 2024
LISTINGS FOR SALE SOLD LISTINGS
Single-Family Homes
Last 12 months, year-over-year.
Condos & Townhomes
Last 12 months, year-over-year
Median SalesPrice
Single-Family Homes
The median sale price has increased from $943k last September 2023, to $1m as of September 2024
Condos & Townhomes
The median sale price has increased from $835k last September 2023, to $858k as of September 2024
AVGDays OntheMarket
Single-Family Homes
The average time spent on the market went up from 33 days last September 2023, to 37 days as of September 2024
Condos & Townhomes
The average time spent on the market went up from 30 days in September 2023, to 41 days as of September 2024.
Overbids
Single-Family Homes
The overbid percentage has decreased from 95% last September 2023, to 93% a year later
Condos & Townhomes
The overbid percentage has increased from 94% last September 2023, to 96% a year later.
SantaCruz County
What's in the Santa Cruz County data?
There were 348 single-family homes for sale, providing 3 months of inventory. There were 164 new listings, and 95 homes sold at a median price of $1.3m. The median overbid percentage was at 95%, with an average of 40 days on the market.
There were 87 condo and townhome units for sale, providing 2.6 months of inventory. There were 44 new listings and 23 units sold at a median sale price of $885k. The median overbid percentage was at 96%, with an average of 44 days on the market.
Single-Family Homes
164 ew Listings
95 Sold Listings
3 Months of Inventory
$1.3M Median Sale Price
95%
Median Sale vs List
40 Avg Days on Market
The data, sourced from InfoSparks and Trend Graphix, includes all single-family homes, condos and townhomes in the California Area above from September 2023 to September 2024. This may include preliminary data, and may vary from the time the data was gathered. All data is deemed reliable but not guaranteed. DRE# 01511642. Copyright KW Advisors Palo Alto 2024. Each office is independently owned and operated.
aCruzCounty
SEPTEMBER 2023 - SEPTEMBER 2024
R SALE SOLD LISTINGS
mes year-over-year.
omes , year-over-year
Median SalesPrice
Single-Family Homes
The median sale price has increased from $1 1m last September 2023, to $1 3m as of September 2024
Condos & Townhomes
The median sale price has increased from $770k last September 2023, to $885k as of September 2024
AVGDays OntheMarket
Single-Family Homes
The average time spent on the market went up from 36 days last September 2023, to 40 days as of September 2024
Condos & Townhomes
The average time spent on the market went up from 14 days in September 2023, to 44 days as of September 2024.
Overbids
Single-Family Homes
The overbid percentage has decreased from 96% last September 2023, to 95% a year later
Condos & Townhomes
The overbid percentage has decreased from 100% last September 2023, to 96% a year later.
East PaloAlto
What's in the East Palo Alto data?
There were 8 single-family homes for sale, providing 1.1 months of inventory. There were 6 new listings, and 2 homes sold at a median price of $1m. The median overbid percentage was at 96%, with an average of 8 days on the market
There was 1 condo and townhome unit for sale, providing 1 month of inventory. There was 1 new listing and 2 units sold at a median sale price of $695k. The median overbid percentage was at 94%, with an average of 98 days on the market.
mily Homes
2 Sold Listings
$1M Median Sale Price ist
InfoSparks and Trend Graphix, includes all single-family homes, the California Area above from September 2023 to September preliminary data, and may vary from the time the data was med reliable but not guaranteed. DRE# 01511642. Copyright KW Advisors Palo Alto 2024. Each office is independently owned and operated. ory
8 Avg Days on Market
Condo & Townhomes
1 New Listing
2 Sold Listings
1 Month of Inventory $695K
Median Sale Price 94%
Median Sale vs List 98 Avg Days on Market
SEPTEMBER 2023 - SEPTEMBER 2024
LISTINGS FOR SALE SOLD LISTINGS
Single-Family Homes
Last 12 months, year-over-year.
Condos & Townhomes
Last 12 months, year-over-year
Median SalesPrice
Single-Family Homes
The median sale price has increased from $948k last September 2023, to $1m as of September 2024
Condos & Townhomes
The median sale price has increased from $0 last September 2023, to $695k as of September 2024
AVGDays OntheMarket
Single-Family Homes
The average time spent on the market went down from 23 days last September 2023, to 8 days as of September 2024
Condos & Townhomes
The average time spent on the market went up from 0 days in September 2023, to 98 days as of September 2024.
Overbids
Single-Family Homes
The overbid percentage has decreased from 102% last September 2023, to 96% a year later
Condos & Townhomes
The overbid percentage has increased from 0% last September 2023, to 94% a year later.
Sunnyv
What's in the Sunn
There were 28 single-family h providing 0.6 months of inve new listings, and 31 homes s of $2.5m. The median overbi 112% with an average of 9 da
There were 33 condo and tow sale, providing 1.5 months of were 36 new listings and 14 sale price of $1.6m. The med percentage was at 107%, wit days on the market.
all single-family homes, September 2023 to September the time the data was 01511642. Copyright KW Advisors Palo Alto 2024. Each office is independently owned and operated.
SEPTEMBER 2023 - SEPTEMBER 2024
STINGS FOR SALE SOLD LISTINGS
e-Family Homes
12 months, year-over-year.
os & Townhomes
12 months, year-over-year
Median SalesPrice
Single-Family Homes
The median sale price has increased from $2 4m last September 2023, to $2 5m as of September 2024
Condos & Townhomes
The median sale price has increased from $1 5m last September 2023, to $1 6m as of September 2024
AVGDays OntheMarket
Single-Family Homes
The average time spent on the market went down from 14 days last September 2023, to 9 days as of September 2024
Condos & Townhomes
The average time spent on the market remained the same from 17 days in September 2023, to 17 days as of September 2024.
Overbids
Single-Family Homes
The overbid percentage has increased from 106% last September 2023, to 112% a year later
Condos & Townhomes
The overbid percentage has increased from 103% last September 2023, to 107% a year later.
SantaC City
What's in the Sant data?
There were 31 single-family h providing 1.1 months of inve new listings, and 30 homes s of $1.9m. The median overbi 108%, with an average of 11
There were 38 condo and tow sale, providing 1.9 months of were 32 new listings and 19 sale price of $1.4m. The med percentage was at 102%, wit days on the market.
all single-family homes, September 2023 to September the time the data was 01511642. Copyright KW Advisors Palo Alto 2024. Each office is independently owned and operated.
Condo & Townhomes
32
New Listings
19
Sold Listings
1.9
Months of Inventory
$1.4M
Median Sale Price
102%
Median Sale vs List 17
Avg Days on Market
SantaClaraCity
SEPTEMBER 2023 - SEPTEMBER 2024
LISTINGS FOR SALE SOLD LISTINGS
Single-Family Homes
Last 12 months, year-over-year.
Condos & Townhomes
Last 12 months, year-over-year
Median SalesPrice
Single-Family Homes
The median sale price has increased from $1 8m last September 2023, to $1 9m as of September 2024
Condos & Townhomes
The median sale price has increased from $1 2m last September 2023, to $1 4m as of September 2024
AVGDays OntheMarket
Single-Family Homes
The average time spent on the market went up from 9 days last September 2023, to 11 days as of September 2024
Condos & Townhomes
The average time spent on the market went up from 8 days in September 2023, to 17 days as of September 2024.
Overbids
Single-Family Homes
The overbid percentage has decreased from 109% last September 2023, to 108% a year later
Condos & Townhomes
The overbid percentage has decreased from 104% last September 2023, to 102% a year later.
Saratoga
What's in the Saratoga data?
There were 27 single-family homes for sale, providing 1.4 months of inventory. There were 22 new listings, and 20 homes sold at a median price of $4.2m. The median overbid percentage was at 102%, with an average of 16 days on the market.
There were 4 condo and townhome units for sale, providing 4 months of inventory. There were 4 new listings and 3 units sold at a median sale price of $1.7m. The median overbid percentage was at 105%, with an average of 12 days on the market.
Single-Family Homes
22 New Listings
20 Sold Listings
1.4 Months of Inventory
$4.2M Median Sale Price
102% Median Sale vs List
16 Avg Days on Market
The data, sourced from InfoSparks and Trend Graphix, includes all single-family homes, condos and townhomes in the California Area above from September 2023 to September 2024. This may include preliminary data, and may vary from the time the data was gathered. All data is deemed reliable but not guaranteed. DRE# 01511642. Copyright KW Advisors Palo Alto 2024. Each office is independently owned and operated.
Listings
Months of Inventory $ M 105% Median Sale vs List Av
SEPTEMBER 2023 - SEPTEMBER 2024
Median SalesPrice
Single-Family Homes
The median sale price has increased from $3 9m last September 2023, to $4 2m as of September 2024
Condos & Townhomes
The median sale price has increased from $1m last September 2023, to $1 7m as of September 2024
AVGDays OntheMarket
Single-Family Homes
The average time spent on the market went down from 17 days last September 2023, to 16 days as of September 2024
Condos & Townhomes
The average time spent on the market went up from 7 days in September 2023, to 12 days as of September 2024.
Overbids
Single-Family Homes
The overbid percentage has remained the same from 102% last September 2023, to 102% a year later
Condos & Townhomes
The overbid percentage has increased from 103% last September 2023, to 105% a year later.