


July 2023 Copyright by KW Advisors 2023
San Francisco
Bay area
Alameda
Jump to Alameda Report
Contra Costa
Jump to Contra Costa Report
Napa
Jump to Napa Report
San Francisco County
Jump to San Francisco County Report
San Mateo

Jump to San Mateo Report
Santa Clara
Jump to Santa Clara Report
Solano
Jump to Solano Report
Sonoma
Jump to Sonoma Report
Southern/Central Marin
Jump to Marin Report
That's the question you should be asking yourself.
Our market is incredibly diverse and rapidly changing. Values vary not just by neighborhood but by street. Your home isn't necessarily worth what your neighbors' home is It's the current market that sets the value of your home.

So, do you know what your home is worth in today's market?
Contact me for a confidential, no ob assessment of your home's value.
Icanhelp...
What’syourhome reallyworthin today’smarket?
TwoQuestionsToAskYourselfif You’reConsideringBuyinga Home
If you’re thinking of buying a home, chances are you’re paying attention to just about everything you hear about the housing market. And you’re getting your information from a variety of channels: the news, social media, your real estate agent, conversations with friends and loved ones, overhearing someone chatting at the local supermarket, the list goes on and on. Most likely, home prices and mortgage rates are coming up a lot.
To help cut through the noise and give you the information you need most, take a look at what the data says. Here are the top two questions you need to ask yourself about home prices and mortgage rates as you make your decision:

1. Where Do I Think Home Prices Are Heading?
One reliable place you can turn to for that information is the Home Price Expectation Survey from Pulsenomics – a survey of a national panel of over one hundred economists, real estate experts, and investment and market strategists.
According to the latest release, the experts surveyed are projecting slight depreciation this year (see the red in the graph below). But here’s the context you need most. The worst home price declines are already behind us, and prices are actually appreciating again in many markets. Not to mention, the small 0.37% depreciation HPES is showing for 2023 is far from the crash some people originally said would happen.
Now, let’s look to the future. The green in the graph below shows prices have turned a corner and are expected to appreciate in 2024 and beyond. After this year, the HPES is forecasting home price appreciation returning to more normal levels for the next several years.
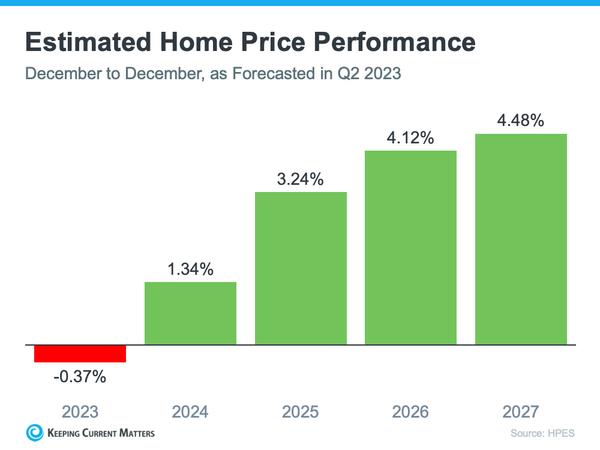
So, why does this matter to you? It means your home will likely grow in value and you should gain home equity in the years ahead, but only if you buy now. If you wait, based on these forecasts, the home will only cost you more later on.
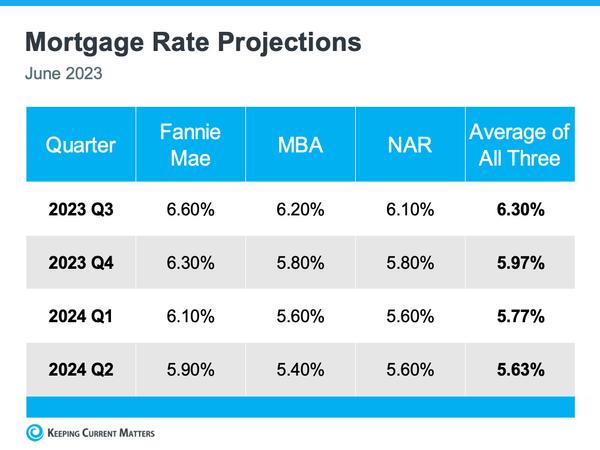
2. Where Do I Think Mortgage Rates Are Heading?
Over the past year, mortgage rates have risen in response to economic uncertainty, inflation, and more. We know based on the latest reports that inflation, while still high, has moderated from its peak. This is an encouraging sign for the market and for mortgage rates. Here’s why.
When inflation cools, mortgage rates generally fall in response. This may be why some experts are saying mortgage rates will pull back slightly over the next few quarters and settle somewhere around roughly 5.5 and 6% on average.
But, not even the experts can say with absolute certainty where mortgage rates will be next year, or even next month. That’s because there are so many factors that can impact what happens. So, to give you a lens into the various possible outcomes, here’s what you should consider:
If you buy now and mortgage rates don’t change: You made a good move since home prices are projected to grow with time, so at least you beat rising prices.
If you buy now and mortgage rates fall (as projected): You probably still made a good decision because you got the house before home prices appreciated more. And, you can always refinance your home later on if rates are lower.
If you buy now and mortgage rates rise: If this happens, you made a great decision because you bought before both the price of the home and the mortgage rate went up.
Source: Keeping Current Matters
Alam
What's in th
There were 1,496 s providing 1 month new listings, and 66 of $1.3m. The med 108.6%, with an ave
There were 686 con providing 1.5 mont new listings and 21 of $730k. The med with an average of

1,496 New Listings
668 Sold Listings
1 Months of Inventory
$1.3M Median Sale Price
108.6% Median Sale vs List
16 Avg Days on Market
SFH Single-Family Homes
686 New Listings
216 Sold Listings

1.5 Months of Inventory
$730K Median Sale Price
103% Median Sale vs List
19 Avg Days on Market
COND Condo & Townh
Last
Townhomes
year-over-year. Jun2022 Jul2022 Aug2022 Sep2022 Oct2022 Nov2022 Dec2022 Jan2023 Feb2023 Mar2023 Apr2023 May2023 Jun2023 4000 3000 2000 1000 0 Jun2022 Jul2022 Aug2022 Sep2022 Oct2022 Nov2022 Dec2022 Jan2023 Feb2023 Mar2023 Apr2023 May2023 Jun2023 1500 1000 500 0 AlamedaCounty
2022 - JUNE 2023
Homes
onths,
JUNE
Single-Family
12 months, year-over-year. LISTINGS FOR SALE SOLD LISTINGS
Median Sales Price
Single-Family Homes
The median sales price has decreased from $1 4m last June 2022, to $1 3m as of June 2023
Condos & Townhomes
The median sales price has decreased from $778k last June 2022, to $730k as of June 2023.
AVG Days On the Market
Single-Family Homes
The average time spent on the market went down from 19 days last June 2022, to 16 days as of June 2023
Condos & Townhomes
The average time spent on the market remained the same with 19 days in June 2022, to 19 days as of June 2023
Overbids
Single-Family Homes
The overbid percentage has decreased from 112.9% last June 2022, to 108.6% a year later.
Condos & Townhomes
The overbid percentage has decreased from 105 4% last June 2022, to 103% a year later.
Back to Table of Contents Jun2022 Jul2022Aug2022Sep2022Oct2022Nov2022Dec2022 Jan2023Feb2023Mar2023Apr2023May2023Jun2023 $1,500,000 $1,000,000 $500,000 $0 Jun2022 Jul2022Aug2022Sep2022Oct2022Nov2022Dec2022 Jan2023Feb2023Mar2023Apr2023May2023 Jun2023 50 40 30 20 10 0 Jun2022 Jul2022Aug2022Sep2022Oct2022Nov2022Dec2022 Jan2023Feb2023Mar2023Apr2023May2023 Jun2023 125% 100% 75% 50% 25% 0%

Contra Costa
What's in the Contra Costa d
In June, Contra Costa had 791 single-family h for sale with 889 new listings, resulting in 1.2 months of inventory. The median sale price in to $930k. The median overbid remained stea 102.2%. The average time spent on the marke 19 days.
There were 265 condo and townhome units f with 194 new listings, providing the market w months of inventory. The median sale price in to $628k. The median overbid remained stea 100.2%. The average time spent on the marke 24 days.

17 Listings
930K an Sale Price
9 ays on Market
ly homes, condos and townhomes
This may include preliminary data, data is deemed reliable but not Francisco | Napa Valley 2023. Each

265 New Listings 1.6 Months of Inventory $628K Median Sale Pric 100.2% Median Sale vs List 24 Avg Days on Marke 194 Sold Listing CONDO Condo & Townhome
LISTINGS FOR SALE SOLD LISTINGS
y y
Median Sales Price
Single-Family Homes
The median sales price has increased from $925K last June 2022, to $930K as of June 2023
Condos & Townhomes
The median sales price has increased from $600k last June 2022, to $628k as of June 2023.
AVG Days On the Market
Single-Family Homes
The average time spent on the market went up from 16 days last June 2022, to 19 days as of June 2023
Condos & Townhomes
The average time spent on the market went up from 14 days in June 2022, to 24 days as of June 2023
Overbids
Single-Family Homes
The overbid percentage has decreased from 103.2% last June 2022, to 102.2% a year later.
Condos & Townhomes
The overbid percentage has decreased from 103 8% last June 2022, to 100.2% a year later.
Jun2022 Jul2022Aug2022Sep2022Oct2022Nov2022Dec2022 Jan2023Feb2023Mar2023Apr2023May2023Jun2023 $1,000,000 $750,000 $500,000 $250,000 $0 Jun2022 Jul2022Aug2022Sep2022Oct2022Nov2022Dec2022 Jan2023Feb2023Mar2023Apr2023May2023 Jun2023 50 40 30 20 10 0 Jun2022 Jul2022Aug2022Sep2022Oct2022Nov2022Dec2022 Jan2023Feb2023Mar2023Apr2023May2023 Jun2023 125% 100% 75% 50% 25% 0%
Back to Table of Contents

Napa County
What's in the Nap
In June, Napa County had 25 for sale with 70 new listings inventory. The median sale homes increased to $852k. remained steady at 100%. T market was 50 days.
There were 24 condo and to 15 new listings providing th months of inventory. The m condos increased to $695k. decreased slightly to 100.3% the market was 53 days.

The data, sourced from InfoSparks, includes all single-family homes, condos and townhomes in the California Area above from June 2022 to June 2023 This may include preliminary data, and may vary from the time the data was gathered All data is deemed reliable but not guaranteed. DRE# 01995149. Copyright KW Advisors San Francisco | Napa Valley 2023. Each office is independently owned and operated
e Price ngs on
52K
Market

1
LISTINGS FOR SALE SOLD LISTINGS
ep2022 Oct2022 Nov2022 Dec2022 Jan2023 Feb2023 Mar2023 Apr2023 May2023 Jun2023 Sep2022 Oct2022 Nov2022 Dec2022 Jan2023 Feb2023 Mar2023 Apr2023 May2023 Jun2023 a E 2023 omes year-over-year. homes year-over-year.
Median Sales Price
Single-Family Homes
The median sales price has decreased from $950k last June 2022, to $852k as of June 2023
Condos & Townhomes
The median sales price has increased from $575k last June 2022, to $695k as of June 2023.
AVG Days On the Market
Single-Family Homes
The average time spent on the market went up from 45 days last June 2022, to 50 days as of June 2023
Condos & Townhomes
The average time spent on the market went up from 30 days in June 2022, to 53 days as of June 2023
Overbids
Single-Family Homes
The overbid percentage has remained at 100% since June 2022.
Condos & Townhomes
The overbid percentage has decreased from 103% last June 2022, to 100.3% a year later.
Jun2022 Jul2022Aug2022Sep2022Oct2022Nov2022Dec2022 Jan2023Feb2023Mar2023Apr2023May2023Jun2023 $1,250,000 $1,000,000 $750,000 $500,000 $250,000 $0 Jun2022 Jul2022Aug2022Sep2022Oct2022Nov2022Dec2022 Jan2023Feb2023Mar2023Apr2023May2023 Jun2023 80 60 40 20 0 Jun2022 Jul2022Aug2022Sep2022Oct2022Nov2022Dec2022 Jan2023Feb2023Mar2023Apr2023May2023 Jun2023 125% 100% 75% 50% 25% 0%
Back to Table of Contents

SanFrancisco County
What's in the San Francisco County data?
In June, San Francisco had 288 single-family homes for sale with 214 new listings, providing the market with 1.7 months of inventory. A total of 197 homes were sold, with a median sale price of $1.6m. The median overbid for single-family homes was 106.2%. The average time on the market was 25 days.
There were 620 condo and townhome units for sale, providing the market with 3.6 months of inventory in January. There were 278 new listings for sale and 165 condos sold. The median sale price for condos was $1.1m. The median overbid was 100%. The average time on the market was 53 days.

SFH Single-Family Homes
214 New Listings
197 Sold Listings
1.7 Months of Inventory
$1.6M Median Sale Price
106.2% Median Sale vs List
25 Avg Days on Market
The data, sourced from InfoSparks, includes all single-family homes, condos and townhomes in the California Area above from June 2022 to June 2023 This may include preliminary data, and may vary from the time the data was gathered All data is deemed reliable but not guaranteed. DRE# 01995149. Copyright KW Advisors San Francisco | Napa Valley 2023. Each office is independently owned and operated
CONDO
Condo & Townhomes
278 New Listings
165 Sold Listings

3.6 Months of Inventory
$1.1M Median Sale Price
100% Median Sale vs List
53 Avg Days on Market
Single-Family Homes
Last 12 months, year-over-year.
Condos & Townhomes
Last 12 months, year-over-year.
Jun2022 Jul2022 Aug2022 Sep2022 Oct2022 Nov2022 Dec2022 Jan2023 Feb2023 Mar2023 Apr2023 May2023 Jun2023 750 500 250 0 Jun2022 Jul2022 Aug2022 Sep2022 Oct2022 Nov2022 Dec2022 Jan2023 Feb2023 Mar2023 Apr2023 May2023 Jun2023 1500 1000 500 0 SanFranciscoCounty
2022 - JUNE 2023
JUNE
LISTINGS FOR SALE SOLD LISTINGS
Median Sales Price
Single-Family Homes
The median sales price has decreased from $1 8m last June 2022, to $1 6m as of June 2023
Condos & Townhomes
The median sales price has decreased from $1.2m last June 2022, to $1.1m as of June 2023.
AVG Days On the Market
Single-Family Homes
The average time spent on the market went up from 17 days last June 2022, to 25 days as of June 2023
Condos & Townhomes
The average time spent on the market went up from 37 days in June 2022, to 53 days as of June 2023
Overbids
Single-Family Homes
The overbid percentage has decreased from 116.1% last June 2022, to 106.2% a year later.
Condos & Townhomes
The overbid percentage has decreased from 102% last June 2022, to 100.% a year later.
Jun2022 Jul2022Aug2022Sep2022Oct2022Nov2022Dec2022 Jan2023Feb2023Mar2023Apr2023May2023Jun2023 $2,000,000 $1,500,000 $1,000,000 $500,000 $0 Jun2022 Jul2022Aug2022Sep2022Oct2022Nov2022Dec2022 Jan2023Feb2023Mar2023Apr2023May2023 Jun2023 100 75 50 25 0 Jun2022 Jul2022Aug2022Sep2022Oct2022Nov2022Dec2022 Jan2023Feb2023Mar2023Apr2023May2023 Jun2023 125% 100% 75% 50% 25% 0%
Back to Table of Contents

SanM Count
What's in the S data?
In June, San Mateo had sale, providing the mar inventory. There were 4 364 homes sold. The m family homes was $1.9 single-family homes w on the market for singl
There were 163 condo providing 1.8 months o There were 126 new lis sold. The median sale p The median overbid wa on the market was 19 d

s
64 d Listings
1.9M an Sale Price
1 Days on Market
The data, sourced from InfoSparks, includes all single-family homes, condos and townhomes in the California Area above from June 2022 to June 2023 This may include preliminary data, and may vary from the time the data was gathered All data is deemed reliable but not guaranteed. DRE# 01995149. Copyright KW Advisors San Francisco | Napa Valley 2023. Each office is independently owned and operated

126 New Listings 1.8 Months of Inventory $982K Median Sale Price 100.9% Median Sale vs List 19 Avg Days on Market 114 Sold Listings CONDO Condo & Townhomes
Single-Family Homes
Last 12 months, year-over-year.
Condos & Townhomes
Last 12 months, year-over-year.
Jun2022 Jul2022 Aug2022 Sep2022 Oct2022 Nov2022 Dec2022 Jan2023 Feb2023 Mar2023 Apr2023 May2023 Jun2023 1250 1000 750 500 250 0 Jun2022 Jul2022 Aug2022 Sep2022 Oct2022 Nov2022 Dec2022 Jan2023 Feb2023 Mar2023 Apr2023 May2023 Jun2023 400 300 200 100 0 SanMateoCounty
JUNE 2023
JUNE 2022 -
LISTINGS FOR SALE SOLD LISTINGS
Median Sales Price
Single-Family Homes
The median sales price has decreased from $2m last June 2022, to $1 9m as of June 2023
Condos & Townhomes
The median sales price has increased from $940k last June 2022, to $982k as of June 2023.
AVG Days On the Market
Single-Family Homes
The average time spent on the market went up from 15 days last June 2022, to 21 days as of June 2023
Condos & Townhomes
The average time spent on the market went down from 20 days in June 2022, to 19 days as of June 2023
Overbids
Single-Family Homes
The overbid percentage has decreased from 107.7% last June 2022, to 101.3% a year later.
Condos & Townhomes
The overbid percentage has decreased from 102 6% last June 2022, to 100.9% a year later.
Jun2022 Jul2022Aug2022Sep2022Oct2022Nov2022Dec2022 Jan2023Feb2023Mar2023Apr2023May2023Jun2023 $2,500,000 $2,000,000 $1,500,000 $1,000,000 $500,000 $0 Jun2022 Jul2022Aug2022Sep2022Oct2022Nov2022Dec2022 Jan2023Feb2023Mar2023Apr2023May2023 Jun2023 60 40 20 0 Jun2022 Jul2022Aug2022Sep2022Oct2022Nov2022Dec2022 Jan2023Feb2023Mar2023Apr2023May2023 Jun2023 125% 100% 75% 50% 25% 0%
Back to Table of Contents

Sant Coun
What's in t data?
Santa Clara had 6 June, providing on were 785 new lis median sale price 103.9%. There wa market. There were 272 u months of invent sale and 304 cond price at $1m and the average time 18 days.

MThe data, sourced from InfoSparks, includes all single-family homes, condos and townhomes in the California Area above from June 2022 to June 2023 This may include preliminary data, and may vary from the time the data was gathered All data is deemed reliable but not guaranteed. DRE# 01995149. Copyright KW Advisors San Francisco | Napa Valley 2023. Each office is independently owned and operated

Last
Last 12 months, year-over-year.

Jun2022 Jul2022 Aug2022 Sep2022 Oct2022 Nov2022 Dec2022 Jan2023 Feb2023 Mar2023 Apr2023 May2023 Jun2023 2500 2000 1500 1000 500 0 Jun2022 Jul2022 Aug2022 Sep2022 Oct2022 Nov2022 Dec2022 Jan2023 Feb2023 Mar2023 Apr2023 May2023 Jun2023 1250 1000 750 500 250 0 SantaClaraCounty JUNE 2022 - JUNE 2023
Homes
Single-Family
& Townhomes
12 months, year-over-year. Condos
LISTINGS FOR SALE SOLD LISTINGS
Median Sales Price
Single-Family Homes
The median sales price has remained at $1 8m since June 2022
Condos & Townhomes
The median sales price has increased from $965k last June 2022, to $1m as of June 2023.
AVG Days On the Market
Single-Family Homes
The average time spent on the market went up from 14 days last June 2022, to 17 days as of June 2023
Condos & Townhomes
The average time spent on the market went up from 14 days in June 2022, to 18 days as of June 2023
Overbids
Single-Family Homes
The overbid percentage has decreased from 104.9% last June 2022, to 103.9% a year later.
Condos & Townhomes
The overbid percentage has decreased from 104% last June 2022, to 102.3% a year later.
Jun2022 Jul2022Aug2022Sep2022Oct2022Nov2022Dec2022 Jan2023Feb2023Mar2023Apr2023May2023Jun2023 $2,000,000 $1,500,000 $1,000,000 $500,000 $0 Jun2022 Jul2022Aug2022Sep2022Oct2022Nov2022Dec2022 Jan2023Feb2023Mar2023Apr2023May2023 Jun2023 40 30 20 10 0 Jun2022 Jul2022Aug2022Sep2022Oct2022Nov2022Dec2022 Jan2023Feb2023Mar2023Apr2023May2023 Jun2023 125% 100% 75% 50% 25% 0%
Back to Table of Contents
Solano County
What's in the Solano County data?
In June, Solano had 398 homes for sale with only 1.2 months of inventory, and 318 new listings were added to the market. The median sale price for single-family homes was $590k, and the median overbid was 100.5%. The average time on the market was 31 days.
There were 36 condo and townhome units for sale with 1.4 months of inventory, and 25 new listings were added to the market. The median sale price was $350k, and the median overbid was 100%. There was an average of 42 days spent on the market.

SFH Single-Family Homes
318 New Listings
326 Sold Listings
1.2 Months of Inventory
$590K Median Sale Price
100.5% Median Sale vs List
31 Avg Days on Market
The data, sourced from InfoSparks, includes all single-family homes, condos and townhomes in the California Area above from June 2022 to June 2023 This may include preliminary data, and may vary from the time the data was gathered All data is deemed reliable but not guaranteed. DRE# 01995149. Copyright KW Advisors San Francisco | Napa Valley 2023. Each office is independently owned and operated
25 New Listings
Months of Inventory $350K Median Sale Price 100% Median Sale vs List 42 Avg Days on Market 25 Sold Listings CONDO Condo & Townhomes
1.4
Single-Family Homes
Last 12 months, year-over-year.
Condos & Townhomes
Last 12 months, year-over-year.
Jun2022 Jul2022 Aug2022 Sep2022 Oct2022 Nov2022 Dec2022 Jan2023 Feb2023 Mar2023 Apr2023 May2023 Jun2023 2000 1500 1000 500 0 Jun2022 Jul2022 Aug2022 Sep2022 Oct2022 Nov2022 Dec2022 Jan2023 Feb2023 Mar2023 Apr2023 May2023 Jun2023 125 100 75 50 25 0 Solano
JUNE 2022 - JUNE 2023
LISTINGS FOR SALE SOLD LISTINGS
Median Sales Price
Single-Family Homes
The median sales price has decreased from $625k last June 2022, to $590k as of June 2023
Condos & Townhomes
The median sales price has decreased from $400k last June 2022, to $350k as of June 2023.
AVG Days On the Market
Single-Family Homes
The average time spent on the market went up from 27 days last June 2022, to 31 days as of June 2023
Condos & Townhomes
The average time spent on the market went up from 21 days in June 2022, to 42 days as of June 2023
Overbids
Single-Family Homes
The overbid percentage has decreased from 100.9% last June 2022, to 100.5% a year later.
Condos & Townhomes
The overbid percentage has decreased from 101 8% last June 2022, to 100% a year later.
Jun2022 Jul2022Aug2022Sep2022Oct2022Nov2022Dec2022 Jan2023Feb2023Mar2023Apr2023May2023Jun2023 $750,000 $500,000 $250,000 $0 Jun2022 Jul2022Aug2022Sep2022Oct2022Nov2022Dec2022 Jan2023Feb2023Mar2023Apr2023May2023 Jun2023 75 50 25 0 Jun2022 Jul2022Aug2022Sep2022Oct2022Nov2022Dec2022 Jan2023Feb2023Mar2023Apr2023May2023 Jun2023 125% 100% 75% 50% 25% 0%
Back to Table of Contents

Sonoma County
What's in the Sonoma data?
In June, Sonoma had a total of 653 homes for sa providing the market with 2.2 months of invent
There were 283 new listings, 338 homes sold, a median sale price of $850k, with a median over 100.6%. The average time on the market was 38 days.
There were 50 condo and townhome units for s providing the market with 1.3 months of invent

There were 29 new listings for sale and 52 units
The median sale price was $482k, with a media overbid of 101.3%. The average time on the mar was 39 days.
The data, sourced from InfoSparks, includes all single-family homes, condos and townhomes in the California Area above from June 2022 to June 2023 This may include preliminary data, and may vary from the time the data was gathered All data is deemed reliable but not guaranteed. DRE# 01995149. Copyright KW Advisors San Francisco | Napa Valley 2023. Each office is independently owned and operated

29 New Listings 1.3 Months of Inventory $482K Median Sale Price 101.3% Median Sale vs List 39 Avg Days on Market 52 Sold Listings CONDO Condo & Townhomes
Single-Family Homes
Last 12 months, year-over-year.
Condos & Townhomes
Last 12 months, year-over-year.
Jun2022 Jul2022 Aug2022 Sep2022 Oct2022 Nov2022 Dec2022 Jan2023 Feb2023 Mar2023 Apr2023 May2023 Jun2023 2000 1500 1000 500 0 Jun2022 Jul2022 Aug2022 Sep2022 Oct2022 Nov2022 Dec2022 Jan2023 Feb2023 Mar2023 Apr2023 May2023 Jun2023 200 150 100 50 0 Sonoma
JUNE 2022 - JUNE 2023
LISTINGS FOR SALE SOLD LISTINGS
Median Sales Price
Single-Family Homes
The median sales price has increased from $849k last June 2022, to $850k as of June 2023
Condos & Townhomes
The median sales price has decreased from $505k last June 2022, to $482k as of June 2023.
AVG Days On the Market
Single-Family Homes
The average time spent on the market went up from 33 days last June 2022, to 38 days as of June 2023
Condos & Townhomes
The average time spent on the market went up from 27 days in June 2022, to 39 days as of June 2023
Overbids
Single-Family Homes
The overbid percentage has decreased from 101.4% last June 2022, to 100.6% a year later.
Condos & Townhomes
The overbid percentage has decreased from 102 1% last June 2022, to 101.3% a year later.
Jun2022 Jul2022Aug2022Sep2022Oct2022Nov2022Dec2022 Jan2023Feb2023Mar2023Apr2023May2023Jun2023 $1,000,000 $750,000 $500,000 $250,000 $0 Jun2022 Jul2022Aug2022Sep2022Oct2022Nov2022Dec2022 Jan2023Feb2023Mar2023Apr2023May2023 Jun2023 75 50 25 0 Jun2022 Jul2022Aug2022Sep2022Oct2022Nov2022Dec2022 Jan2023Feb2023Mar2023Apr2023May2023 Jun2023 125% 100% 75% 50% 25% 0%
Back to Table of Contents

Southern/ CentralMarin
What's in the Marin data?
In June, there were 191 single-family homes for sale, providing 1.3 months of inventory. 107 new listings and 190 homes were sold, with a median sale price of $1.7m and a median overbid percentage of 100.6%. There was an average of 31 days on the market.
There were 121 condo and townhome units for sale, providing 2.7 months of inventory with an average of 30 days on the market. With 53 new listings and 57 condos sold, there was a median sale price of $780k and a median overbid of 100%.

SFH Single-Family Homes
107 New Listings
190 Sold Listings
1.3 Months of Inventory
$1.7M Median Sale Price
100.6% Median Sale vs List
31 Avg Days on Market
The data, sourced from InfoSparks, includes all single-family homes, condos and townhomes in the California Area above from June 2022 to June 2023 This may include preliminary data, and may vary from the time the data was gathered All data is deemed reliable but not guaranteed. DRE# 01995149. Copyright KW Advisors San Francisco | Napa Valley 2023. Each office is independently owned and operated
53 New Listings
57 Sold Listings
2.7 Months of Inventory
$780K Median Sale Price

100% Median Sale vs List
30 Avg Days on Market
CONDO Condo & Townhomes
Single-Family Homes
Last 12 months, year-over-year.
Condos & Townhomes
Last 12 months, year-over-year.
Jun2022 Jul2022 Aug2022 Sep2022 Oct2022 Nov2022 Dec2022 Jan2023 Feb2023 Mar2023 Apr2023 May2023 Jun2023 800 600 400 200 0 Jun2022 Jul2022 Aug2022 Sep2022 Oct2022 Nov2022 Dec2022 Jan2023 Feb2023 Mar2023 Apr2023 May2023 Jun2023 250 200 150 100 50 0
JUNE 2022 - JUNE 2023
S/CMarin
LISTINGS FOR SALE SOLD LISTINGS
Median Sales Price
Single-Family Homes
The median sales price has decreased from $1 8m last June 2022, to $1 7m as of June 2023
Condos & Townhomes
The median sales price has increased from $762k last June 2022, to $780k as of June 2023.
AVG Days On the Market
Single-Family Homes
The average time spent on the market went up from 17 days last June 2022, to 31 days as of June 2023
Condos & Townhomes
The average time spent on the market went down from 35 days in June 2022, to 30 days as of June 2023
Overbids
Single-Family Homes
The overbid percentage has decreased from 105.9% last June 2022, to 100.6% a year later.
Condos & Townhomes
The overbid percentage has decreased from 102 6% last June 2022, to 100% a year later.
Jun2022 Jul2022Aug2022Sep2022Oct2022Nov2022Dec2022 Jan2023Feb2023Mar2023Apr2023May2023Jun2023 $2,000,000 $1,500,000 $1,000,000 $500,000 $0 Jun2022 Jul2022Aug2022Sep2022Oct2022Nov2022Dec2022 Jan2023Feb2023Mar2023Apr2023May2023 Jun2023 75 50 25 0 Jun2022 Jul2022Aug2022Sep2022Oct2022Nov2022Dec2022 Jan2023Feb2023Mar2023Apr2023May2023 Jun2023 125% 100% 75% 50% 25% 0%
Back to Table of Contents


: 1624 California Street, San Francisco CA 94109 2207 Lombard Street, San Francisco, CA 94123 SanFrancisco 1430 Howard Avenue, Burlingame, CA 94010 PeninsulaEstates 505 Hamilton Ave Suite #100, Palo Alto, CA 94301 PaloAlto 951 California Boulevard, Napa, CA 94559 NapaValley Click Here to Download PDF Robin Dixon DRE #02140393 robin.dixon@kw.com robindixon.kw.com
