


District 1 - Northwest
Sea Cliff, Lake Street, Richmond (Inner, Central, Outer), Jordan Park/Laurel Heights, Lone Mountain
Jump to District 1 - Northwest
2 - West
Sunset & Parkside (Inner, Central, Outer), Golden Gate Heights
Jump to District 2 - West
District 3 - Southwest
Lake Shore, Lakeside, Merced Manor, Merced Heights, Ingleside, Ingleside Heights, Oceanview
Jump to District 3 - Southwest
District 4 - Central SW
St. Francis Wood, Forest Hill, West Portal, Forest Knolls, Diamond Heights, Midtown Terrace, Miraloma Park, Sunnyside, Balboa Terrace, Ingleside Terrace, Mt Davidson Manor, Sherwood Forest, Monterey Heights, Westwood Highlands
Jump to District 4 - Central SW
District 5 - Central
Noe Valley, Eureka Valley/Dolores Heights (Castro, Liberty Hill), Cole Valley, Glen Park, Corona Heights, Clarendon Heights, Ashbury Heights, Buena Vista Park, Haight Ashbury, Duboce Triangle, Twin Peaks, Mission Dolores, Parnassus Heights
Jump to District 5 - Central

Hayes Valley, North of Panhandle (NOPA), Alamo Square, Western Addition, Anza Vista, Lower Pacific Heights
Jump to District 6 - Central North
Pacific Heights, Presidio Heights, Cow Hollow, Marina
Jump to District 7 - North
Russian Hill, Nob Hill, Telegraph Hill, North Beach, Financial District, North Waterfront, Downtown, Van Ness/Civic Center, Tenderloin
Jump to District 8 - Northeast
SoMa, South Beach, Mission Bay, Potrero Hill, Dogpatch, Bernal Heights, Inner Mission, Yerba Buena
Jump to District 9 - East
Bayview, Bayview Heights, Excelsior, Portola, Visitacion Valley, Silver Terrace, Mission Terrace, Crocker Amazon, Outer Mission
Jump to District 10 - Southeast
That's the question you should be asking yourself.
Our market is incredibly diverse and rapidly changing. Values vary not just by neighborhood but by street. Your home isn't necessarily worth what your neighbors' home is. It's the current market that sets the value of your home.
So, do you know what your home is worth in today's market?
Icanhelp...
Contact me for a confidential, no obligation assessment of your home's value.

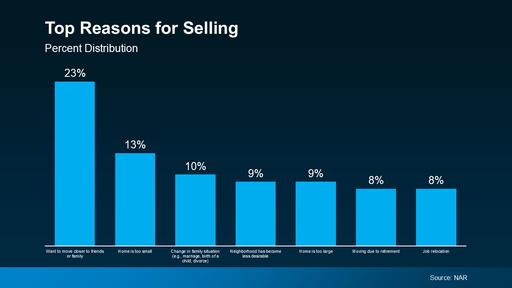
Are you on the fence about whether to sell your house now or hold off? It’s a common dilemma, but here’s a key point to consider: your lifestyle might be the biggest factor in your decision. While financial aspects are important, sometimes the personal motivations for moving are reason enough to make the leap sooner rather than later.
An annual report from the National Association of Realtors (NAR) offers insight into why homeowners like you chose to sell. All of the top reasons are related to life changes. As the graph below highlights:

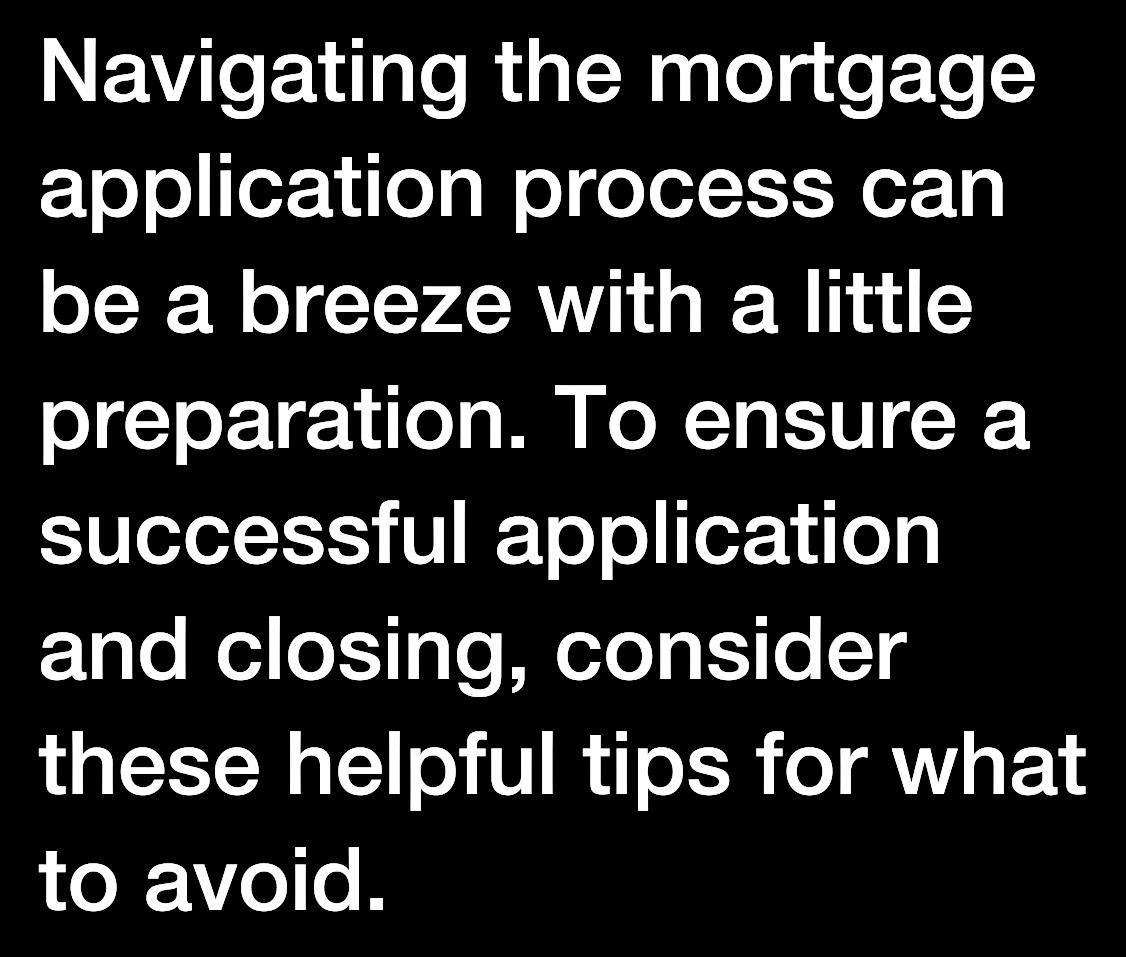


Avoid paying off debts or collections without professional advice.
Don't have your credit report pulled too many times - this can hurt your credit score. 3 4 5 6 1 2
Always consult your mortgage professional before making large financial moves. Use verified funds for deposits to prevent closing delays.

You can’t always see a breakdown coming, but you can plan for it with American Home Shield. Our home service plans help fix or replace covered home systems and appliances, and help you stay on budget. Protect what you don’t expect.

CLICK HERE TO WATCH THE VIDEO


These refreshing colors make the wash-and-dry chore a little more pleasant.
Tranquil Blue
View it here
View it here
View it here
View it here
View it here
View it here
View it here
View it here
Create a tranquil laundry space with Benjamin Moore's Beach Glass Its light blue shade, coupled with a subtle gray undertone, offers a clean and versatile aesthetic that avoids any baby nursery associations.
Transform your space with earthy tones like October Mist and Gloucester Sage from Benjamin Moore. Test out the trendy sage in your laundry room for a lowcommitment update easy to change and customize, ensuring lasting satisfaction with your design choice.
Create an elegant laundry room with Chantilly Lace by Benjamin Moore The classic white choice adds sophistication, opens up the space, and simplifies stain detection.
Elevate your laundry space with the energizing touch of yellow. Behr's Roasted Corn or Upbeat bring warmth and optimism, while Pearly White offers a mellow option a yellow-based white that brings a perfect harmony of vibrancy and calmness
Gray remains a top choice for laundry room walls, providing a timeless and serene backdrop A soft gray for a whisper of sophistication, easily personalized with printed patterned tile flooring or Behr's bold 2024 Color of the Year, Cracked Pepper.
Sherwin-Williams' Rosebud for a touch of romance in laundry rooms. The dusty pink hue, paired with gold accents, adds a luxurious and warm atmosphere
Navy as the key to a striking laundry room. Beyond lighter blues, navy paired with lighter accents or white fixtures, especially Benjamin Moore's Hale Navy, creates a bold choice that makes the laundry room stand out.
Dare to take a style risk in your laundry room with a pop of color Opt for the subtle smoky lavender of Farrow & Ball's Peignoir for a neutral touch or go all-out glam with Backdrop's dark and vampy McQueen, drawing inspiration from the famous fashion designer.
Source : https://www familyhandyman com/list/laundry-room-colors/


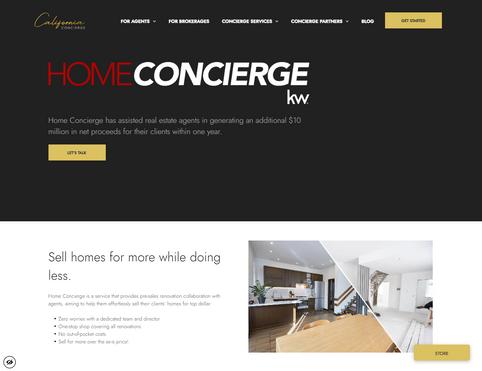
Adding an Accessory Dwelling Unit (ADU) boosts your property value and adds living space. Choose the right partner to ensure your project is smooth and successful.
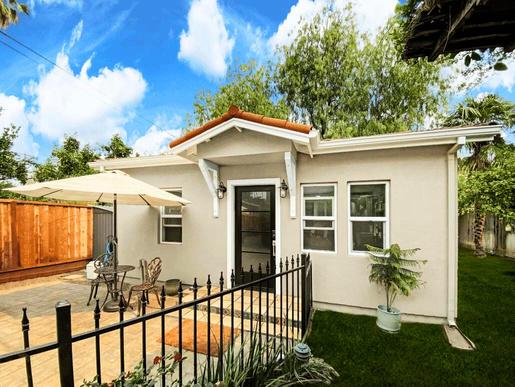

Building an ADU needs more than construction skills; it requires knowledge of local rules and design. Trust Acton ADU's expertise to avoid mistakes and ensure a seamless process.
Verify
Check that your contractor knows ADU design and local rules to avoid errors. Choose someone with a strong track record in ADU projects.
Conduct Thorough Site Assessments
Not every property suits ADUs. Use experts for site assessments to avoid costly mistakes.
Put Your Trust in The Right Company
Acton ADU has been successfully helping homeowners achieve their property goals for over 35 years. Making the wrong choice in the ADU market can lead to serious financial setbacks. ADUs aren't always ways, but Acton ADU can make it feel that way.

When it comes to home ownership, knowing who you can trust is crucial. That's why we've curated a select list of trusted vendors who are ready to help with your home goals.


Sea Cliff, Lake Street, Richmond (Inner, Central, Outer), Jordan Park/Laurel Heights, Lone Mountain
There were 20 single-family homes for sale, providing 1.2 months of inventory. There were 25 new listings, and 17 homes sold at a median price of $2.2m. The median overbid percentage was at 107 5%, with an average of 17 days on the market
There were 11 condo and townhome units for sale, providing 1.6 months of inventory. There were 7 new listings and 8 units sold at a median sale price of $805k. The median overbid percentage was at 97.6%, with an average of 53 days on the market.
25 New Listings
17 Sold Listings
1.2 Months of Inventory
$2.2M Median Sale Price
107.5%
Median Sale vs List
17 Avg Days on Market
The data, sourced from InfoSparks, includes all single-family homes, condos and townhomes in the California Area above from August 2023 to August 2024. This may include preliminary data, and may vary from the time the data was gathered. All data is deemed reliable but not guaranteed. DRE# 01995149. Copyright KW Advisors San Francisco | Napa Valley 2024. Each office is independently owned and operated.
AUGUST 2023 - AUGUST 2024
le-Family Homes 12 months, year-over-year.
dos & Townhomes 12 months, year-over-year
The median sale price has increased from $2m last August 2023, to $2 2m as of August 2024
Condos & Townhomes
The median sale price has decreased from $1 3m last August 2023, to $805k as of August 2024
The average time spent on the market went down from 45 days last August 2023, to 17 days as of August 2024
Condos & Townhomes
The average time spent on the market went up from 25 days in August 2023, to 53 days as of August 2024.
Single-Family Homes
The overbid percentage has increased from 101% last August 2023, to 107 5% a year later
Condos & Townhomes
The overbid percentage has decreased from 103.8% last August 2023, to 97.6% a year later.

Sunset & Parkside (Inner, Central, Outer), Golden Gate Heights
There were 26 single-family homes for sale, providing 0.8 months of inventory. There were 35 new listings, and 28 homes sold at a median price of $1.5m. The median overbid percentage was at 119%, with an average of 26 days on the market.
There were 10 condo and townhome units for sale, providing 4.6 months of inventory. There were 7 new listings and 1 unit sold at a median sale price of $1.2m. The median overbid percentage was at 106.3%, with an average of 3 days on the market.

35 New Listings
28 Sold Listings
0.8 Months of Inventory
$1.5M Median Sale Price
118.8%
Median Sale vs List
26 Avg Days on Market
The data, sourced from InfoSparks, includes all single-family homes, condos and townhomes in the California Area above from August 2023 to August 2024. This may include preliminary data, and may vary from the time the data was gathered. All data is deemed reliable but not guaranteed. DRE# 01995149. Copyright KW Advisors San Francisco | Napa Valley 2024. Each office is independently owned and operated.

AUGUST 2023 - AUGUST 2024
Single-Family Homes
The median sale price has decreased from $1 55m last August 2023, to $1 53m as of August 2024
Condos & Townhomes
The median sale price has increased from $900k last August 2023, to $1 2m as of August 2024
The average time spent on the market went down from 32 days last August 2023, to 26 days as of August 2024
Condos & Townhomes
The average time spent on the market went down from 59 days in August 2023, to 3 days as of August 2024.
Single-Family Homes
The overbid percentage has increased from 108% last August 2023, to 119% a year later
Condos & Townhomes
The overbid percentage has increased from 100% last August 2023, to 106.3% a year later.

Lake Shore, Lakeside, Mer Merced Heights, Ingleside Heights, Oceanview
There were 11 single-family h providing 0.8 months of inve new listings, and 6 homes so of $979k. The median overbi 103 3%, with an average of 4
There were 6 condo and tow providing 3 months of invent new listings and 0 units sold price of $0. The median over at 0%, with an average of 0 d
homes, condos and August 2024. This may was gathered. All data is Copyright KW Advisors San Francisco | Napa Valley 2024. Each office is independently owned and operated.
3
New Listings
3 Months of Inventory $0
Median Sale Price 0%
Median Sale vs List 0 Avg Days on Market 0 Sold Listings
AUGUST 2023 - AUGUST 2024
Family Homes months, year-over-year.
& Townhomes months, year-over-year
The median sale price has decreased from $1 2m last August 2023, to $979k as of August 2024
Condos & Townhomes
The median sale price has decreased from $1 4m last August 2023, to $0 as of August 2024
The average time spent on the market went up from 25 days last August 2023, to 44 days as of August 2024
The average time spent on the market went down from 16 days in August 2023, to 0 days as of August 2024.
Single-Family Homes
The overbid percentage has decreased from 108 4% last August 2023, to 103 3% a year later
Condos & Townhomes
The overbid percentage has decreased from 97.7% last August 2023, to 0% a year later.

St. Francis Wood, Forest Hill, West Portal, Forest Knolls, Diamond Heights, Midtown Terrace, Miraloma Park, Sunnyside, Balboa Terrace, Ingleside Terrace, Mt Davidson Manor, Sherwood Forest, Monterey Heights, Westwood Highlands
There were 27 single-family homes for sale, providing 1.1 months of inventory. There were 26 new listings, and 19 homes sold at a median price of $1.6m. The median overbid percentage was at 103.1%, with an average of 21 days on the market.
There were 10 condo and townhome units for sale, providing 2.4 months of inventory. There were 2 new listings and 2 units sold at a median sale price of $567k. The median overbid percentage was at 100.1%, with an average of 64 days on the market.

26 New Listings
19 Sold Listings
1.1 Months of Inventory
$1.6M Median Sale Price
103.1%
Median Sale vs List
21 Avg Days on Market
The data, sourced from InfoSparks, includes all single-family homes, condos and townhomes in the California Area above from August 2023 to August 2024. This may include preliminary data, and may vary from the time the data was gathered. All data is deemed reliable but not guaranteed. DRE# 01995149. Copyright KW Advisors San Francisco | Napa Valley 2024. Each office is independently owned and operated.
2
New Listings
2 Sold Listings
2.4
Months of Inventory
$567K
Median Sale Price
100.1%
Median Sale vs List
64 Avg Days on Market

AUGUST 2023 - AUGUST 2024
Single-Family Homes
Last 12 months, year-over-year.
Condos & Townhomes
Last 12 months, year-over-year
Single-Family Homes
The median sale price has decreased from $1 7m last August 2023, to $1 6m as of August 2024
Condos & Townhomes
The median sale price has increased from $535k last August 2023, to $567k as of August 2024
Single-Family Homes
The average time spent on the market went down from 30 days last August 2023, to 21 days as of August 2024
Condos & Townhomes
The average time spent on the market went up from 38 days in August 2023, to 64 days as of August 2024.
Single-Family Homes
The overbid percentage has increased from 101 8% last August 2023, to 103 1% a year later
Condos & Townhomes
The overbid percentage has increased from 99.3% last August 2023, to 100.1% a year later.
Noe Valley, Eureka Valley/Dolores Heights (Castro, Liberty Hill), Cole Valley, Glen Park, Corona Heights, Clarendon Heights, Ashbury Heights, Buena Vista Park, Haight Ashbury, Duboce Triangle, Twin Peaks, Mission Dolores, Parnassus Heights
There were 34 single-family homes for sale, providing 1.4 months of inventory. There were 24 new listings, and 13 homes sold at a median price of $2.6m. The median overbid percentage was at 100.4%, with an average of 23 days on the market.
There were 23 condo and townhome units for sale, providing 0.9 months of inventory. There were 24 new listings and 19 units sold at a median sale price of $1.3m. The median overbid percentage was at 103%, with an average of 36 days on the market.
24 New Listings
13 Sold Listings
1.4 Months of Inventory
$2.6M Median Sale Price
100.4%
Median Sale vs List
23 Avg Days on Market
The data, sourced from InfoSparks, includes all single-family homes, condos and townhomes in the California Area above from August 2023 to August 2024. This may include preliminary data, and may vary from the time the data was gathered. All data is deemed reliable but not guaranteed. DRE# 01995149. Copyright KW Advisors San Francisco | Napa Valley 2024. Each office is independently owned and operated.
24
New Listings
19
Sold Listings
0.9
Months of Inventory
103%
Median Sale vs List
$1.3M
Median Sale Price
36
Avg Days on Market

AUGUST 2023 - AUGUST 2024
Single-Family Homes
Last 12 months, year-over-year.
Condos & Townhomes
Last 12 months, year-over-year
The median sale price has increased from $2 2m last August 2023, to $2 6m as of August 2024
The median sale price has decreased from $1 4m last August 2023, to $1 3m as of August 2024
The average time spent on the market went down from 53 days last August 2023, to 23 days as of August 2024
The average time spent on the market went down from 45 days in August 2023, to 36 days as of August 2024.
The overbid percentage has increased from 100% last August 2023, to 100 4% a year later
The overbid percentage has increased from 98.7% last August 2023, to 103% a year later.
Hayes Valley, North Alamo Square, Wes Vista, Lower Pacific
There were 5 single-fa providing 1.8 months new listings, and 5 ho of $2.2m. The median 107 6%, with an avera There were 44 condo sale, providing 3.1 mo were 22 new listings a sale price of $949k. T percentage was at 10 days on the market.
2.2M an Sale Price Listings
s single-family homes, condos and 2023 to August 2024. This may the data was gathered. All data is 01995149. Copyright KW Advisors San Francisco | Napa Valley 2024. Each office is independently owned and operated.
2 Days on Market
22
New Listings
3.1
Sold Listings
Months of Inventory $949K
Median Sale Price 100%
Median Sale vs List 36 Avg Days on Market 11

AUGUST 2023 - AUGUST 2024
Family Homes
2 months, year-over-year.
s & Townhomes
2 months, year-over-year
The median sale price has decreased from $3 2m last August 2023, to $2 2m as of August 2024
Condos & Townhomes
The median sale price has decreased from $1 3m last August 2023, to $949k as of August 2024
The average time spent on the market went up from 41 days last August 2023, to 42 days as of August 2024
Condos & Townhomes
The average time spent on the market went down from 50 days in August 2023, to 36 days as of August 2024.
The overbid percentage has increased from 99 6% last August 2023, to 107 6% a year later
Condos & Townhomes
The overbid percentage has remained the same from 100% last August 2023, to 100% a year later.
Pacific Heights, Presidio Heights, Cow Hollow, Marina
There were 15 single-family homes for sale, providing 1.6 months of inventory. There we new listings, and 4 homes sold at a median p of $5.2m. The median overbid percentage w 98.2%, with an average of 202 days on the m
There were 48 condo and townhome units fo sale, providing 2.5 months of inventory. Ther were 25 new listings and 11 units sold at a m sale price of $1.8m. The median overbid percentage was at 100%, with an average of days on the market.

4 Sold Listings
sourced from InfoSparks, includes all single-family homes, condos and the California Area above from August 2023 to August 2024. This may minary data, and may vary from the time the data was gathered. All data is reliable but not guaranteed. DRE# 01995149. Copyright KW Advisors San Francisco | Napa Valley 2024. Each office is independently owned and operated. ngs
6 f Inventory
$5.2M Median Sale Price
.2% ale vs List
202 Avg Days on Market
Condo & Town
2.5 Months of Inventory $1. Median 100%
Median Sale vs List Avg Days So

AUGUST 2023 - AUGUST 2024
amily Homes months, year-over-year. & Townhomes months, year-over-year
Single-Family Homes
The median sale price has decreased from $5 4m last August 2023, to $5 2m as of August 2024
Condos & Townhomes
The median sale price has increased from $1 5m last August 2023, to $1 8m as of August 2024
Single-Family Homes
The average time spent on the market went up from 59 days last August 2023, to 202 days as of August 2024
Condos & Townhomes
The average time spent on the market went up from 44 days in August 2023, to 50 days as of August 2024.
Single-Family Homes
The overbid percentage has increased from 97 5% last August 2023, to 98 2% a year later
Condos & Townhomes
The overbid percentage has increased from 97.8% last August 2023, to 100% a year later.

Russian Hill, Beach, Finan Downtown, V Tenderloin
There were 3 s providing 1 mo listings, and 3 $3.9m. The me 97%, with an a
There were 11 sale, providing were 39 new li sale price of $ percentage wa days on the m

and may data is San
Condo & Town
Listings
3.4 Months of Inventory $83
99.1%
Median Sale vs List Avg Days
AUGUST 2023 - AUGUST 2024
amily Homes months, year-over-year. & Townhomes months, year-over-year
The median sale price has increased from $0 last August 2023, to $3 9m as of August 2024
Condos & Townhomes
The median sale price has decreased from $1m last August 2023, to $832k as of August 2024
The average time spent on the market went up from 0 days last August 2023, to 73 days as of August 2024
The average time spent on the market went up from 63 days in August 2023, to 66 days as of August 2024.
Single-Family Homes
The overbid percentage has increased from 0% last August 2023, to 97% a year later
Condos & Townhomes
The overbid percentage has decreased from 99.5% last August 2023, to 99.1% a year later.


19 Sold Listings
from InfoSparks, includes all single-family homes, condos and California Area above from August 2023 to August 2024. This may data, and may vary from the time the data was gathered. All data is but not guaranteed. DRE# 01995149. Copyright KW Advisors San Francisco | Napa Valley 2024. Each office is independently owned and operated. s ventory
$1.4M Median Sale Price
% vs List
23 Avg Days on Market
106
New Listings
59
Sold Listings
5.1
Months of Inventory
$1M
Median Sale Price 99%
Median Sale vs List
73 Avg Days on Market

AUGUST 2023 - AUGUST 2024
Single-Family Homes
Last 12 months, year-over-year.
Condos & Townhomes
Last 12 months, year-over-year
Single-Family Homes
The median sale price has decreased from $1 5m last August 2023, to $1 4m as of August 2024
Condos & Townhomes
The median sale price has increased from $845k last August 2023, to $1m as of August 2024
The average time spent on the market went down from 29 days last August 2023, to 23 days as of August 2024
Condos & Townhomes
The average time spent on the market went down from 74 days in August 2023, to 73 days as of August 2024.
Single-Family Homes
The overbid percentage has decreased from 104 6% last August 2023, to 104% a year later
Condos & Townhomes
The overbid percentage has decreased from 99.3% last August 2023, to 99% a year later.

Bayview, Bayview Heights, Excelsior, Portola, Visitacion Valley, Silver Terrace, Mission Terrace, Crocker Amazon, Outer Mission
There were 48 single-family homes for sale, providing 1.5 months of inventory. There were 40 new listings, and 39 homes sold at a median price of $1.1m. The median overbid percentage was at 114 6%, with an average of 30 days on the market
There were 41 condo and townhome units for sale, providing 6.5 months of inventory. There were 11 new listings and 6 units sold at a median sale price of $915k. The median overbid percentage was at 99.2%, with an average of 63 days on the market.
40 New Listings
39 Sold Listings
1.5 Months of Inventory
$1.1M Median Sale Price
114.6%
Median Sale vs List
30 Avg Days on Market
The data, sourced from InfoSparks, includes all single-family homes, condos and townhomes in the California Area above from August 2023 to August 2024. This may include preliminary data, and may vary from the time the data was gathered. All data is deemed reliable but not guaranteed. DRE# 01995149. Copyright KW Advisors San Francisco | Napa Valley 2024. Each office is independently owned and operated.
New Listings 6.5
Months of Inventory $915K
Median Sale Price 99.2%
Median Sale vs List 63 Avg Days on Market 6 Sold Listings

AUGUST 2023 - AUGUST 2024
Single-Family Homes
Last 12 months, year-over-year.
Condos & Townhomes
Last 12 months, year-over-year
Single-Family Homes
The median sale price has decreased from $1 14m last August 2023, to $1 13m as of August 2024
Condos & Townhomes
The median sale price has increased from $805k last August 2023, to $915k as of August 2024
The average time spent on the market went up from 28 days last August 2023, to 30 days as of August 2024
Condos & Townhomes
The average time spent on the market went down from 67 days in August 2023, to 63 days as of August 2024.
Single-Family Homes
The overbid percentage has increased from 109 7% last August 2023, to 114 6% a year later
Condos & Townhomes
The overbid percentage has decreased from 100% last August 2023, to 99.2% a year later.