


May 2023 Copyright by KW Advisors 2023
Fremont area
Milpitas
Jump to Milpitas Report
Fremont
Jump to Fremont City Report
Newark
Jump to Newark Report
Union City
Jump to Union City Report
Hayward
Jump to Hayward Report
Castro Valley
Jump to Castro Valley Report

San Leandro
Jump to San Leandro Report
Tri-Cities
(Fremont, Newark & Union City)
Jump to Tri-Cities Report
Pleasanton
Jump to Pleasanton Report
San Ramon
Jump to San Ramon Report
Livermore
Jump to Livermore Report
What’syourhomereally
That's really the question you should be asking yourself
Our market is incredibly diverse, and rapidly changing. Values vary not just by neighborhood, but by street. Your home isn't necessarily worth what your neighbors’ home is. At the end of the day, it’s the current market that sets the value of yo h
Contact me for a confidential, n assessment of your home's valu

Icanhelp...
So, do you know what your hom today's market? worthintoday’smarket?
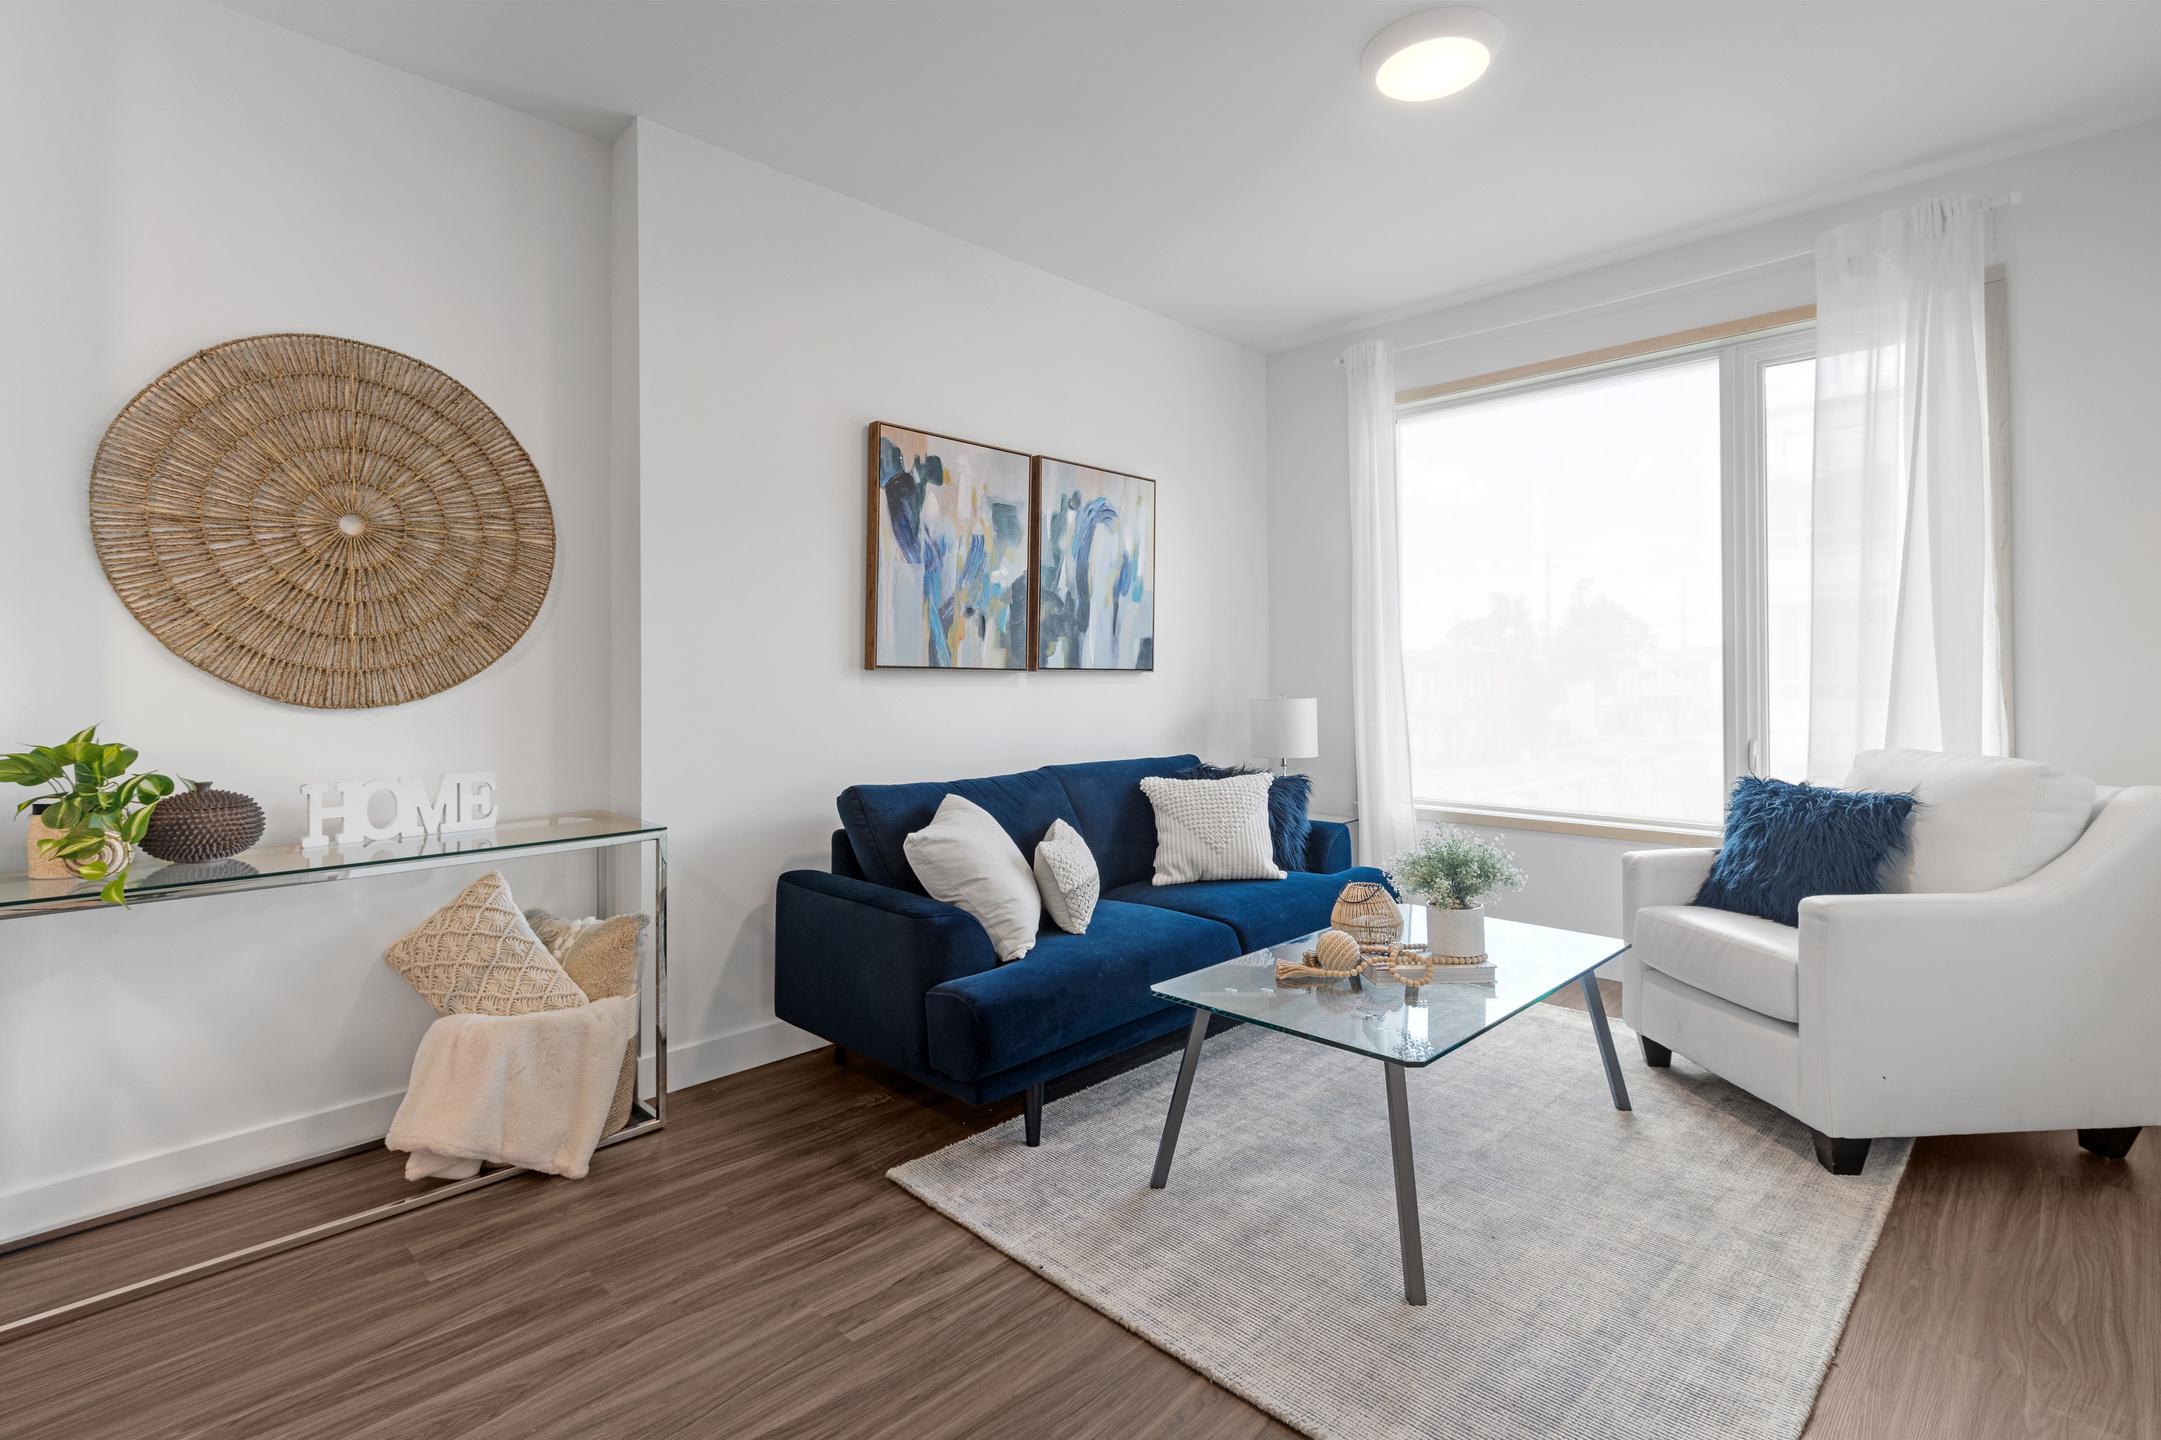
HowHomeownersWinWhen TheyDownsize
Downsizing has long been a popular option when homeowners reach retirement age. But there are plenty of other life changes that could make downsizing worthwhile. Homeowners who have experienced a change in their lives or no longer feel like their house fits their needs may benefit from downsizing too. U.S. News explains:
“Downsizing is somewhat common among older people and retirees who no longer have children living at home. But these days, younger people are also looking to downsize to save money on housing . . .”
And when inflation has made most things significantly more expensive, saving money where you can has a lot of appeal. So, if you’re thinking about ways to budget differently, it could be worthwhile to take your home into consideration.

Milpitas
What's in the Milpitas data?
In April, Milpitas had a total of 45 homes for sale, providing the market with only 1.7 months of inventory. There are 23 new listings and a total of 20 homes sold, with a median sale price of $1.4m. The median overbid was 102.4%, with an average of 11 days on the market.
There are currently 36 condo and townhome units for sale, providing the market with 3.4 months of inventory. There are 16 new listings this month and a total of 13 condos sold, with a median sale price of $976k. The median overbid was 103.9%, with an average of 21 days on the market.

SFH Single-Family Homes
23 New Listings
20 Sold Listings
1.7 Months of Inventory
$1.4M Median Sale Price
102.4% Median Sale vs List
11 Avg Days on Market
The data includes all single-family homes, townhome, and condominium sales in Milpitas, Fremont, Newark, Union City, Hayward, San Leandro, Tri-Cities, Pleasanton, San Ramon, Livermore, and Castro Valley sourced from Broker Metrics on May 3rd Data from sources deemed reliable may contain errors and be subject to revision. © 2023. All rights reserved. Each Office Is Independently Owned and Operated DRE# 01345026

New
of
21
CONDO Condo & Townhomes
16
Listings 3.4 Months
Inventory $976K Median Sale Price 103.9% Median Sale vs List
Avg Days on Market 13 Sold Listings
Single-Family
Last 12 months,
Condos
Last 12 months, year-over-year.
April2022 May2022 June2022 July2022August2022September2022October2022November2022December2022January2023February2023 March2023 April2023 100 75 50 25 0 April2022 May2022 June2022 July2022August2022September2022October2022November2022December2022January2023February2023 March2023 April2023 150 100 50 0 Milpitas APRIL 2022 - APRIL 2023
Homes
year-over-year.
&
Townhomes
LISTINGS FOR SALE SOLD LISTINGS
Median SalesPrice
Single-Family Homes
The median sales price has decreased from $1.6m in April 2022, to $1.4m as of April 2023
Condos & Townhomes
The median sales price has decreased from $1.2m in April 2022, to $976k as of April 2023.
AVGDays OntheMarket
Single-Family Homes
The average time spent on the market increased from 10 days in April 2022, to 11 days as of April 2023
Condos
The average time spent on the market increased from 8 days in April 2022, to 21 days as of April 2023.
Overbids
Single-Family Homes
The overbid percentage has decreased from 117.7% in April 2022, to 102.4% a year later.
Condos & Townhomes
The overbid percentage has decreased from 114 4% in April 2022, to 103 9% a year later.
April2022May2022June2022July2022August2022September2022October2022November2022December2022January2023February2023March2023April2023 $2,000,000 $1,500,000 $1,000,000 $500,000 $0 April2022May2022June2022 July2022August2022September2022October2022November2022December2022January2023February2023March2023April2023 60 40 20 0 April2022May2022June2022 July2022August2022September2022October2022November2022December2022January2023February2023March2023April2023 125% 100% 75% 50% 25% 0%
& Townhomes
Back to Table of Contents


48 Sold Listings
$1.4M Median Sale Price % st
13 Avg Days on Market
family homes, townhome, and condominium sales in Union City, Hayward, San Leandro, Tri-Cities, vermore, and Castro Valley sourced from Broker m sources deemed reliable may contain errors and be l rights reserved. Each Office Is Independently Owned 6
ry
Homes
mily
40 New Listings 1.2 Months of Inventory $702K Median Sale Price 101.1% Median Sale vs List 29 Avg Days on Market 32 Sold Listings CONDO Condo & Townhomes
Median SalesPrice
Single-Family Homes
The median sales price has decreased from $1.8m in April 2022, to $1.4m as of April 2023
Condos & Townhomes
The median sales price has decreased from $940k in April 2022, to $702k as of April 2023.
AVGDays OntheMarket
Single-Family Homes
The average time spent on the market increased from 9 days in April 2022, to 13 days in April 2023
Condos & Townhomes
The average time spent on the market increased from 11 days in April 2022, to 29 days in April 2023.
Overbids
Single-Family Homes
The overbid percentage has decreased from 115.2% in April 2022, to 104.8% a year later.
Condos & Townhomes
The overbid percentage has decreased from 111 1% in April 2022, to 101 1% a year later.
April2022May2022June2022July2022August2022September2022October2022November2022December2022January2023February2023March2023April2023 $2,000,000 $1,500,000 $1,000,000 $500,000 $0 April2022May2022June2022 July2022August2022September2022October2022November2022December2022January2023February2023March2023April2023 50 40 30 20 10 0 April2022May2022June2022 July2022August2022September2022October2022November2022December2022January2023February2023March2023April2023 125% 100% 75% 50% 25% 0%
Back to Table of Contents
Newark
What's in the Newark data?
In April, Newark had a total of 45 single-family homes for sale, providing the market with 0.9 months of inventory. There are 28 new listings and a total of 22 homes sold, with a median sale price of $1.2m. The median overbid was 104.7% with an average of 10 days on the market.
There are currently a total of 8 condo and townhome units for sale, providing the market with 0.6 months of inventory. There are 5 new listings for sale and a total of 4 condos sold, with a median sale price of $639k. The median overbid was 102.6%, with an average of 11 days on the market.

Hle-Family Homes
tings
9 of Inventory
22 Sold Listings
$1.2M Median Sale Price
4.7% Sale vs List
10 Avg Days on Market
cludes all single-family homes, townhome, and condominium sales in emont, Newark, Union City, Hayward, San Leandro, Tri-Cities, San Ramon, Livermore, and Castro Valley sourced from Broker May 3rd Data from sources deemed reliable may contain errors and be vision. © 2023. All rights reserved. Each Office Is Independently Owned ed DRE# 01345026
ctober2022November2022December2022January2023February2023 March2023 April2023 October2022November2022December2022January2023February2023 March2023 April2023 -year. -year. SOLD LISTINGS
Median SalesPrice
Single-Family Homes
The median sales price has decreased from $1.4m in April 2022, to $1.2m as of April 2023
Condos & Townhomes
The median sales price has decreased from $975k in April 2022, to $639k as of April 2023.
AVGDays OntheMarket
Single-Family Homes
The average time spent on the market decreased from 15 days in April 2022, to 10 days as of April 2023
Condos & Townhomes
The average time spent on the market decreased from 9 days in April 2022, to 11 days as of April 2023.
Overbids
Single-Family Homes
The overbid percentage has decreased from 115.5% in April 2022, to 104.7% a year later.
Condos & Townhomes
The overbid percentage has decreased from 114 8% in April 2022, to 102 6% a year later.
April2022May2022June2022July2022August2022September2022October2022November2022December2022January2023February2023March2023April2023 $2,000,000 $1,500,000 $1,000,000 $500,000 $0 April2022May2022June2022 July2022August2022September2022October2022November2022December2022January2023February2023March2023April2023 60 40 20 0 April2022May2022June2022 July2022August2022September2022October2022November2022December2022January2023February2023March2023April2023 125% 100% 75% 50% 25% 0%
Back to Table of Contents

Un
What data?
In April, providin inventor 20 home $1.2m. Th average There ar units for months added a price of 103.8%, w market.
12 New Listings 0.8 Months of Inventory $702K Median Sale Price 103.8% Median Sale vs List 11 Avg Days on Market 6 Sold Listings CONDO Condo & Townhomes
Median SalesPrice
Single-Family Homes
The median sales price has decreased from $1.5m in April 2022, to $1.2m as of April 2023
Condos & Townhomes
The median sales price has decreased from $846K in April 2022, to $702K as of April 2023.
AVGDays OntheMarket
Single-Family Homes
The average time spent on the market decreased from 14 days in April 2022, to 8 days as of April 2023
Condos & Townhomes
The average time spent on the market decreased from 21 days in April 2022, to 11 days as of April 2023.
Overbids
Single-Family Homes
The overbid percentage has decreased from 116% in April 2022, to 104.7% a year later.
Condos & Townhomes
The overbid percentage has decreased from 112 1% in April 2022, to 103 8% a year later.
April2022May2022June2022July2022August2022September2022October2022November2022December2022January2023February2023March2023April2023 $2,000,000 $1,500,000 $1,000,000 $500,000 $0 April2022May2022June2022 July2022August2022September2022October2022November2022December2022January2023February2023March2023April2023 75 50 25 0 April2022May2022June2022 July2022August2022September2022October2022November2022December2022January2023February2023March2023April2023 125% 100% 75% 50% 25% 0%
Back to Table of Contents
Hay
What's
In April, Hay
providing o are 67 new median sale overbid of 1 the market

There are c units for sal
There are 3 with a medi median ove spent on th
Condo

32 New Listings
1.2 Months of Inventory
100.2% Median Sale vs List
Last
Last 12 months, year-over-year.
April2022 May2022 June2022 July2022August2022September2022October2022November2022December2022January2023February2023 March2023 April2023 400 300 200 100 0 April2022 May2022 June2022 July2022August2022September2022October2022November2022December2022January2023February2023 March2023 April2023 150 100 50 0 Hayward APRIL 2022 - APRIL 2023 Single-Family Homes
12 months, year-over-year.
& Townhomes
Condos
LISTINGS FOR SALE SOLD LISTINGS
Median SalesPrice
Single-Family Homes
The median sales price has decreased from $1m in April 2022, to $835k as of April 2023
Condos & Townhomes
The median sales price has decreased from $702k in April 2022, to $635k as of April 2023.
AVGDays OntheMarket
Single-Family Homes
The average time spent on the market increased from 13 days in April 2022, to 19 days as of April 2023
Condos & Townhomes
The average time spent on the market increased from 15 days in April 2022, to 23 days as of April 2023.
Overbids
Single-Family Homes
The overbid percentage has decreased from 115.6% last April 2022, to 103.1% a year later.
Condos & Townhomes
The overbid percentage has decreased from 110 4% last April 2022, to 100 2% a year later.
April2022May2022June2022July2022August2022September2022October2022November2022December2022January2023February2023March2023April2023 $1,250,000 $1,000,000 $750,000 $500,000 $250,000 $0 April2022May2022June2022 July2022August2022September2022October2022November2022December2022January2023February2023March2023April2023 75 50 25 0 April2022May2022June2022 July2022August2022September2022October2022November2022December2022January2023February2023March2023April2023 125% 100% 75% 50% 25% 0%
Back to
of Contents
Table
4 New Listings

2 Sold Listings
0.7 Months of Inventory
Avg Days on Market
$812K Median Sale Price 106.6% Median Sale vs List
44
CONDO Condo & Townhomes
Single-Family
Last 12 months, year-over-year.
Condos & Townhomes
Last 12 months, year-over-year.
April2022 May2022 June2022 July2022August2022September2022October2022November2022December2022January2023February2023 March2023 April2023 200 150 100 50 0 April2022 May2022 June2022 July2022August2022September2022October2022November2022December2022January2023February2023 March2023 April2023 30 20 10 0 CastroValley APRIL 2022 - APRIL 2023
Homes
LISTINGS FOR SALE SOLD LISTINGS
Median SalesPrice
Single-Family Homes
The median sales price has decreased from $1.4m in April 2022, to $1.2m as of April 2023
Condos & Townhomes
The median sales price has increased from $794k in April 2022, to $812k as of April 2023.
AVGDays OntheMarket
Single-Family Homes
The average time spent on the market increased from 9 days in April 2022, to 22 days as of April 2023
Condos & Townhomes
The average time spent on the market increased from 16 days in April 2022, to 44 days as of April 2023.
Overbids
Single-Family Homes
The overbid percentage has decreased from 117.6% in April 2022, to 102.9% a year later.
Condos & Townhomes
The overbid percentage has increased from 106 1% in April 2022, to 106 6% a year later.
April2022May2022June2022July2022August2022September2022October2022November2022December2022January2023February2023March2023April2023 $1,500,000 $1,000,000 $500,000 $0 April2022May2022June2022 July2022August2022September2022October2022November2022December2022January2023February2023March2023April2023 125 100 75 50 25 0 April2022May2022June2022 July2022August2022September2022October2022November2022December2022January2023February2023March2023April2023 125% 100% 75% 50% 25% 0%
Back
of
to Table
Contents

New
Months of Inventory $440K Median Sale Price 101.7% Median Sale vs List 23 Avg Days on Market
Sold
CONDO Condo & Townhomes
16
Listings 1.6
7
Listings
Median SalesPrice
Single-Family Homes
The median sales price has decreased from $1m in April 2022, to $834k as of April 2023
Condos & Townhomes
The median sales price has decreased from $627k in April 2022, to $440k as of April 2023.
AVGDays OntheMarket
Single-Family Homes
The average time spent on the market increased from 9 days in April 2022, to 25 days as of April 2023
Condos & Townhomes
The average time spent on the market increased from 13 days in April 2022, to 23 days as of April 2023.
Overbids
Single-Family Homes
The overbid percentage has decreased from 118.6% in April 2022, to 102.9% a year later.
Condos & Townhomes
The overbid percentage has decreased from 105 1% in April 2022, to 101 7% a year later.
April2022May2022June2022July2022August2022September2022October2022November2022December2022January2023February2023March2023April2023 $1,250,000 $1,000,000 $750,000 $500,000 $250,000 $0 April2022May2022June2022 July2022August2022September2022October2022November2022December2022January2023February2023March2023April2023 60 40 20 0 April2022May2022June2022 July2022August2022September2022October2022November2022December2022January2023February2023March2023April2023 125% 100% 75% 50% 25% 0%
Back to Table of Contents
Tri-Cities
Fremont,Newark&UnionCity
What's in the Tri-Cities data?
In April, the Tri-Cities area had 212 homes for sale, providing 0.7 months of inventory. There are 135 new listings and 90 homes sold; with a median sale price of $1.3m, and a median overbid of 104.7%. The average time spent on the market for homes is currently 11 days.
There are currently 129 condo and townhome units for sale with 1.1 months of inventory. There are 57 new listings and 42 condos sold during that month; with a median sale price of $690k, and a median overbid of 101.6%. The average time spent on the market is currently 25 days.

SFH Single-Family Homes
135 New Listings
90 Sold Listings
0.7 Months of Inventory
$1.3M Median Sale Price
104.7% Median Sale vs List
11 Avg Days on Market
The data includes all single-family homes, townhome, and condominium sales in Milpitas, Fremont, Newark, Union City, Hayward, San Leandro, Tri-Cities, Pleasanton, San Ramon, Livermore, and Castro Valley sourced from Broker Metrics on May 3rd Data from sources deemed reliable may contain errors and be subject to revision. © 2023. All rights reserved. Each Office Is Independently Owned and Operated DRE# 01345026

New Listings 1.1 Months of Inventory $690K Median Sale Price 101.6% Median Sale vs List 25 Avg Days on Market 42 Sold Listings CONDO Condo & Townhomes
57
Last
Condos
Last 12 months, year-over-year.
April2022 May2022 June2022 July2022August2022September2022October2022November2022December2022January2023February2023 March2023 April2023 750 500 250 0 April2022 May2022 June2022 July2022August2022September2022October2022November2022December2022January2023February2023 March2023 April2023 400 300 200 100 0 Tri-Cities APRIL 2022 - APRIL 2023
Homes
Single-Family
12
year-over-year.
months,
& Townhomes
LISTINGS FOR SALE SOLD LISTINGS
Median SalesPrice
Single-Family Homes
The median sales price has decreased from $1.7m in April 2022, to $1.3m as of April 2023
Condos &
The median sales price has decreased from $933k in April 2022, to $690k as of April 2023.
AVGDays OntheMarket
Single-Family
The average remained at 11 days from April 2022 to April 2023
Condos
The average time spent on the market increased from 12 days in April 2022, to 25 days as of April 2023.
Overbids
Single-Family Homes
The overbid percentage has decreased from 115.4% in April 2022, to 104.7% a year later.
Condos & Townhomes
The overbid percentage has decreased from 111 9% in April 2022, to 101 6% a year later.
April2022May2022June2022July2022August2022September2022October2022November2022December2022January2023February2023March2023April2023 $2,000,000 $1,500,000 $1,000,000 $500,000 $0 April2022May2022June2022 July2022August2022September2022October2022November2022December2022January2023February2023March2023April2023 50 40 30 20 10 0 April2022May2022June2022 July2022August2022September2022October2022November2022December2022January2023February2023March2023April2023 125% 100% 75% 50% 25% 0%
Townhomes
Townhomes
&
Homes
Back to Table of Contents

14 New Listings

7 Sold Listings
0.6 Months of Inventory
$715K Median Sale Price
103.3% Median Sale vs List
28 Avg Days on Market
CONDO Condo & Townhomes
, y y
Median SalesPrice
Single-Family Homes
The median sales price has decreased from $2m in April 2022, to $1.7m as of April 2023
Condos &
The median sales price has decreased from $850k in April 2022, to $715k as of April 2023.
AVGDays OntheMarket
Single-Family Homes
The average time spent on the market increased from 9 days in April 2022, to 13 days as of April 2023
Condos & Townhomes
The average time spent on the market increased from 7 days in April 2022, to 28 days as of April 2023.
Overbids
Single-Family Homes
The overbid percentage has decreased from 116.4% in April 2022, to 102.7% a year later.
Condos & Townhomes
The overbid percentage has decreased from 107 5% in April 2022, to 103 3% a year later.
April2022May2022June2022July2022August2022September2022October2022November2022December2022January2023February2023March2023April2023 $2,500,000 $2,000,000 $1,500,000 $1,000,000 $500,000 $0 April2022May2022June2022 July2022August2022September2022October2022November2022December2022January2023February2023March2023April2023 50 40 30 20 10 0 April2022May2022June2022 July2022August2022September2022October2022November2022December2022January2023February2023March2023April2023 125% 100% 75% 50% 25% 0%
Townhomes
Back to Table of Contents
SanRa
What's in the data?
San Ramon had 68 s sale, providing the m inventory. There are homes were sold wit $1.7m. The median ov average of 18 days o There are currently 3 units for sale, provid months of inventory. for sale, and 15 cond median sale price of overbid was 101.7%, a the market was 10 da

es
5 Listings

1.7M an Sale Price
8 ays on Market
me, and condominium sales in d, San Leandro, Tri-Cities, Valley sourced from Broker ble may contain errors and be Office Is Independently Owned

16 New Listings 1.2 Months of Inventory $920K Median Sale Price 101.7% Median Sale vs List 10 Avg Days on Market 15 Sold Listings CONDO Condo & Townhomes
Last
Last 12 months, year-over-year.
April2022 May2022 June2022 July2022August2022September2022October2022November2022December2022January2023February2023 March2023 April2023 250 200 150 100 50 0 April2022 May2022 June2022 July2022August2022September2022October2022November2022December2022January2023February2023 March2023 April2023 125 100 75 50 25 0 SanRamon APRIL 2022 - APRIL 2023
Homes
Single-Family
year-over-year.
& Townhomes
12 months,
Condos
LISTINGS FOR SALE SOLD LISTINGS
Median SalesPrice
Single-Family Homes
The median sales price has decreased from $2m in April 2022, to $1.7m as of April 2023
Condos & Townhomes
The median sales price has increased from $837k in April 2022, to $920k as of April 2023.
AVGDays OntheMarket
Single-Family Homes
The average time spent on the market increased from 7 days last April 2022, to 18 days as of April 2023
Condos & Townhomes
The average time spent on the market decreased from 7 days in April 2022, to 10 days as of April 2023.
Overbids
Single-Family Homes
The overbid percentage has decreased from 116.5% in April 2022, to 102.6% a year later.
Condos & Townhomes
The overbid percentage has decreased from 110 1% in April 2022, to 101 7% a year later.
April2022May2022June2022July2022August2022September2022October2022November2022December2022January2023February2023March2023April2023 $2,500,000 $2,000,000 $1,500,000 $1,000,000 $500,000 $0 April2022May2022June2022 July2022August2022September2022October2022November2022December2022January2023February2023March2023April2023 75 50 25 0 April2022May2022June2022 July2022August2022September2022October2022November2022December2022January2023February2023March2023April2023 125% 100% 75% 50% 25% 0%
Back to Table of Contents
Liv
What' Livermor homes fo inventory homes so and a me time spen
As for co currently inventory condos s was $690 and the a currently

m sales in Tri-Cities, m Broker ors and be tly Owned ket

New
Months of Inventory $690K Median Sale Price 102.1% Median Sale vs List 10 Avg Days on Market
Sold
CONDO Condo & Townhomes
9
Listings 0.5
17
Listings
Single-Family
Last
Condos
Last 12 months, year-over-year.
April2022 May2022 June2022 July2022August2022September2022October2022November2022December2022January2023February2023 March2023 April2023 400 300 200 100 0 April2022 May2022 June2022 July2022August2022September2022October2022November2022December2022January2023February2023 March2023 April2023 80 60 40 20 0 Livermore APRIL 2022 - APRIL 2023
Homes
year-over-year.
12 months,
& Townhomes
LISTINGS FOR SALE SOLD LISTINGS
Median SalesPrice
Single-Family Homes
The median sales price has decreased from $1.3m in April 2022, to $1.2m as of April 2023
Condos & Townhomes
The median sales price has decreased from $894k in April 2022, to $690k as of April 2023.
AVGDays OntheMarket
Single-Family Homes
The average time spent on the market increased from 8 days in April 2022, to 15 days as of April 2023
Condos & Townhomes
The average remained at 10 days from April 2022 to April 2023.
Overbids
Single-Family Homes
The overbid percentage has decreased from 113.7% in April 2022, to 102.4% a year later.
Condos & Townhomes
The overbid percentage has decreased from 108 1% in April 2022, to 102 1% a year later.
April2022May2022June2022July2022August2022September2022October2022November2022December2022January2023February2023March2023April2023 $1,500,000 $1,000,000 $500,000 $0 April2022May2022June2022 July2022August2022September2022October2022November2022December2022January2023February2023March2023April2023 60 40 20 0 April2022May2022June2022 July2022August2022September2022October2022November2022December2022January2023February2023March2023April2023 125% 100% 75% 50% 25% 0%
Back to Table of Contents


39465 Paseo Padre Parkway #1500 Fremont CA 94538 KellerWilliamsFremont : DRE#:02190593 (571) 426-9174 homesbyshiba@gmail.com www.homesbyshiba.com
