2 minute read
Tab. 2: Light distribution in the chambers


Tab. 2: Light distribution in the chambers.
HPS (µmol/m2/s) LED (µmol/m2/s)
repetition door middle glas average door middle glas average
1 244 290 310 281 274 291 257 280
2 3 4
272 276 291 280 276 295 270 281 282 295 292 290 275 298 267 279 270 274 257 267 274 290 272 280
5
262 281 276 273 278 292 273 280 6 273 286 250 270 279 294 266 274
average 267 284 279 277 276 293 268 279
In addition, six flowering lamps (Philips GreenPower, deep red / white / far red) were set up in the LED chamber in the same hight as the LED lights. When 1,5-2 leaves were visible, it was started to turn on the flowering lamps during the time, when the LED lights were turned off. The desired growth was one cm/day. Because this value was not reached, the flowering lamps were turned on for 24 hours. The flowering lamps were turned off when leaves were 18-20 cm. However, the growth was then less than 1,0-1,5 cm / day and clusters were short, and therefore, the flowering lamps were turned on again until the beginning of the harvest.
3.3 Measurements, sampling and analyses
Soil temperature and leaf temperature was measured once a week. The amount of fertilization water (input and runoff) was measured every day.
To be able to determine plant development, the number of leaves, the number of clusters and the number of open flowers was counted each week. This gave information regarding the total amount of flowers per plant and the number of flowers per cluster.
During the growth period were runners regularly taken away and the number per plant was registered. During the harvest period were berries regularly collected (2 times per week) in the subplots. Total fresh yield, number of fruits, fruit category (extra-class (> 25 mm), 1. class (18 mm) and not marketable fruits (too little fruits (< 18 mm), damaged fruits, misshaped fruits, moldy fruits) were determined. At the
end of the harvest period was on each plant the number of immature fruits (green) counted. The marketable yield of the whole chamber was also measured.
In the LED chamber were LED glasses used for picking to be able to distinguish if berries were ripe or not.
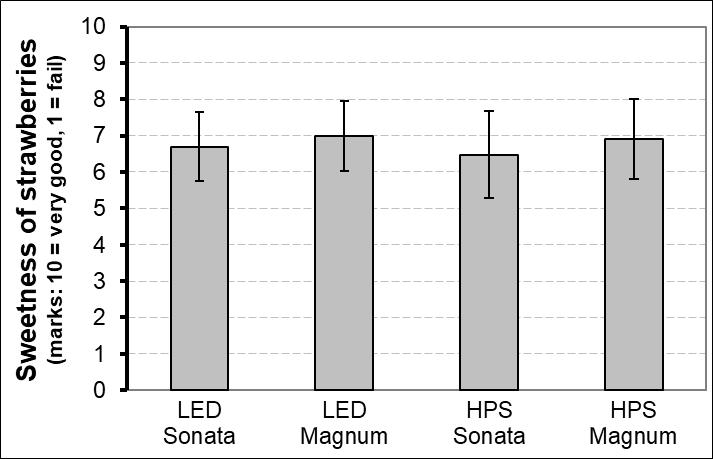
The interior quality of the berries was determined. A brix meter (Pocket Refractometer PAL-1, ATAGO, Tokyo, Japan) was used to measure sugar content of the strawberries during the growth period. From the same harvest, the flavour of fresh fruits was examined in a tasting experiment with untrained assessors. Also, subsamples of the fruits were dried at 105 °C for 24 h to measure dry matter yield.
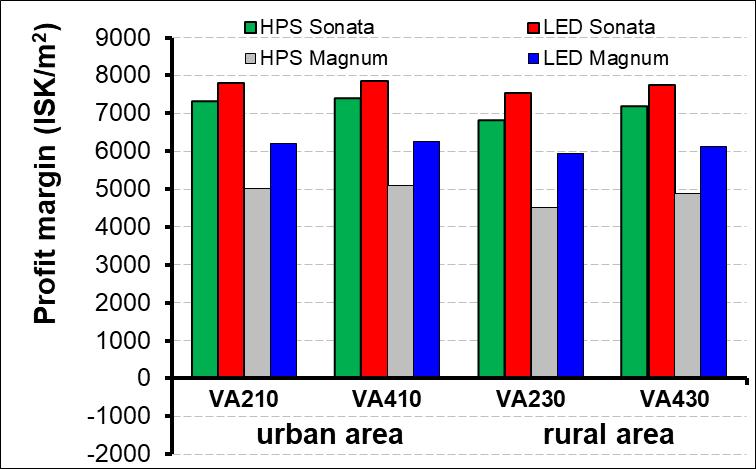
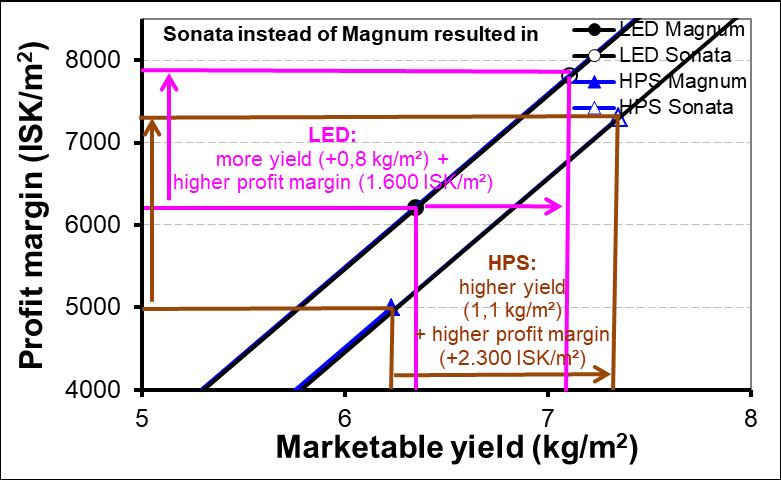
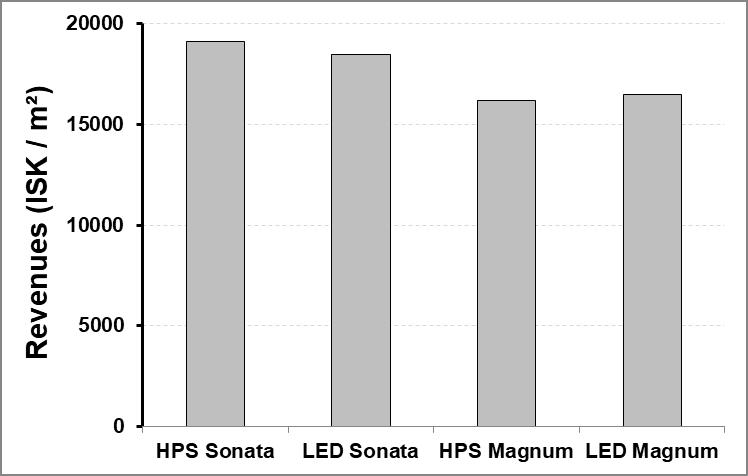
Energy use efficiency (total cumulative yield in weight per kWh) and costs for lighting per kg yield were calculated for economic evaluation and the profit margin was determined.
3.4 Statistical analyses
SAS Version 9.4 was used for statistical evaluations. The results were subjected to one-way analyses of variance with the significance of the means tested with a Tukey/Kramer HSD-test at p ≤ 0,05.