2 minute read
Great Black-backed Gull
Great Black-backed Gull
Larus marinus Svartbakur
Great Black-backed Gulls were present in the survey area in almost all surveys, from the first one on 12th March until the final one on 25th October. Highest numbers were 20-27 birds in spring, and 31-33 in autumn. Adults were present on a small island in the middle of Ásgarđshöfđi (Est 4), between 12th March and 18th September, and there were approximately 5 to 10 nests in May and June. At least two pairs reproduced successfully, as two broods of two large chicks were observed on 7th August. However, this must be considered a minimum, as the colony was not visited and observations were made from 1.5 to 2 km away. Due to the undulating topography of the island, and the cryptic nature of juvenile gull plumage, it is likely that other chicks were present and were not detected. There were an estimated 12-14 nests on Lake Vatnshamravatn, and chicks were observed on 9th July, but no concerted effort was made to accurately survey this colony. Throughout the survey period, the southernmost four subsites: Flæðhöfðasker (Est 6), Grjóteyrarklakkur (Est 1), Kistufjörđur (Est 2) and Kistuhöfðahólmar (Est 3) were mostly used for foraging during low tides and for both roosting and foraging during rising tides.
Low-tide Rising-tide
Number of individuals 35 30 25 20 15 10 5 0
10 11 12 13 14 15 16 17 18 19 20 21 22 23 24 25 26 27 28 29 30 31 32 33 34 35 36 37 38 39 40 41 42 43 Mar Apr May Jun Jul Aug Sep Oct Week number and month
Figure 3-111. Number of Larus marinus recorded during weekly low tide and rising tide estuarine surveys in the Andakíll Ramsar site between 12th March and 25th October 2017.
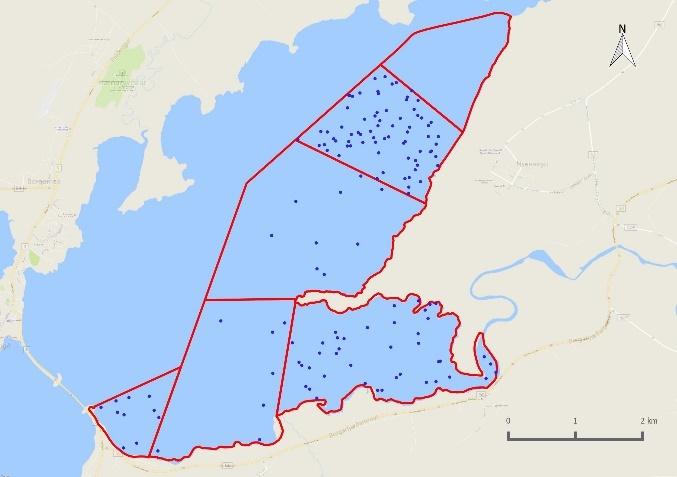
Figure 3-112. Relative abundance of Larus marinus during weekly (a) low tide and (b) rising tide estuarine surveys in the Andakíll Ramsar site between 12th March and 25th October 2017. Dots are randomly positioned within each subsite. While each dot refers to a single bird, it refers to the bird’s presence in that subsite only, and not the bird’s actual location.
(a) Low tide (b) Rising tide


(a) Spring (b) Autumn

Figure 3-113. Relative abundance during (a) spring and (b) autumn of Larus marinus counted on twiceweekly estuarine surveys in the Andakíll Ramsar site in 2017. Spring = 12th March - 7th June; Autumn = 12
th June - 25th
October. The number of dots in each subsite refers to the total number of bird-records (from weekly low tide and rising tide surveys) in spring and autumn, adjusted for the length of the season, and reflects the species’ abundance in that season, not the specific location of birds.
Figure 3-114. Proportion of foraging and roosting Larus marinus during weekly (a) low tide and (b) rising tide estuarine surveys in six subsites in the Andakíll Ramsar site between 12th March and 25th October 2017.

(a) Low tide (b) Rising tide


