City Policy and Planning Seminar


 Shravan Joshi MBE Chairman, Planning & Transportation Committee, City of London Corporation
 Rob McNicol Assistant Director (Policy & Strategy), City of London Corporation

The City Corporation’s vision for how the Square Mile will develop up to 2040
A spatial strategy – how will different parts of the City grow, particularly Key Areas of Change
A suite of policies to ensure new schemes promote environmental, economic and social pillars of sustainable development
Oct 2023
• Draft City Plan to Planning & Transportation Committee
June 2024
• Submit City Plan to Secretary of State
July 2025
Adopt City Plan 2040

Dec 2023
• Start formal ‘regulation 19’ public consultation
September 2024
• Public examination hearings

Environmental objective
Sustainable development

Social objective
Economic objective

• The boundary for the Square Mile’s emissions includes emissions from the built environment, transport and other sources such aswaste.
• Weneed toreduce or remove 1,010kt of carbonemissions to achieve net zero. This includes 100% of scopes 1, 2&3(BASIC+ definition).
2040 Emphasis on ‘retrofit first’
Refurbishment case studies and guidance
Whole Lifecycle Carbon Optioneering PAN
Circular economy design approaches
Historic buildings sustainability challenge
Climate resilience
Local Area Energy Plan
Sustainable City planning guidance

Value chain emissions –particularly embodied carbon
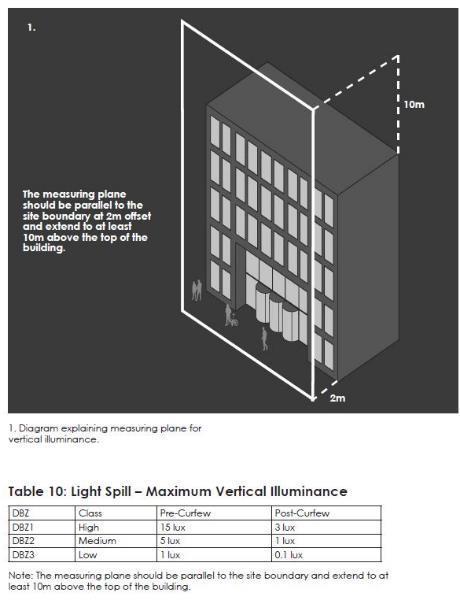
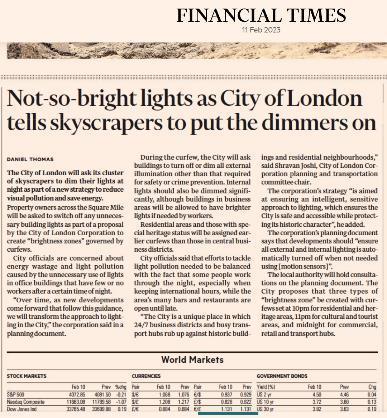
Lighting SPD
Maintain importance of the business City
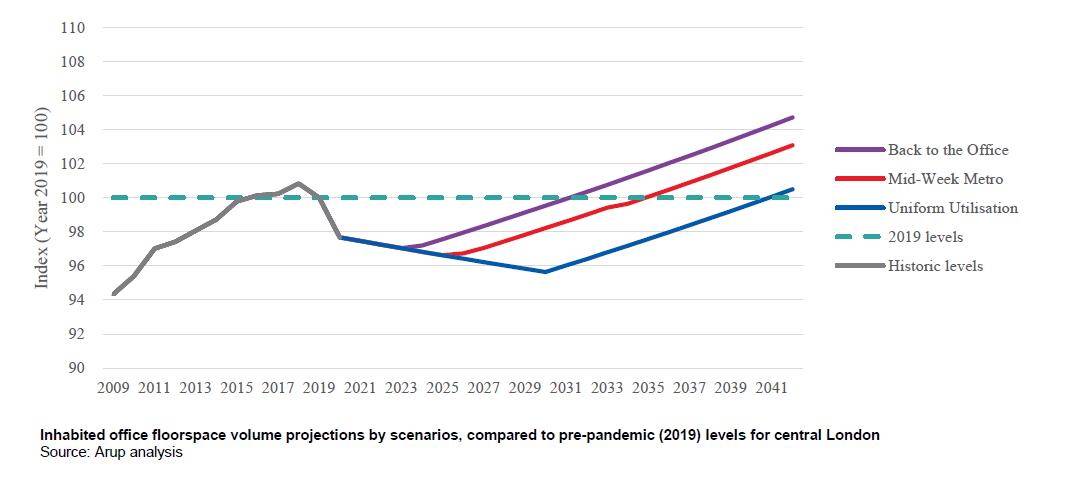
Future office demand research
Office floorspace projections
Occupier strategy
Support for ‘ground floor economy’
Hotel demand evidence research
Tall buildings locations
Flagship strategy to bring about an enduring transformation of the Square Mile

Make the City a leading destination for UK and international visitors and a place where more and more people want to come to work

‘Destination City’ policy
Other workstreams
Refresh spatial vision and Key Areas of Change
Occupier strategy
Cultural infrastructure
Sports strategy
SCI & developer
engagement guidance
Samantha Tharme, Head of Strategic Transport, City of London Corporation

25 year strategy, adopted May 2019.
Sets out how the City Corporation proposes to design and manage the City’s streets to ensure the Square Mile remains a great place to live, work, study and visit.
Accompanying 3-year delivery plan, updated annually. Forms part of our Local Implementation Plan (LIP).
Streets that inspire and delight, world-class connections and a Square Mile that is accessible to all.
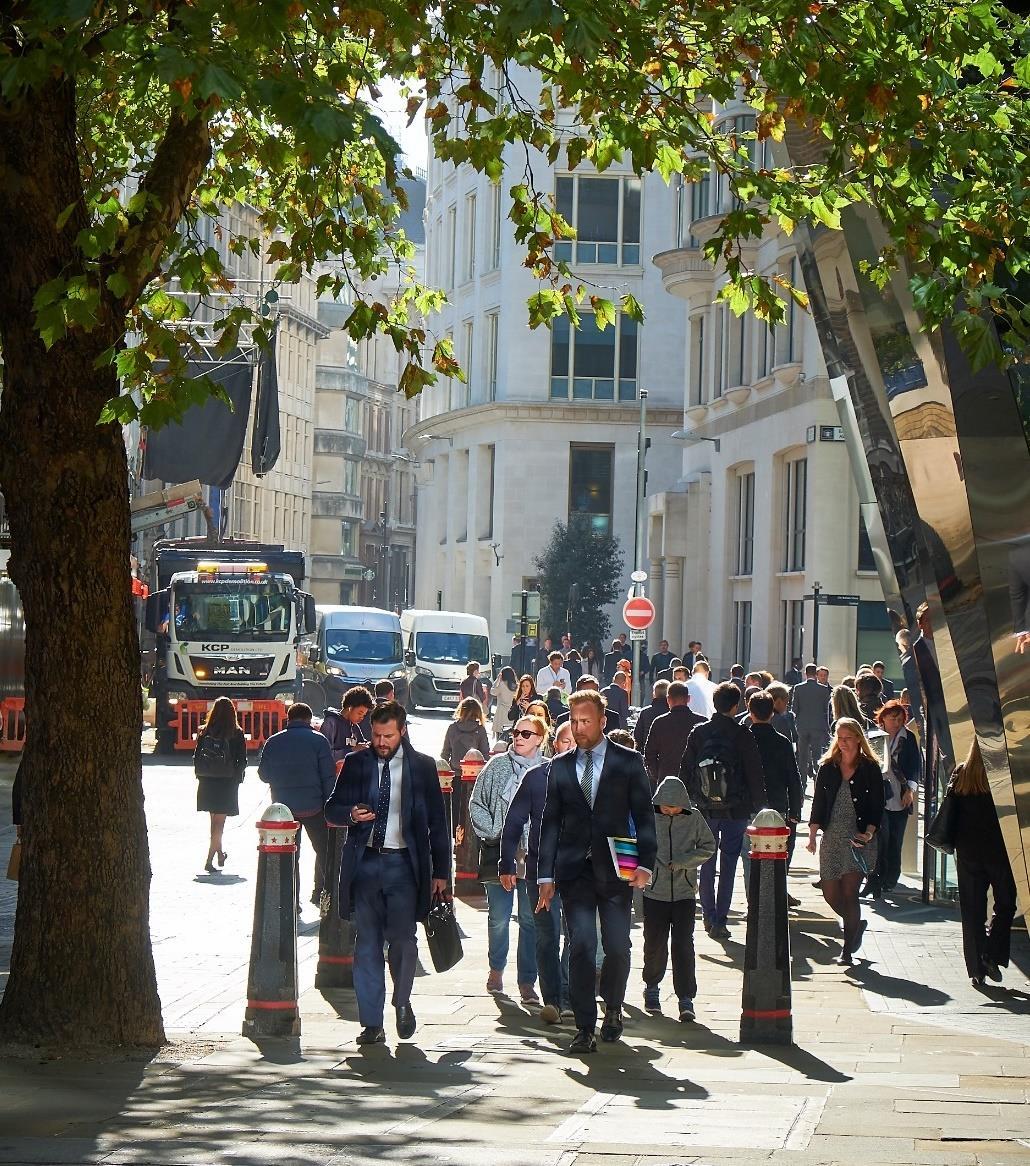
The vision for the Transport Strategy recognises that our streets are an important element of the City’s offer and experience.
A great place to walk
More efficient use of street space
Every street accessible to all
Safe streets (Vision Zero)
More people choose to cycle
Cleaner air and quieter streets
More efficient freight and servicing Resilient streets
Better transport connections
Innovation benefits the Square Mile
Data from other relevant surveys and reviews
Meetings and workshops
Online survey
Focus groups
Phase 1 – check outcomes & objectives still relevant
Phase 2 – review and refresh proposals

In late 2020 we asked WSP to assess the effects of Covid-19 on the City’s built environment and to consider whether a change in the strategic approach to transport was required. The report concludedthat:
“The existing strategic position and desired outcomes … remain relevant in a postpandemic context. The overarchingapproach to reducingprivatemotorised transport and increasing the prominence of street space for people to walk and cyclecontinues to hold true

Our plans for climateaction and post-Covid recovery call for an acceleration of the delivery of the Transport Strategy


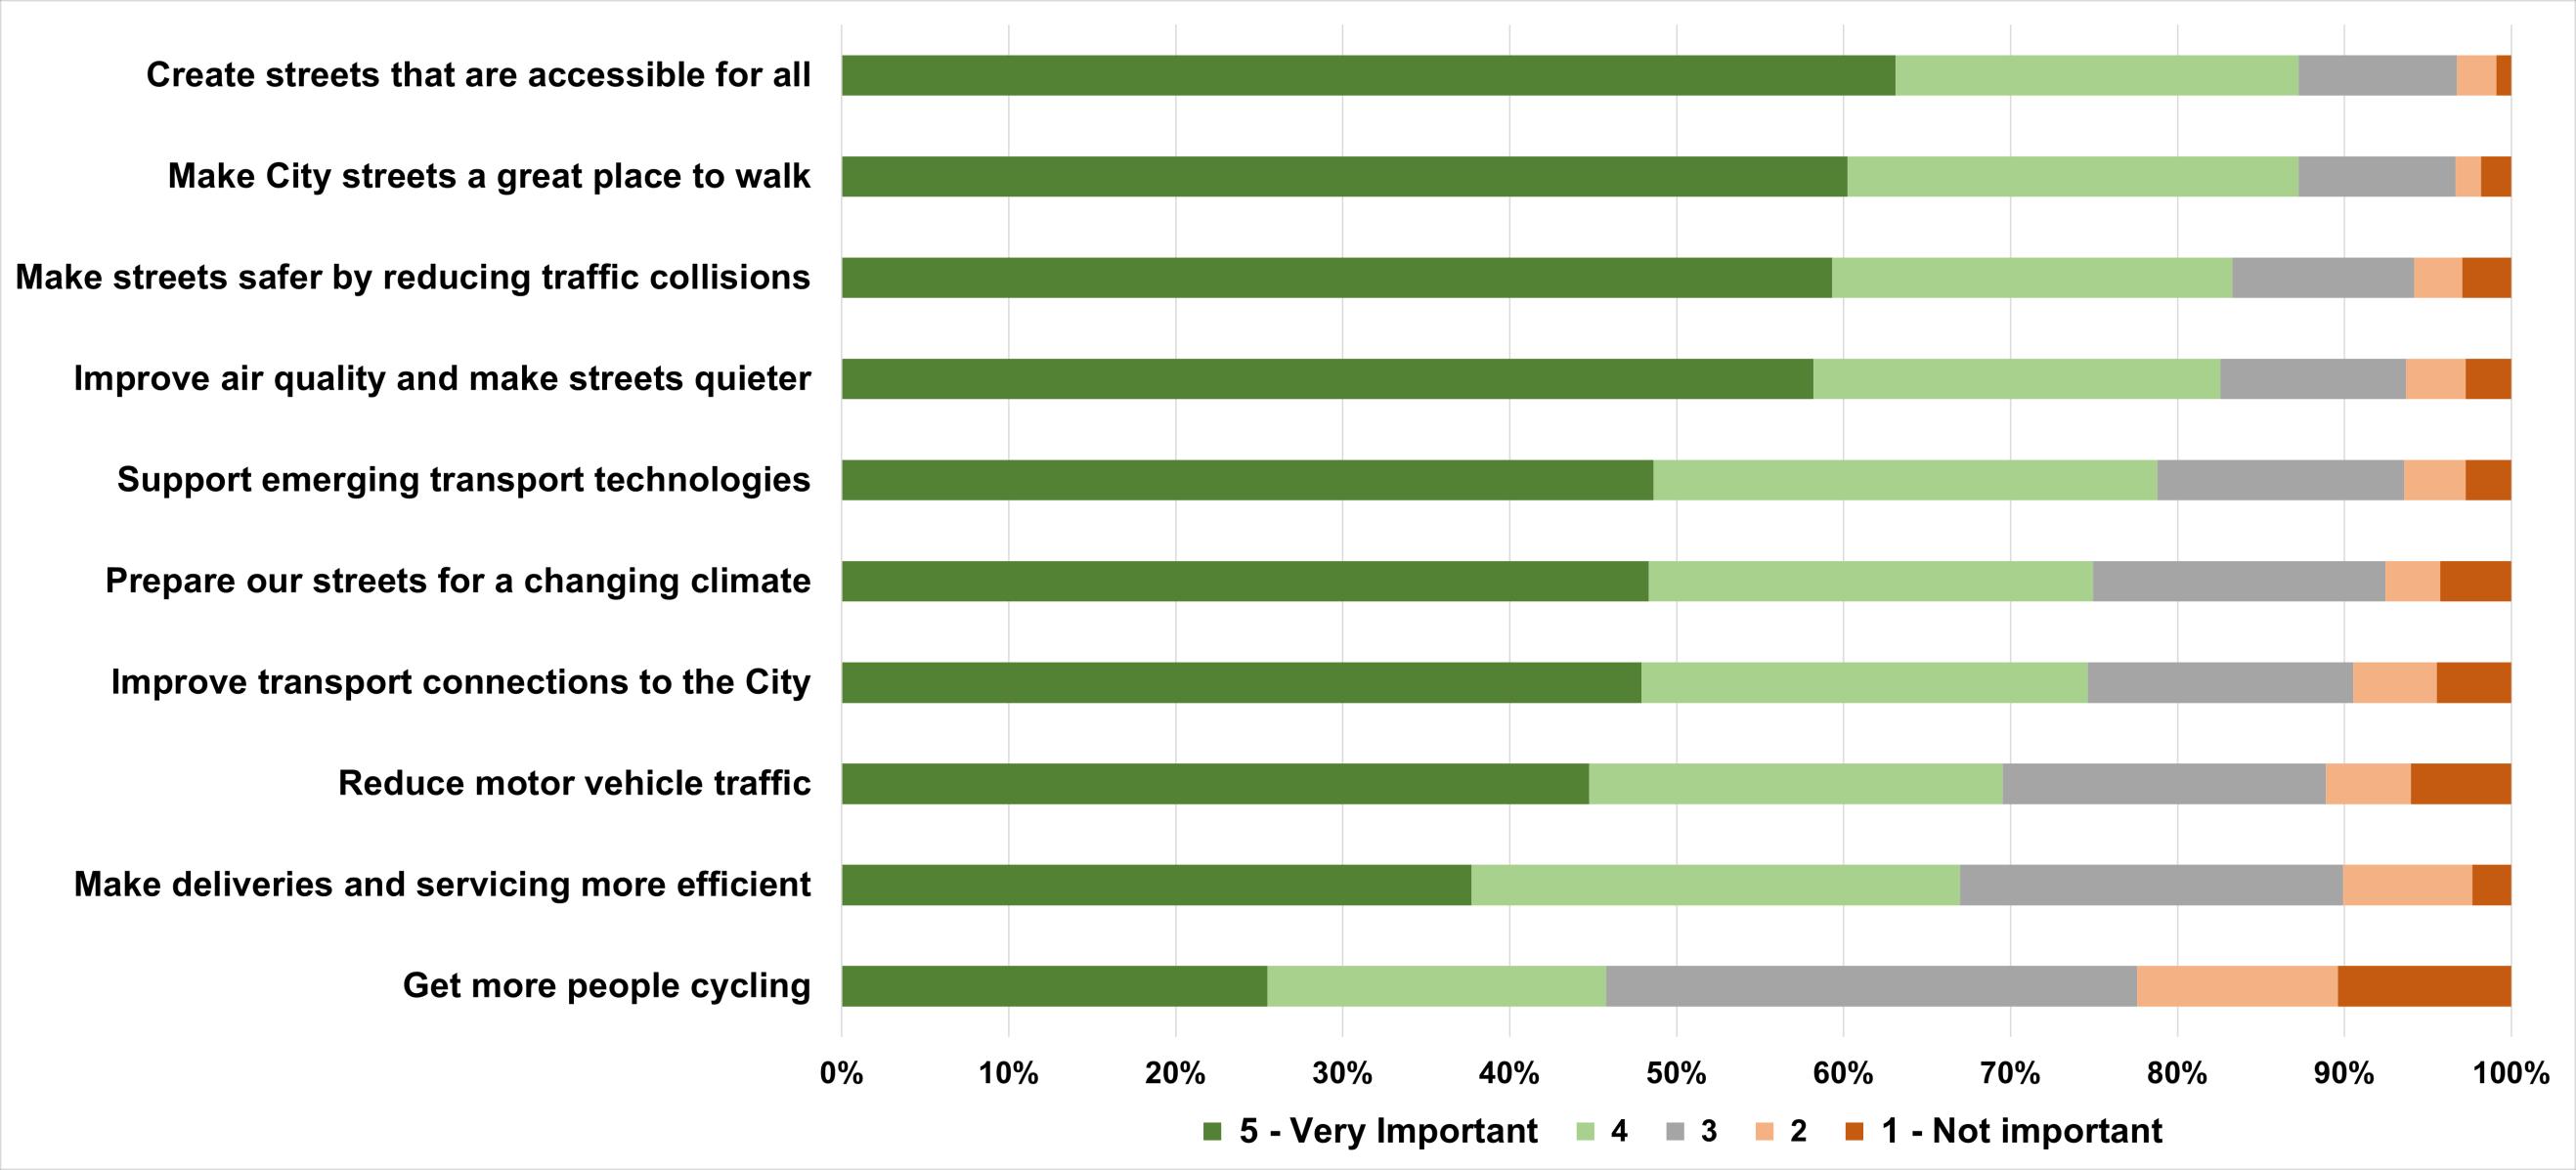
On a scale of 1 to 5, where 1 is not important and 5 is very important, how important or unimportant would you rate each of the following…?
(City Streets Survey 2023, 1000 respondents)
(London Travel Demand Survey combined responses for 2017/18 to 2019/20)
These mode shares are for the main mode of travel for a journey. Many trips by other modes, and especially public transport, start or finish a walk.

500% increase since 1999
60% decrease since 1999


In Autumn 2022, people cycling made up 27% of vehicular traffic, equal to the proportion of vehicles that are cars and private hire vehicles at 26%

The number of people killedand seriouslyinjured in collisions on City streets (2005 – 2021, includes collisions on the Transport for London Road Network)
In 2021, lower traffic levels and fewer people in the City led to the lowest number of fatal and seriousinjuries since records began, with 1 person killed and 39 seriously injured.

Street space is a finite resource and the Transport Strategy recognises the trade offs between competing demands for that space. These trades offs are weighted towards improvements for people walking, and to a lesser extent people cycling, and to enhancing the public realm.
“… delivering priority for people walking may result in delays or reduced capacity for other street users, while seeking to minimise the impact on essential traffic through general traffic reduction.”
“Delivering this Strategy will result in a reallocationof street space from motor vehicles to provide more space for people walking, cycling and spending time on the City’s streets. ….
Proposal 2: Put the needs of people walking first when designing and managing our streets.
Proposal 11: Take a proactiveapproach to reducing motor traffic
Our Transport Strategy aligns with the strategicapproach taken by other cities around the world, for example New York.
“We recognize that our streets … are also places where people work, play, and interact with others. We are dedicated to creating environments that acknowledge these human needs. This is done by creating streets that are pleasant not only for walking through but also experiencing in other ways. In some instances, this means reclaiming road space entirely or limiting access for certain types of vehicles or during certain times of day.”

Our street hierarchy sets out how each street should function in terms of vehicular movement. Its application and the phasing and coordination of project delivery ensures trafficcan move around the City and access parking and properties.
London access streets: Preferred streets for motor vehicles that do not have a destination in, or immediately adjacent to the Square Mile.
City access streets: Preferred streets for motor vehicles travelling around the Square Mile or immediately adjacent destinations. Local access streets: Primarily used for the first or final part of a journey, providing access for vehicles to properties.

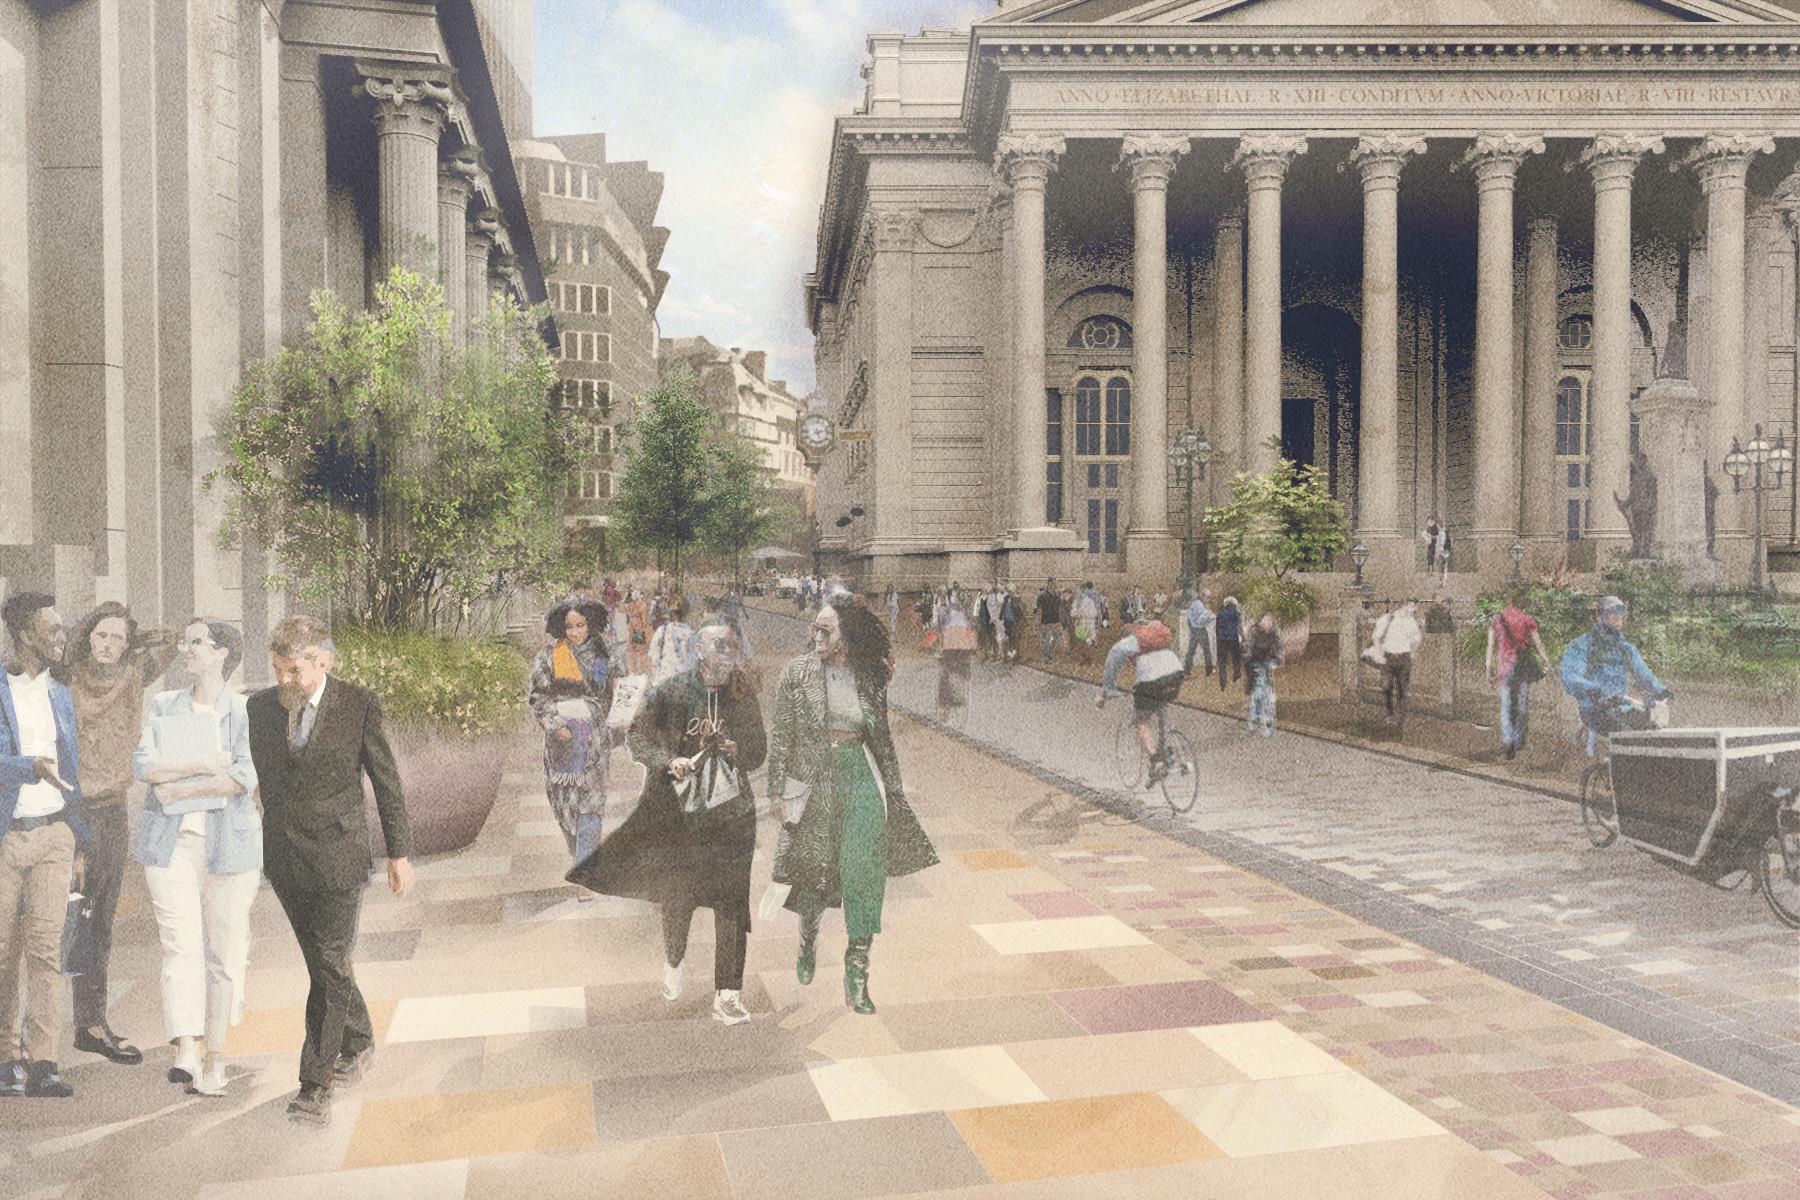

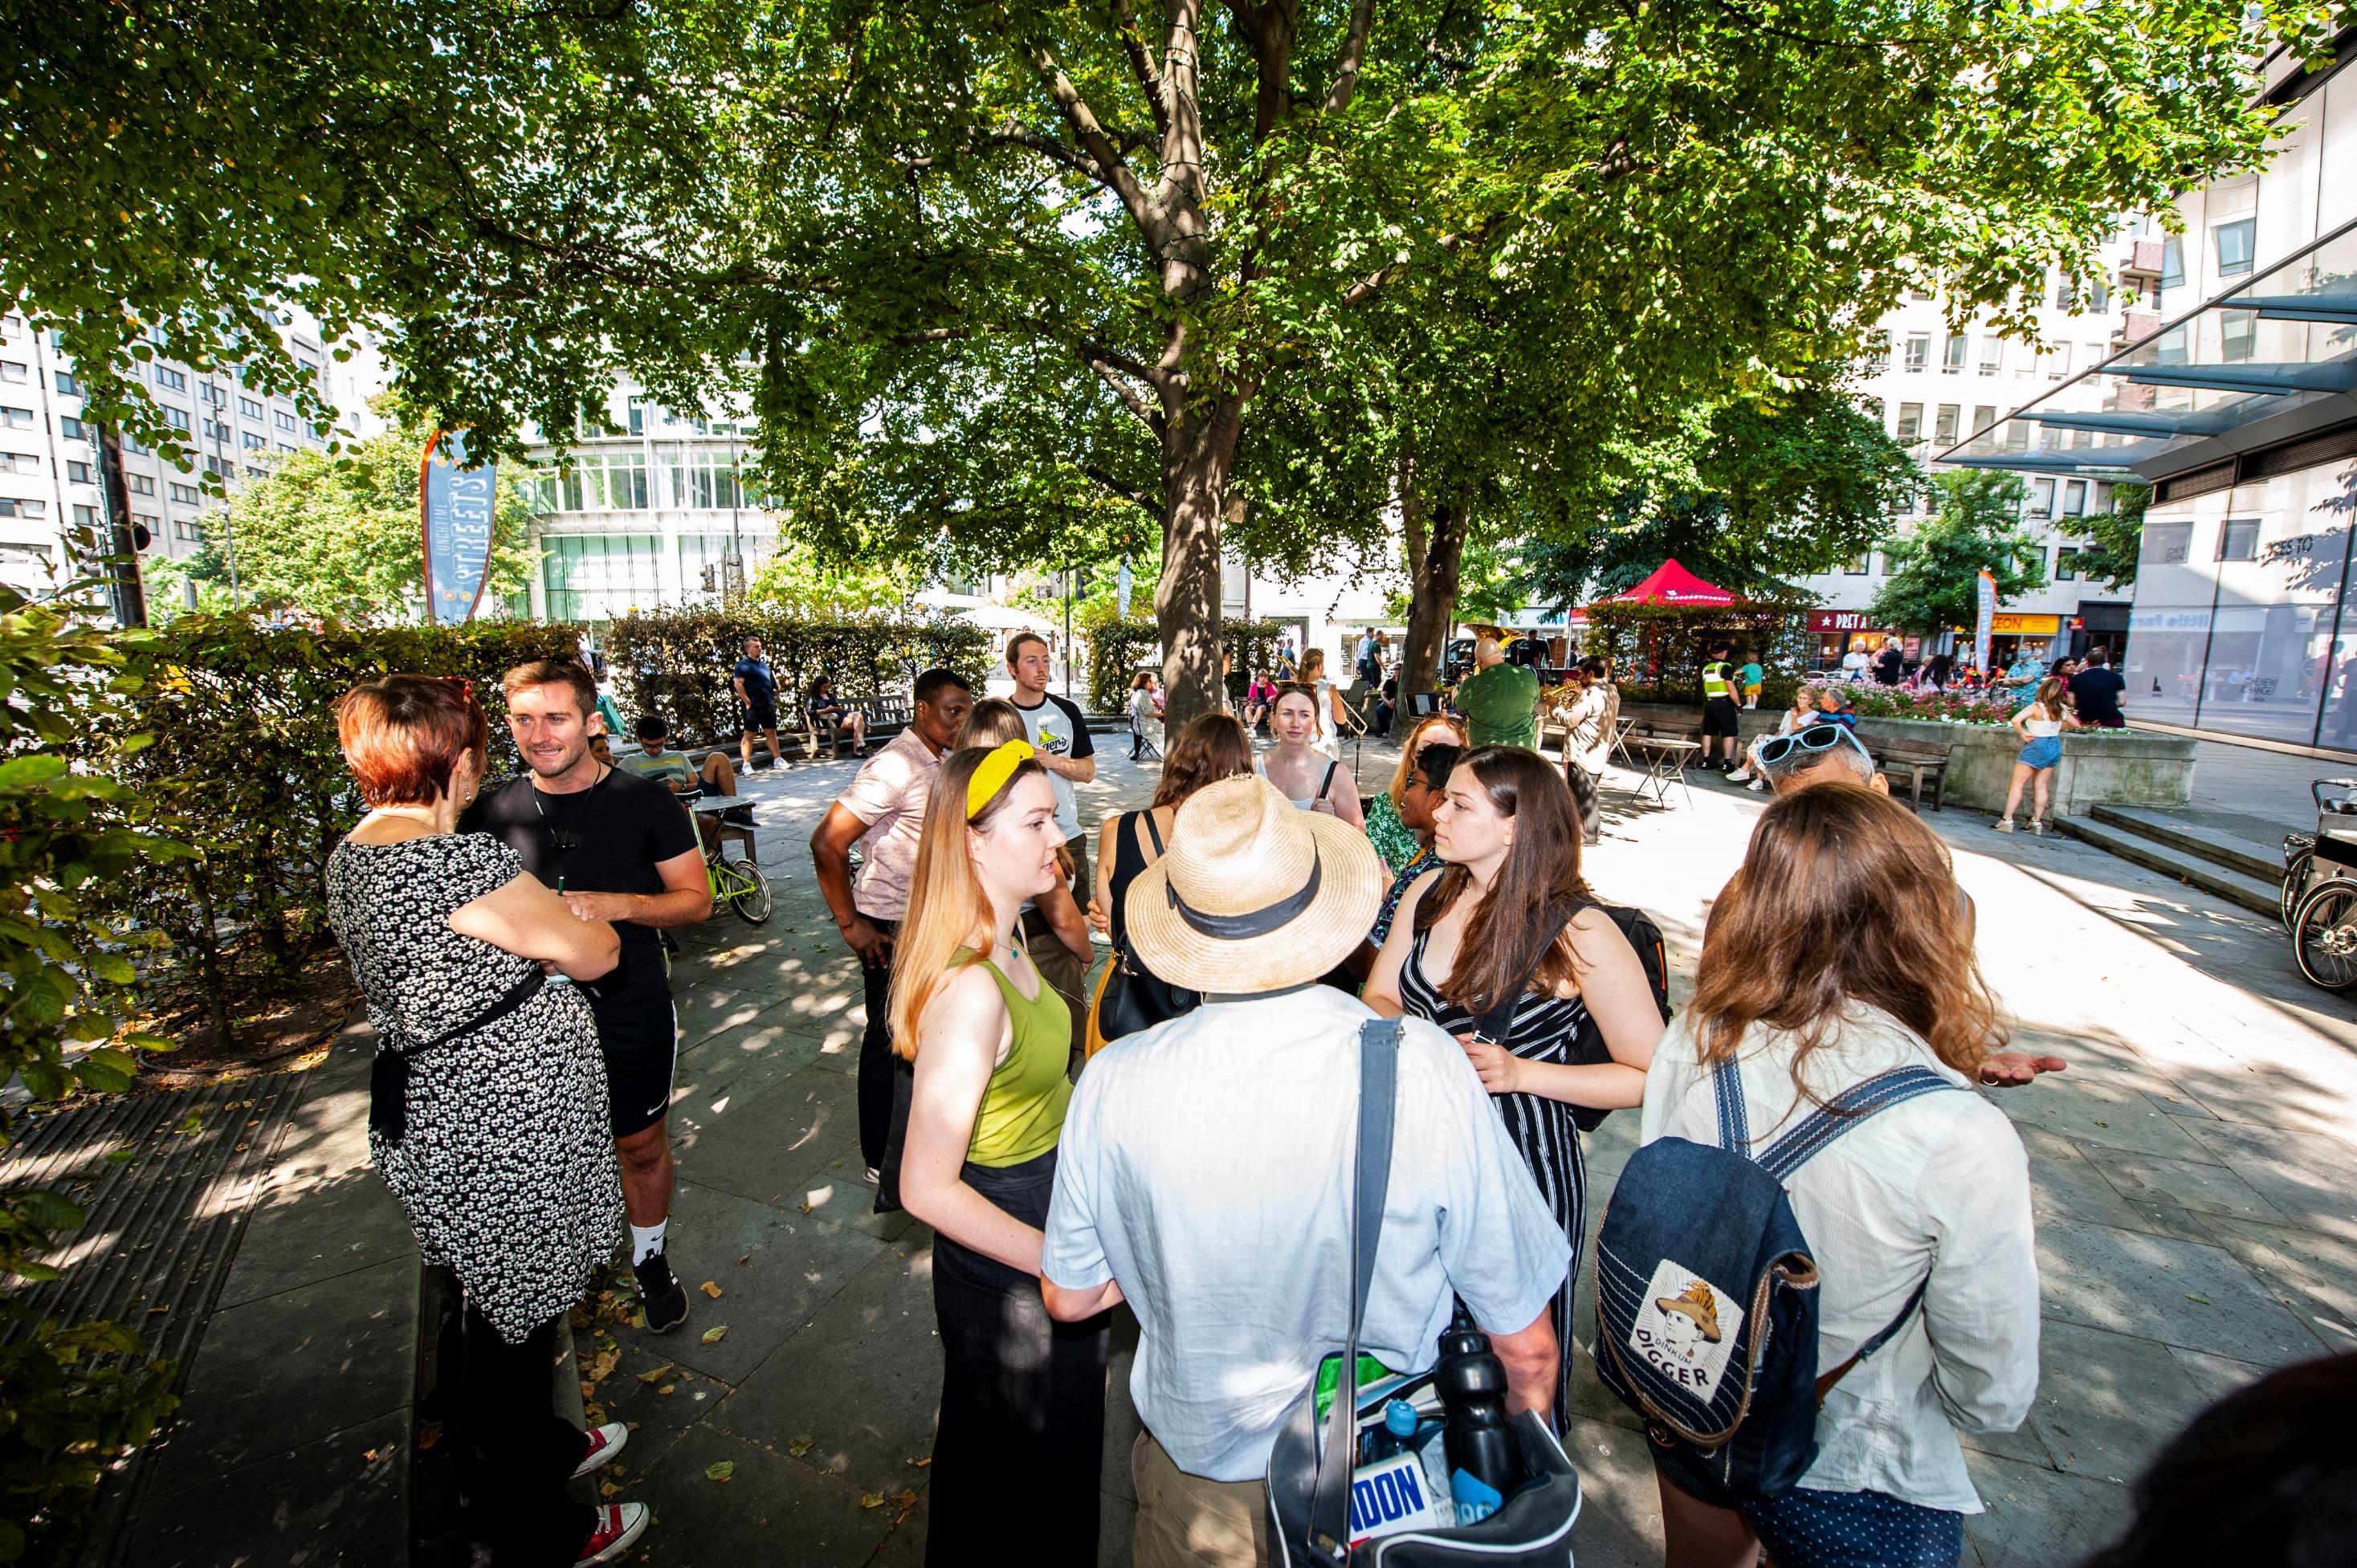
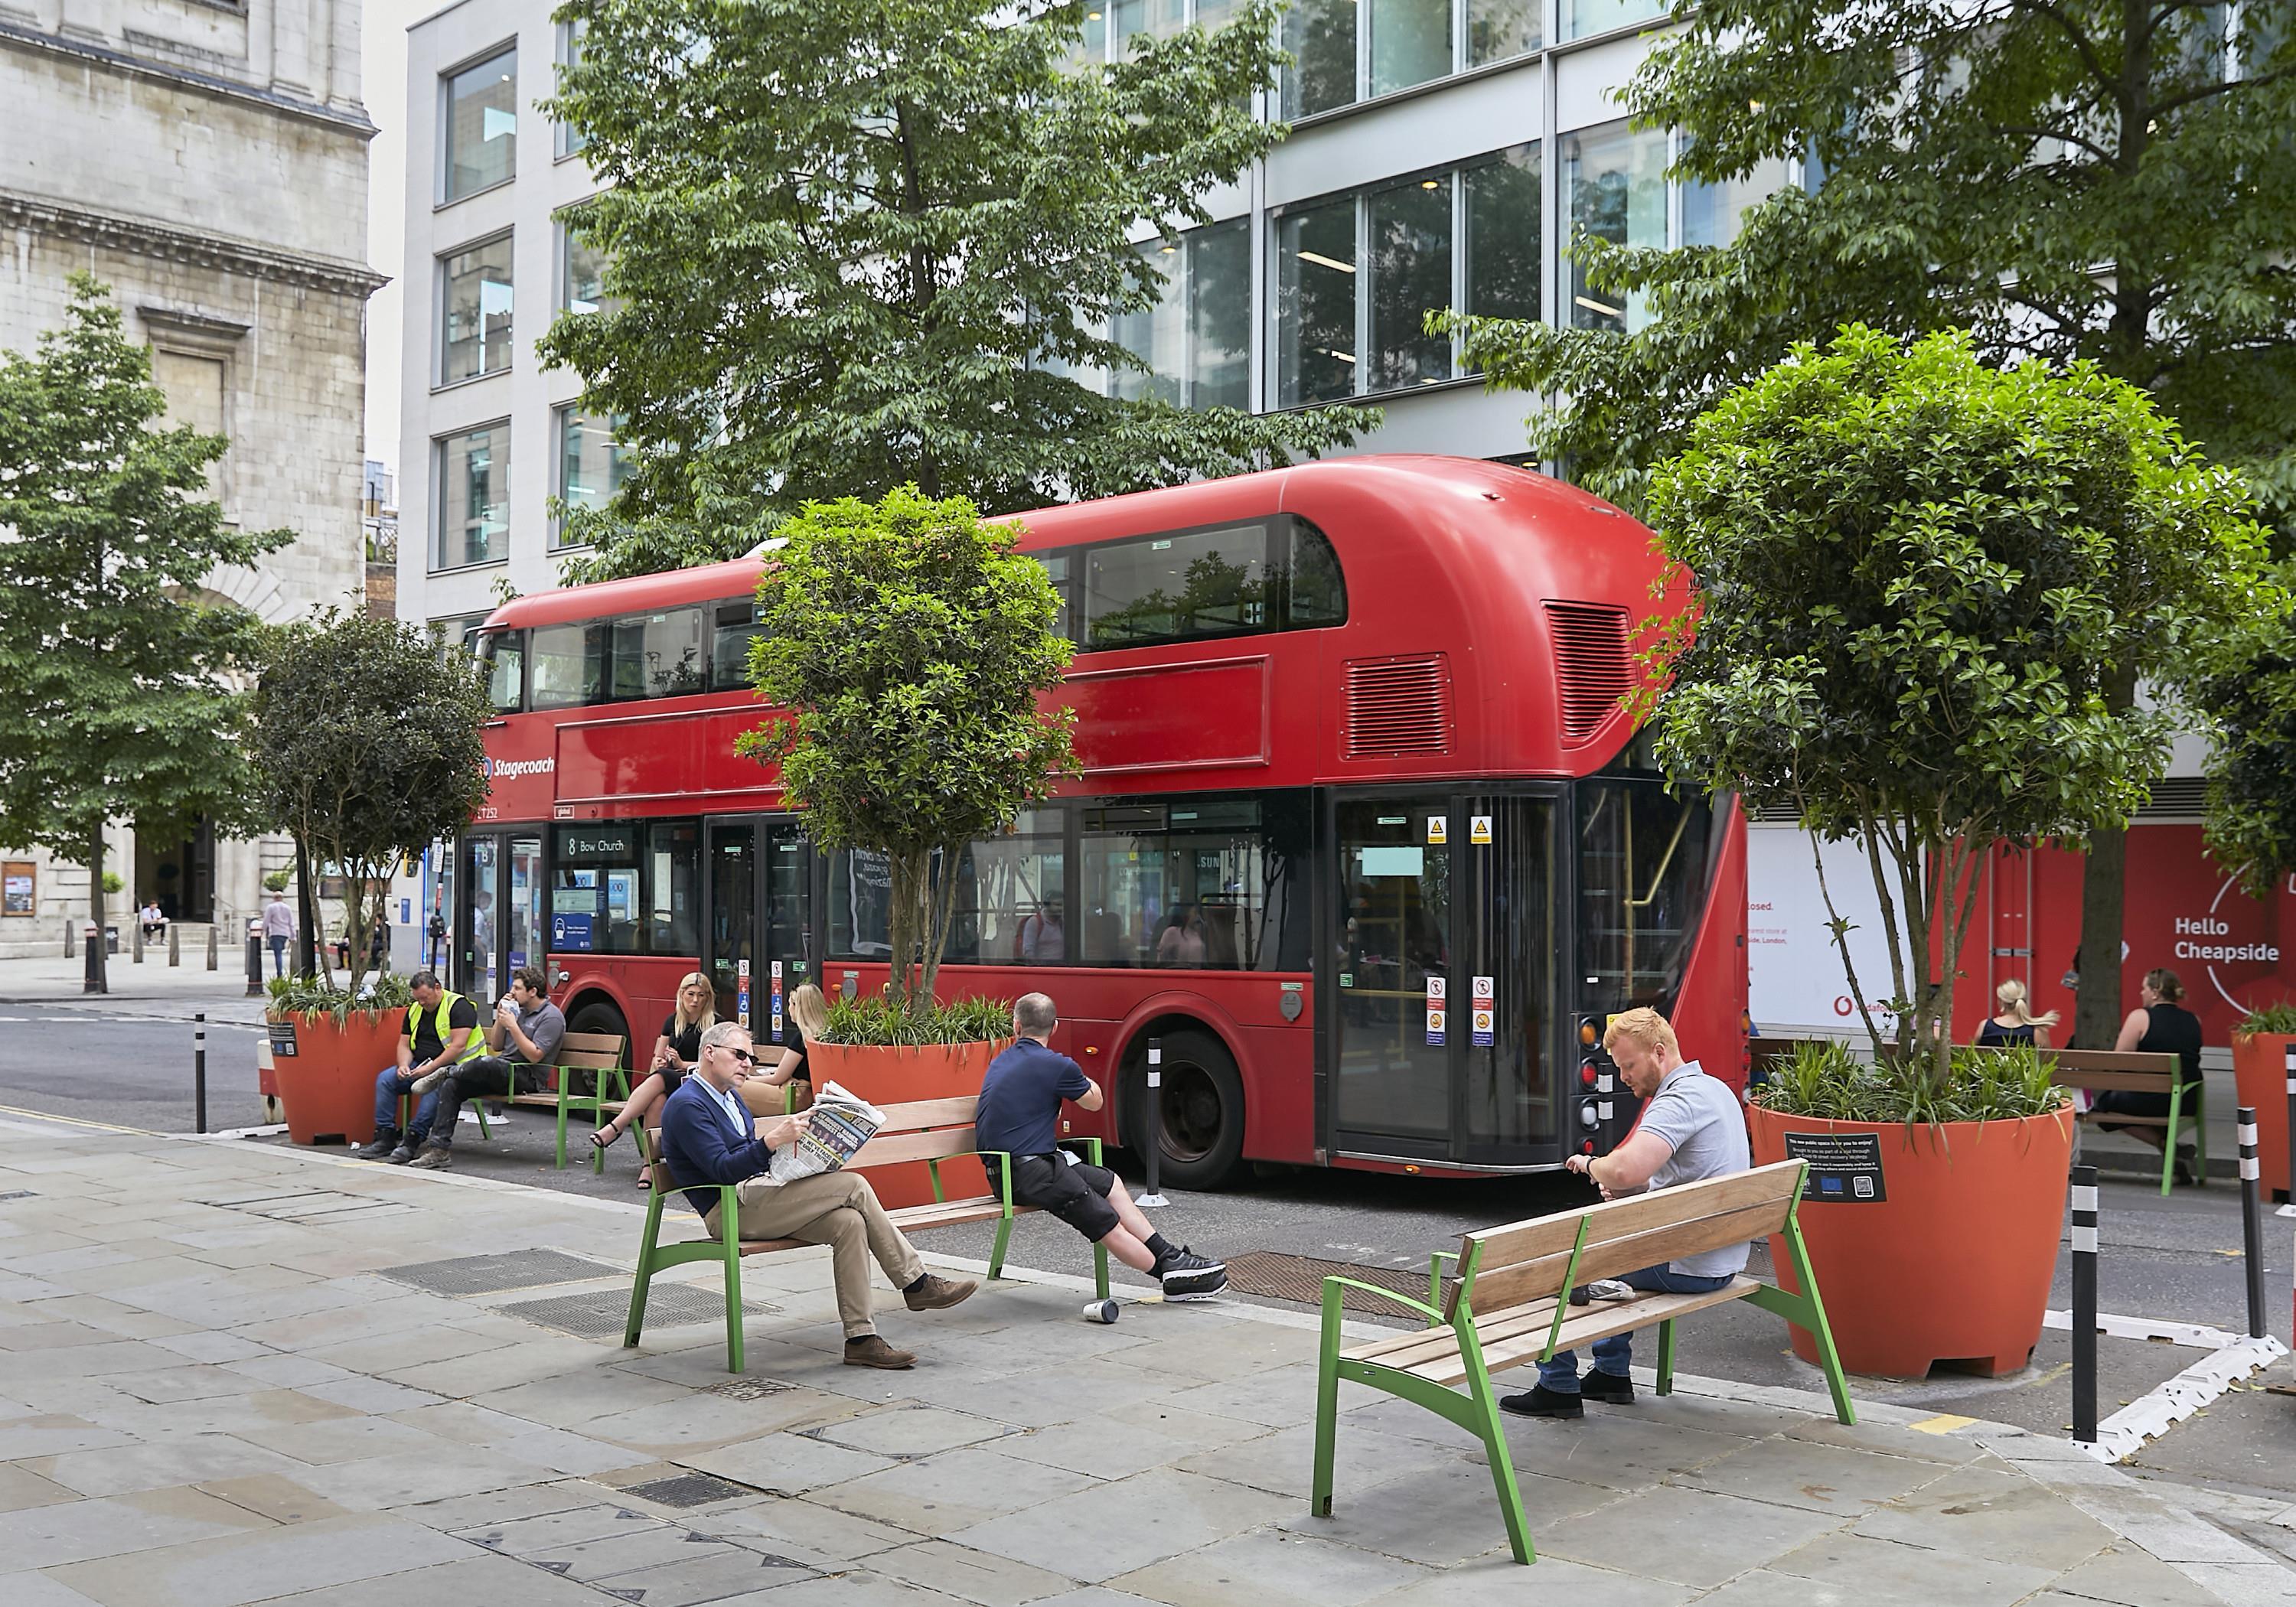 Photo: Clive Totman


 Rob McNicol, Assistant Director (Policy & Strategy), City of London Corporation
Samantha Tharme, Head of Strategic Transport, City of London Corporation
Bhakti Depala Head of Planning Delivery, Environment Department City of London Corporation
Aled Thomas Climate Action Strategy, City Workstream Manager, City of London Corporation
Suzanne Thurtle, Associate, Gerald Eve (panel chair)
Rob McNicol, Assistant Director (Policy & Strategy), City of London Corporation
Samantha Tharme, Head of Strategic Transport, City of London Corporation
Bhakti Depala Head of Planning Delivery, Environment Department City of London Corporation
Aled Thomas Climate Action Strategy, City Workstream Manager, City of London Corporation
Suzanne Thurtle, Associate, Gerald Eve (panel chair)