3 minute read
Research Update from UMD


Assessment of registered fungicides for the control of brown patch on tall fescue, 2022
By Fereshteh Shahoveisi, Ph.D., Department of Plant Sciences and Landscape Architecture, University of Maryland
Advertisement
Fungicides were evaluated in a field trial conducted at the Paint Branch Turfgrass Facility (University of Maryland).
Tall fescue cv. ‘Bullseye’ planted on native silt loam soil with two times a week mowing frequency (3 in. height of cut) was subjected to three fungicides and a non-treated control. Treatments were applied every 28 d from 1 Jun to 26 Aug. The final application was made on 24 Aug; however, it was repeated on 26 Aug due to a precipitation event 30 minutes after spraying the plots. A CO2 backpack sprayer at 40 psi equipped with a single Teejet AI9508E nozzle in water equivalent to 2 gal /1000 ft2 was used. Plots were 3 ft x 6 ft and arranged in a randomized complete block design with four replications. The site had a previous history of brown patch occurrence and was not inoculated during the study period. Nitrogen was applied as urea (46-0-0) twice at 0.9 lb/1000 ft2 on 6 Jun and 0.5 lb/1000 ft2 on 6 Jul. The experiment concluded on 15 Sep as the disease pressure started to decline. Brown patch disease severity was assessed as a visual estimate of the percentage plot area affected. The standardized area under the disease progress curve (SAUDPC) was used to summarize the performance of fungicides throughout the study duration. SAUDPC was calculated using the following formula: Σ [[(yi+ yi+1)/2] [ti+1 - ti]]/n, where yi and yi+1 represent disease rating at two consecutive dates, ti and ti+1 represent the corresponding rating dates to yi and yi+1, respectively, and n represents the number of days between the first and last rating dates. Data were subjected to analysis of variance and means separation using Fisher’s least significant difference (LSD) procedure at α = 0.05. Brown patch severity increased throughout the season with maximum disease severity of 34.7% in non-treated plots on 7 Sep. Plots treated with Fame SC had significantly lower brown patch severity than the non-treated control on all rating dates. They also showed significantly lower disease severity than plots treated with other fungicides on 11 Aug, 7 Sep, and 15 Sep. SAUPC values were significantly lower for plots treated with Fame SC than for all other treatments and the non-treated control. Rayora and Banner Max II-treated plots had significantly lower brown patch severity than the non-treated only on 18 Jul and were not statistically different from non-treated plots throughout much of the study. Phytotoxicity was not observed following fungicide applications. •
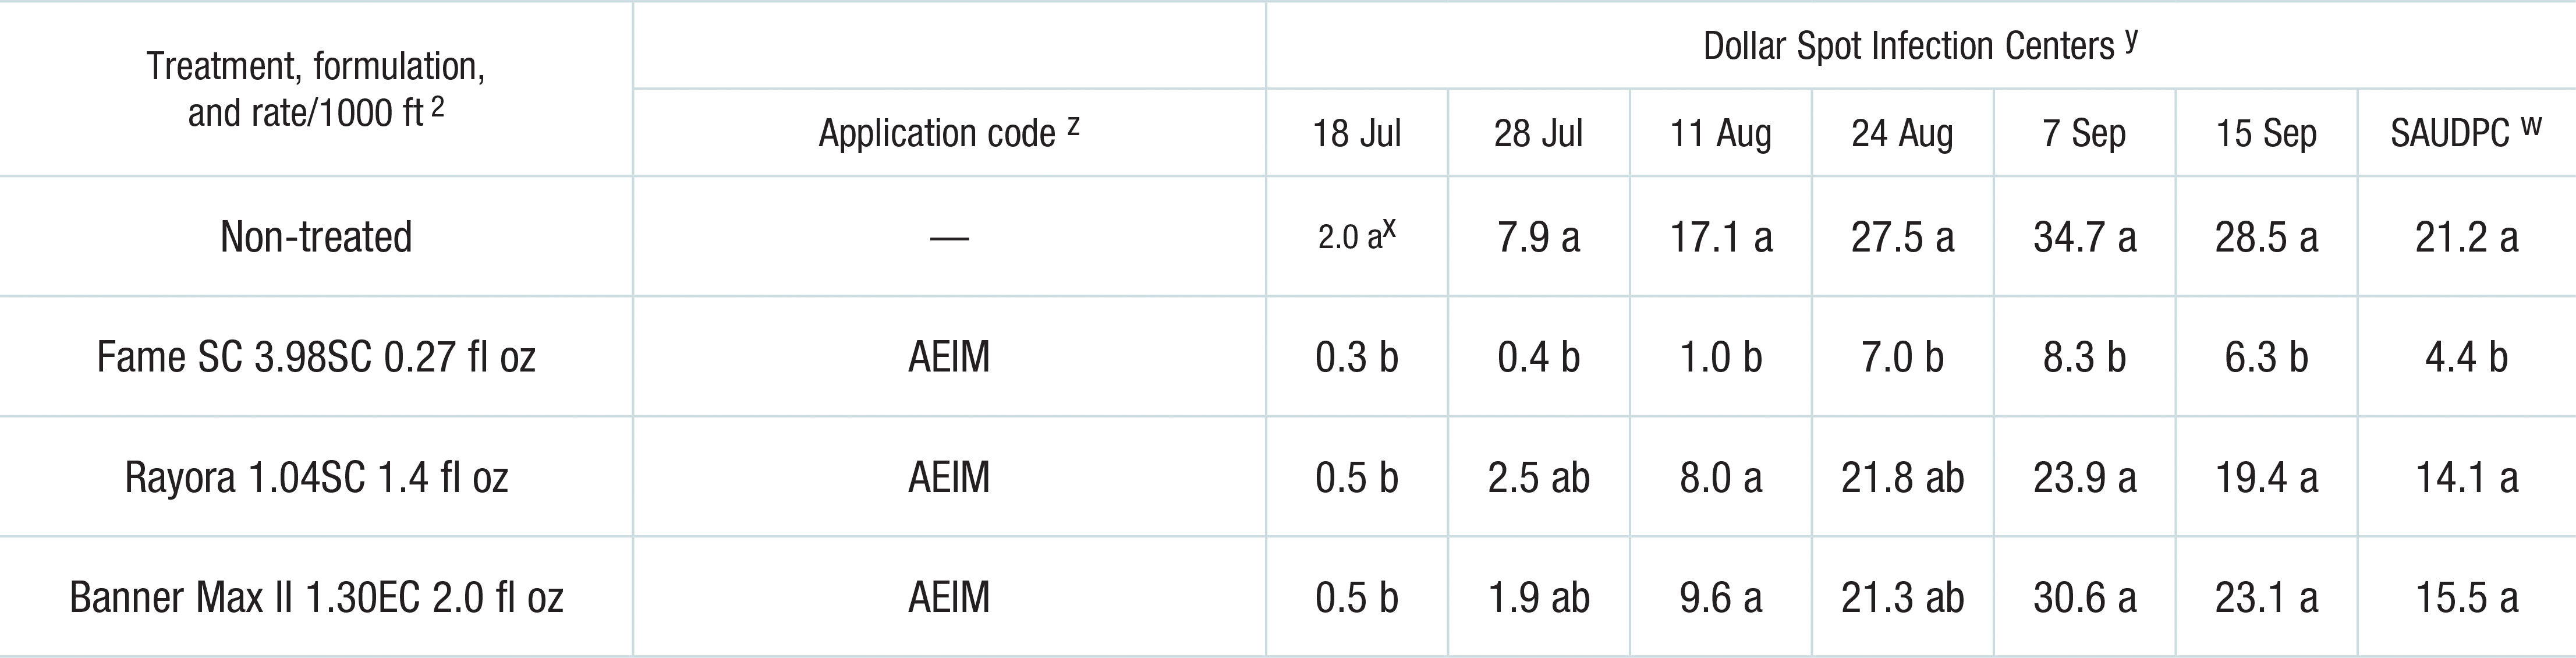
z Letters indicate the date of application: A=1 Jun, E=29 Jun, I=2 Jul, and M=24 Aug & 26 Aug. Due to a precipitation event 30 minutes after the 24 Aug application, all treatments were repeated on 26 Aug.
y Brown patch severity was visually assessed on a 0 to 100% scale where 0 = no disease and 100 = entire plot area symptomatic.
x Means in a column followed by the same letter are not significantly different according to Fisher’s least significant difference (α = 0.05).
w Standardized area under the disease progress curve is a quantitative measure of dollar spot intensity with time over all rating dates.
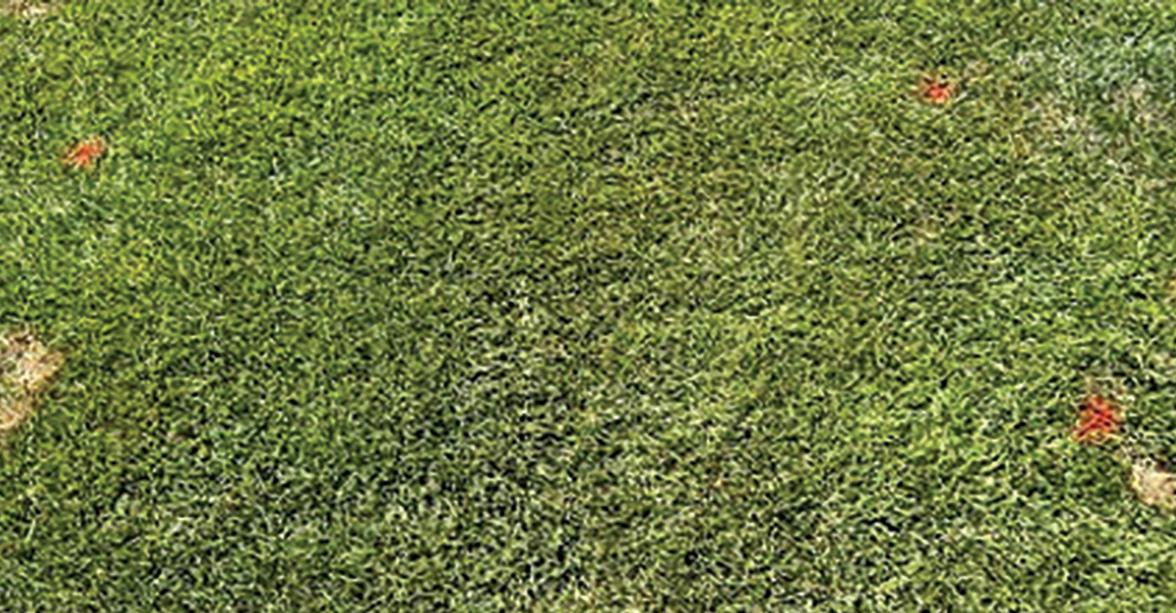
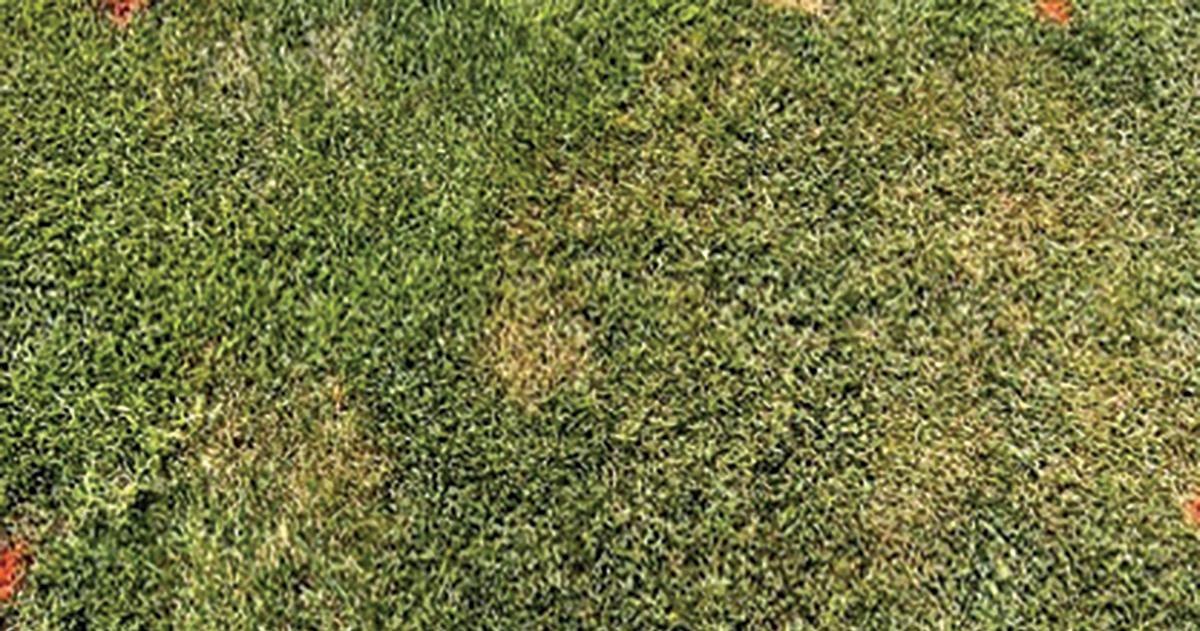
Brown Patch: Treated plot (Fame) on the top and non-treated plot below.