5 minute read
Carrying Capacity and Pace Measurements on Natural Grass Tennis Courts
By J. Scott bdon, Ph.D., Michelle DaCosta, Ph.D, and Jefferson Lu
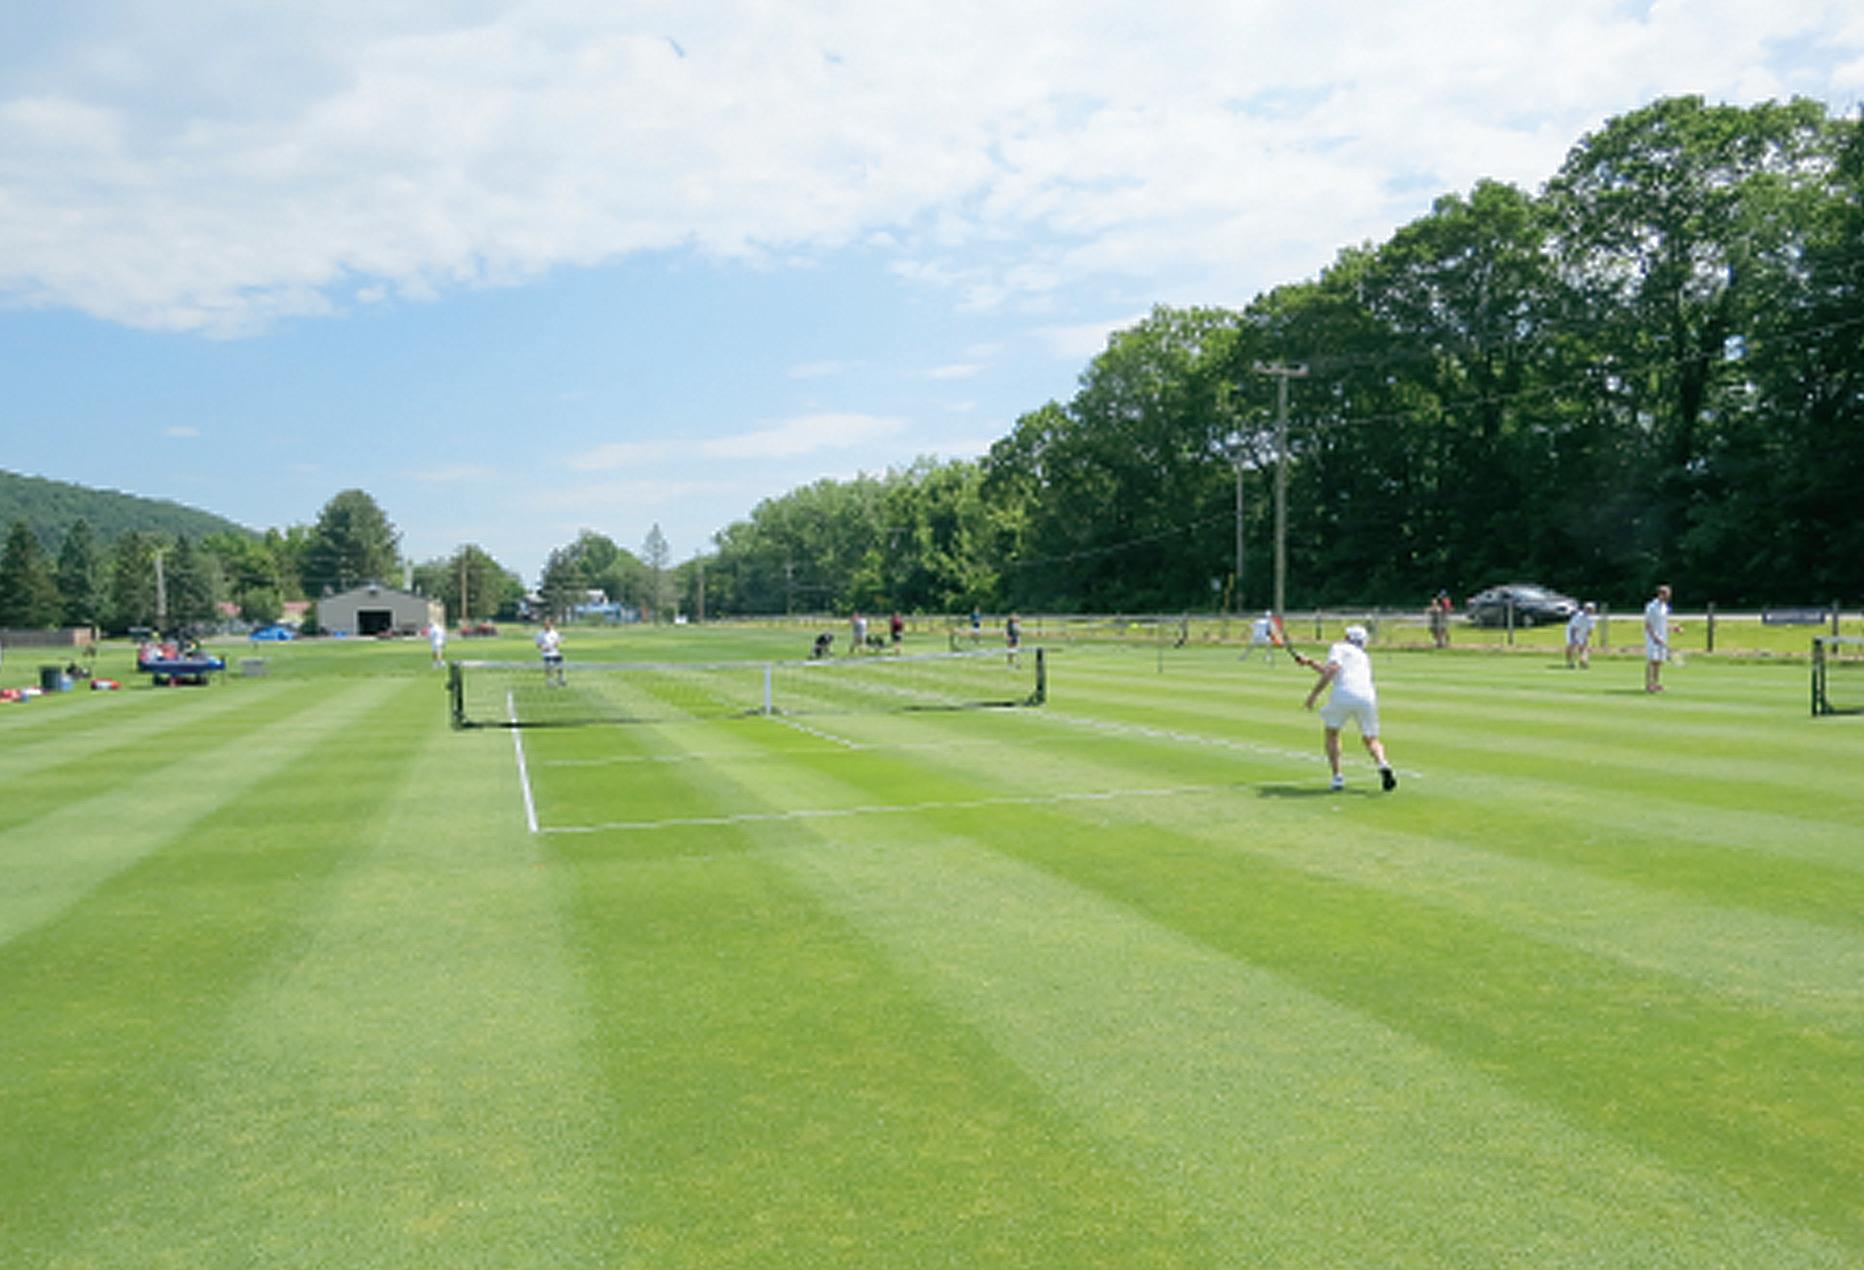
Three official size single courts (78 by 27 ft) were established in 2016 at the Joseph Troll Turf Research and Education Center at the University of Massachusetts Amherst. Each court was planted to evaluate pure stands of the same 8 species and cultivars: ‘Keeneland’ Kentucky bluegrass (KB), ‘Rubix’ KB, ‘Karma’ perennial ryegrass (PR), ‘Wicked’ PR, ‘Puritan’ colonial bentgrass (CLBG), ‘007’ creeping bentgrass (CBG), ‘Villa’ velvet bentgrass (VBG) and the Chambers Bay Dunes mix (creeping red fescue and Chewings fescue, FF). Net posts and base lines were installed and natural wear from actual match play was initiated in June of 2017. Maintenance personnel from Longwood Cricket Club (Director of Grounds Mike Buras and crew) assisted in the design and installation of the courts. This research is kindly funded by the New England Regional Turfgrass Foundation.
Advertisement

Photo 1: Actual match play was used to wear down turfgrass plots along the baselines of grass courts. The capacity of the different grass species to tolerate traffic during tennis play was then assessed.
The grass courts are mowed daily at 0.3125 inch height of cut and rolled daily using a 2,200 lb roller (10 ft wide) to maintain firmness and uniform surface conditions for ball bounce. The following surface characteristics important to tennis were measured in 2018 on the different species-cultivars: ball bounce (i.e., coefficient of restitution, COR), surface friction (i.e., coefficient of friction, COF), surface hardness (Gmax, firmness), player traction (Nm), TDRvolumetric soil moisture content (TDRVSMC), as well as turfgrass physiological and morphological measurements.

Photo 2: Following 76 hours of match play, differences in injuries caused by tennis play were more readily apparent on colonial bentgrass (plot to the right) compared to perennial ryegrass (plot to the left).
Compared to acrylic (hard) court and clay court surfaces, grass courts are notoriously fast in how quickly they play because of their lower COF (i.e., less surface friction between the ball and grass surface) and lower COR (i.e., lower ball bounce). Court pace (speed of play) is derived from COF and COR measurements. Lower COF increase court pace by increasing the horizontal velocity of the ball after impact while lower COR increases pace and play by reducing the time between successive bounces. These court surface properties are not well understood and have not been thoroughly investigated in grass tennis. Furthermore, the research is important to those who play tennis and the managers who maintain natural grass court surfaces.

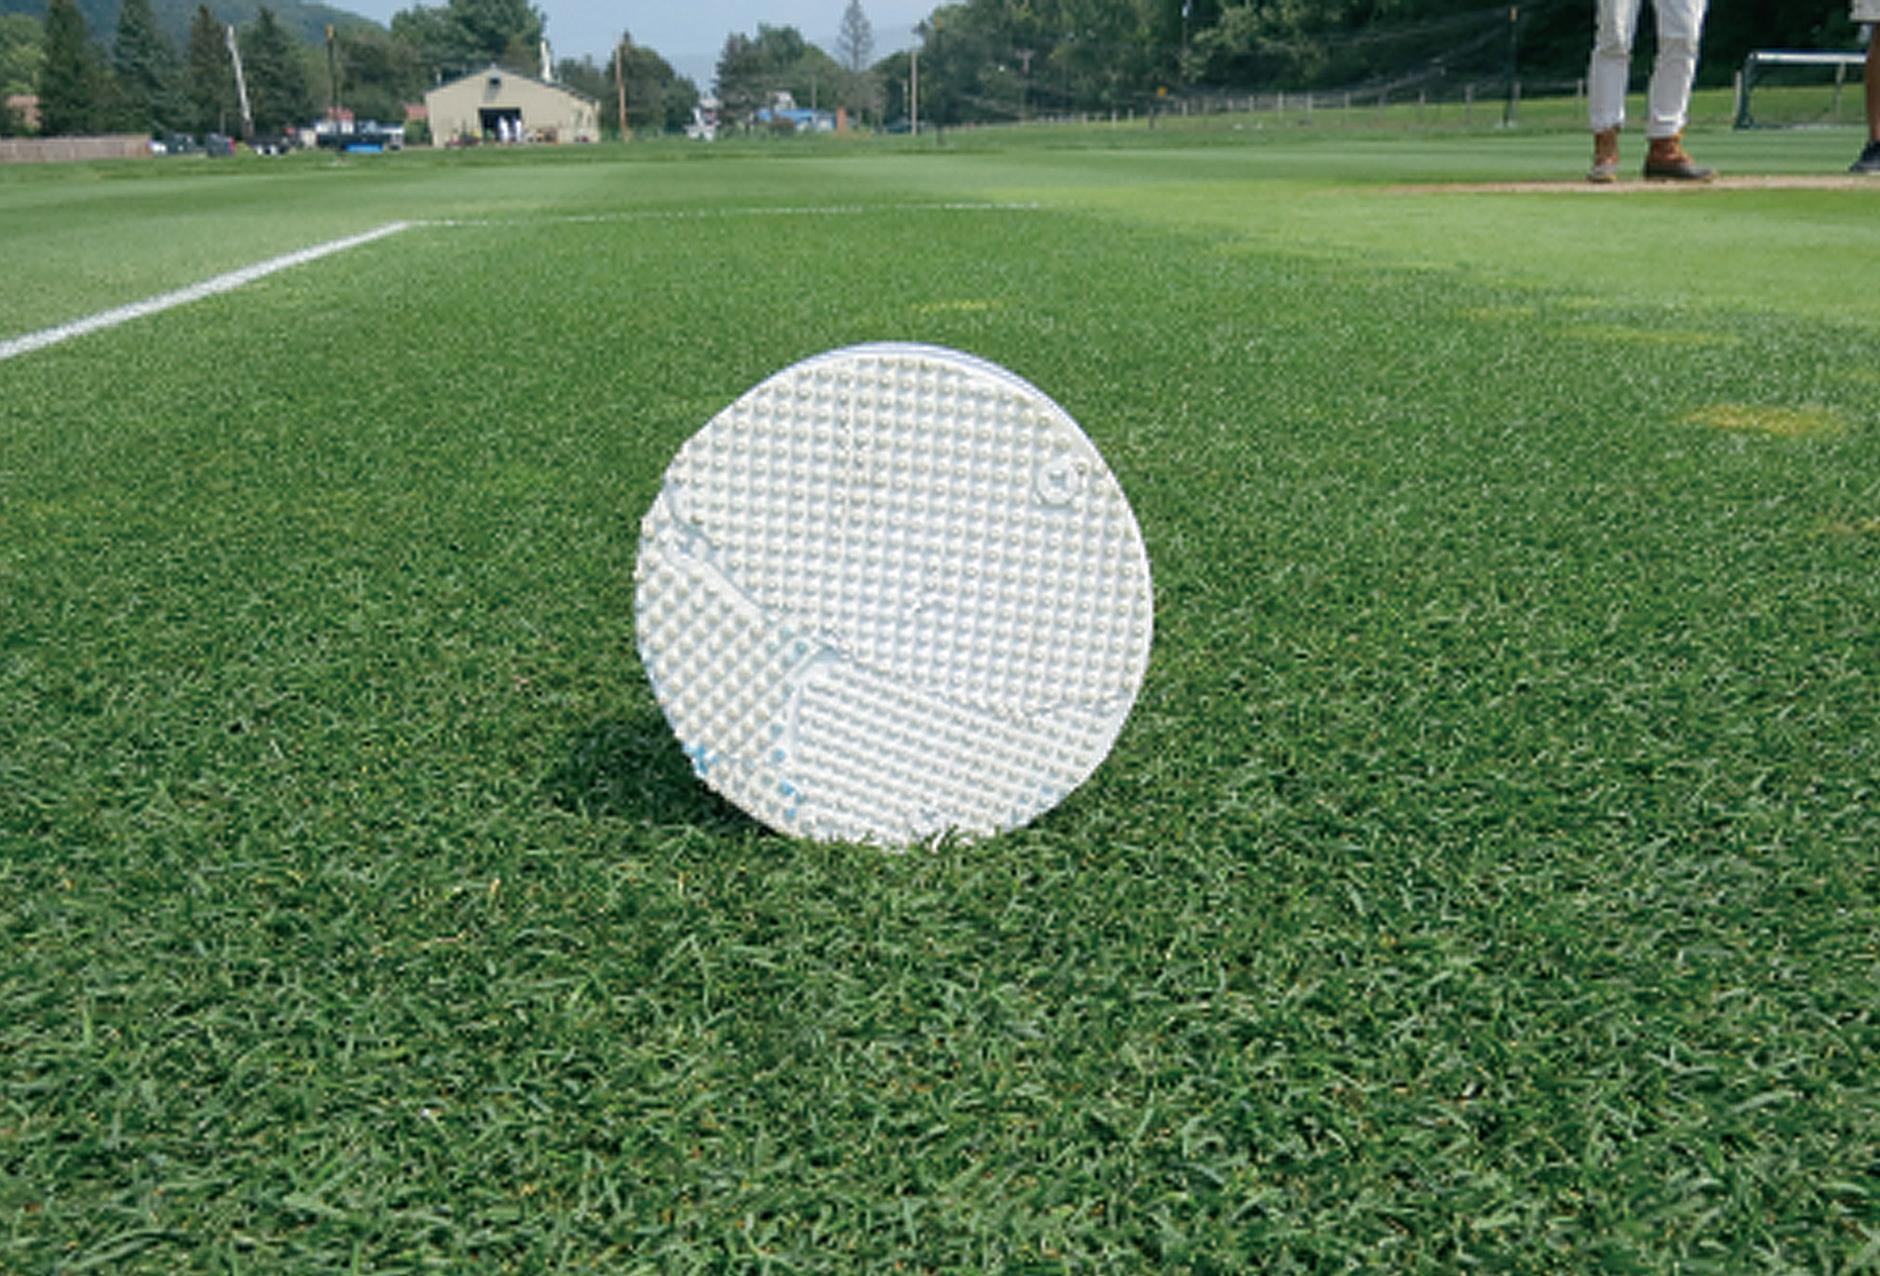
Photo 3: Perennial ryegrass plots (right) were more wear tolerant than most other species. However, grass court tennis shoes (outsoles, shown at right) are more likely to slip on perennial ryegrass compared to Kentucky bluegrass or bentgrass.
Despite daily mowing and rolling, there is significant variability in grass court CPR due to the variations in BB, COR, and COF. Such variability in grass courts is not unusual especially when compared to constructed surfaces (hard and clay courts) where BB and surface friction are more uniform. The variability caused by soil moisture, grass species, density and grass cover make COR and COF less uniform in natural grass surfaces. Among the different species evaluated, BG species were more variable in CPR due to greater variability in BB (COR) and surface friction (COF) when compared to KB, PR and FF grass surfaces.
Hours of play on each court was recorded daily to compute carrying capacity of the different grass species and cultivars. Carrying capacity is derived from wear injury measured as the loss in grass cover at the base lines on all courts (replicates) and main plots. Seventy-two players participated in 2017 with an average of 22 players per week on each court. By the end of the tennis playing season, 76 hours of match play were recorded on all three courts. Carrying capacities (hrs) were calculated in terms of hours of play required to diminish grass cover from 100 to 70% cover at the base line. Species carrying capacities in 2017 to cause 70% grass cover were as follows: PR (69.2 hrs) = KB (61.8 hrs) > VBG (52.9 hrs) > CBG (30.7 hrs) = CLBG (26.9 hrs) > FF (13.3 hrs). Cultivars of KB and PR exhibited a 2-fold greater carrying capacity (and wear tolerance) than most other species (bentgrass and fine fescue). After 76 hrs of match play the courts were closed (on 12 August, 2017) to begin overseeding of the base lines. Grass cover at the base line after 76 hrs of match play corresponded to PR (77%) = KB (72%) = VBG (65%) > CLBB (39%) = CBG (35%) = FF (11%). Grass cover and carrying capacity at termination of match play was highly correlated with total cell wall content (i.e., cell wall thickening). Species-cultivars with greater carrying capacities, grass cover, and wear tolerance at the base line were associated with greater total cell wall content (TCW) measured in their shoots. Shoot TCW can be further partitioned into cell wall component fractions: ligno- and hemi-cellulose. Greater lignocellulose may offer leaf tissues greater rigidity while hemi-celluloses provide greater leaf flexibility. Greater BB and COR increased significantly with greater ligno-cellulose in the leaf tissues accounting for some 63% of the total variation in BB and COR. Greater rigidity in the grass surface afforded by ligno-celluloses may explain the greater BB and COR with this cell wall fraction.
The outsoles from grass tennis shoes were fitted to a traction apparatus for measuring the ability of the grass surface to resist slippage when a rotational force (measured as Nm, Newton meter) is applied. Traction measurements indicated that grass surfaces with greater carrying capacities (and wear tolerance) are not necessarily the best for traction. Species traction measurements in 2017 and 2018 were as follows: BG (33.1 Nm) = KB (32.3 Nm) > PR (29.5 Nm) = FF (29.1 Nm). Preliminary results suggest that KB is the only species to combine both superior traction and wear tolerance under grass court conditions. Perennial ryegrass was among the most tolerant to wear but players may be more prone to slip when compared to the other species even when wearing grass court shoes. Grass court shoes may offer significantly better grip or traction than conventional tennis shoes. However, we would expect the potential for slip to be greater (i.e., lower Nm) if our traction apparatus were fitted with the outsoles of conventional tennis shoes.
This study will continue for two more years. Match play will reopen in 2019 for our second year of wear evaluations. A second year of surface measurements (TDR-VSMC, COF, Gmax, COR) will follow in 2020. We are also planning to visit natural grass court facilities in New England and the Northeast to measure BB, COR and COF.
Scott Ebdon is Professor of AgronomyTurfgrass Science and Michelle DaCosta is Associate Professor of Turfgrass Physiology in the Stockbridge School of Agriculture at the University of Massachusetts-Amherst. Jefferson Lu is a Ph.D. Student assisting in the investigation of wear tolerance and pace on grass tennis courts.


