MONTHLY STATS REPORT
FEBRUARY 2024


Single-family home sales totaled 179, while condo sales reached 334 a modest gain of 3.5% and 2.8%, respectively. When combined with January sales, 2024 shows continued improvement over 2023, with total year-to-date sales up by 7.2% compared to the same period last year.
Both markets experienced year-over-year growth in median sales price. Single-family homes observed an 8.9% jump, reaching $1,075,000, while condo sales increased 6.8% to $512,500. Additionally, the median days on the market for single-family homes decreased by 17 days to 30 days from 47 days in February 2023. However, condos stayed on the market longer than last year, with a median of 39 days compared to 28 days.
Sales volume for single-family homes remained steady compared to last year, up just six sales. Homes priced $1,000,000 and above made up nearly 60% of total sales this February, compared to 49% in February 2023, a 25.9% year-over-year increase. Conversely, single-family home sales below $1,000,000 dipped by 18.2% year-over-year. In the condo market, the $500,000 to $699,999 price range experienced the most significant growth, with 96 sales compared to 67 in February 2023, an increase of 43.3% or 29 units. Meanwhile, condos priced between $200,000 to $499,999 declined by 17.9%, or 30 sales.
New listings improved from last year, with 295 in the single-family home market and 533 in the condo market in February, growing 26.6% and 15.1%, respectively. However, compared monthover-month, new listings for homes increased by only 3.5% and declined by 8.3% for condos. In the $800,000 to $899,999 range for single-family homes, new listings surged 88.0%, with 47 new listings compared to 25 last February, while the largest volume of new listings was in the $1,000,000 to $1,499,999 range with 100 newly-listed homes. In the condo market, the $300,000 to $499,999 range saw a 33.8% rise in new listings. Besides Hawai‘i Kai and Kailua, all regions maintained or exceeded last year’s new listing volumes. The Metro region experienced the largest increase, up 14.8%, with 333 new condo listings compared to 290 last year.
Compared to a year ago, active inventory levels increased by 9.5% for single-family homes and 17.9% for condos. Month-over-month, single-family home inventory decreased by 1.3%, while condo inventory increased slightly by 3.0%. By the end of February, there were 599 active singlefamily home listings and 1,388 active condo listings.
In February, 23% of single-family home sales closed above the original asking price, compared to 19% at the same time last year, and the median sales price to original list price ratio was 97.8%, up 1.8%. Similarly, the condo market also saw a slight increase in sales closing above the original asking price, with 18% of sales this February, compared to 15% in February 2023, and a nearly even median sales price to the original list price ratio of 97.9%.
Pending sales for single-family homes jumped 24.0% year-over-year and 22.3% month-overmonth, with 269 contract signings in February. Condos ended the month with 390 contract signings, 2.3% lower than a year ago but slightly improved by 3.7% from last month. In the singlefamily market, there was a 40.7% year-over-year increase in contract signings in the $800,000 to $899,999 price range, with 38 properties going into escrow throughout the month compared to 27 in February 2023. For condos, pending sales activity varied across price points.
Oahu Monthly Housing Statistics
February 2024

Monthly Indicators 2 Median Sales Price YoY %chg Price Graphs 3-4 $1,075,000+8.9% Closed Sales 5 Closed Sales YoY %chg Median Sales Price6 Average Sales Price 7 179 +3.5% Median Days on Market 8 Percent of Original List Price Received 9 Average Sales Price YoY %chg New Listings10 Pending Sales 11 $1,437,693+0.7% Active Inventory 12 Total Inventory In Escrow 13 Months Supply of Active Inventory 14 Housing Supply Overview 15 Median Sales Price YoY %chg Closed Sales (by price range)16-17 Median Days on Market (by price range) 18-19 $512,500+6.8% Percent of Original List Price Received (by price range)20-21 New Listings (by price range) 22-23 Closed Sales YoY %chg Pending Sales (by price range)24-25 Active Inventory (by price range) 26-27 334 +2.8% Active Inventory History 28 Total Inventory In Escrow (by price range) 29-30 Average Sales Price YoY %chg Months Supply of Active Inventory (by price range)31-32 $580,274-2.0% Historical Graphs 33-34 YoY % chg = year-over-year percent change comparing current month to the same month last year. SOURCE: Honolulu Board of REALTORS®, residential resales data compiled from HiCentral MLS, Ltd.® ©2024. Honolulu Board of REALTORS®. All Rights Reserved. Information herein deemed reliable but not guaranteed.
CONDOS
CONTENTS:
SINGLE-FAMILY HOMES
MoM%chg=month-over-monthpercentchangecomparingcurrentmonthtothepreviousmonth.
*seefootnotesonpages9-12regardingmethodologyupdates1-yr%chg=percentchangecomparingthecurrentYTDtimeperiodtothesameYTDtimeperiodoneyearago. 2-yr%chg=percentchangecomparingthecurrentYTDtimeperiodtothesameYTDtimeperiodtwoyearsago.
SOURCE: Honolulu Board of REALTORS®, residential resales compiled from MLS data.
©2024.HonoluluBoardofREALTORS®.AllRightsReserved.Informationhereindeemedreliablebutnotguaranteed.
February 2024 Feb-24 Feb-23YoY %chgJan-24MoM %chg Feb-24 Feb-23YoY %chgJan-24MoM %chg Closed Sales 179 1733.5%184-2.7% 334 3252.8%29214.4% Median Sales Price $1,075,000 $987,0008.9%$1,021,0165.3% $512,500 $480,0006.8%$502,5002.0% Average Sales Price $1,437,693 $1,427,8640.7%$1,323,1728.7% $580,274 $592,131-2.0%$593,630-2.2% Median Days on Market 30 47-36.2%293.4% 39 2839.3%2934.5% Percent of Orig. List Price Received 97.8% 96.0%1.9%98.3%-0.5% 97.9% 98.0%-0.1%97.5%0.4% New Listings 295 23326.6%2853.5% 533 46315.1%581-8.3% Pending Sales* 269 21724.0%22022.3% 390 399-2.3%3763.7% Active Inventory* 599 5479.5%607-1.3% 1,388 1,17717.9%1,3483.0% Total Inventory in Escrow* 416 3867.8%33424.6% 586 592-1.0%53210.2% Months Supply of Active Inventory* 2.8 2.040.0%2.80.0% 3.6 2.450.0%3.52.9%
Year-to-Date YTD-2024 YTD-20231-yr %chgYTD-20222-yr %chg YTD-2024 YTD-20231-yr %chgYTD-20222-yr %chg Closed Sales 363 32312.4%567-36.0% 626 6004.3%1,038-39.7% Median Sales Price $1,055,000 $980,0007.7%$1,084,250-2.7% $510,000 $485,0005.2%$500,0002.0% Average Sales Price $1,379,644 $1,293,8536.6%$1,364,9121.1% $587,221 $609,016-3.6%$605,009-2.9% Median Days on Market 29 35-17.1%12141.7% 34 2630.8%14142.9% Percent of Orig. List Price Received 98.1% 95.9%2.3%101.2%-3.1% 97.7% 98.1%-0.4%100.0%-2.3% New Listings 580 50115.8%687-15.6% 1,114 98613.0%1,405-20.7% Pending Sales* 489 4841.0%631-22.5% 766 777-1.4%1,217-37.1%
Monthly Indicators OAHU, HAWAII
*seefootnotesonpages9-12regardingmethodologyupdatesYoY%chg=year-over-yearpercentchangecomparingcurrentmonthtothesamemonthlastyear.
Single-Family Homes Condos Single-Family Homes Condos


3 2 7 21 20 19 19 10 17 9 5 5 4 7 2 1 19 9 5 4 9 21 28 21 9 14 5 9 6 2 1 3 5 2 17 12 0 5 10 15 20 25 30 Closed Sales Sold Price ($) Single-Family Homes Sold February 2024 vs. February 2023 2024 2023 SOURCE: Honolulu Board of REALTORS®, compiled from MLS data. ©2024. Honolulu Board of REALTORS®. All Rights Reserved. Information herein deemed reliable but not guaranteed.

4 15 26 55 57 50 46 26 15 10 27 3 5 11 35 66 67 38 29 35 10 3 19 7 0 10 20 30 40 50 60 70 80 Closed Sales Sold Price ($) Condos Sold February 2024 vs. February 2023 2024 2023 SOURCE: Honolulu Board of REALTORS®, compiled from MLS data. ©2024. Honolulu Board of REALTORS®. All Rights Reserved. Information herein deemed reliable but not guaranteed.
Closed Sales
February 2024
OAHU, HAWAII
(Acountofpropertiesthathaveclosedinagivenmonth)
Mo-Yr Single-Family HomesCondosTotal
Feb-21260446706
Mar-21361626987
Apr-213756451,020
May-214055981,003
Jun-214517301,181
Jul-214046711,075
Aug-214256751,100
Sep-214246151,039
Oct-21381611992
Nov-21371601972
Dec-21378593971
Jan-22326552878
Feb-22241486727
Mar-22321672993
Apr-223656721,037
May-223446881,032
Jun-22357626983
Jul-22312518830
Aug-22314508822
Sep-22278496774
Oct-22222435657
Nov-22192340532
Dec-22202360562

Monthly Closed Sales Year-to-Date Closed Sales Jan-23150275425FebruarySFHYoY%chgCNDYoY%chgFebruaryYTDSFHYoY%chgYTDCNDYoY%chg Feb-231733254982022241-7.3%4869.0%20225672.9%1,03823.9% Mar-232364446802023173-28.2%325-33.1%2023323-43.0%600-42.2% Apr-23208420628 20241793.5%3342.8% 202436312.4%6264.3% May-23262438700 Jun-23248470718 Jul-23224422646 Aug-23252422674 Sep-23232376608 Oct-23213399612 Nov-23180310490 Dec-23182272454 Jan-24184292476 Feb-24179 334 513
0 100 200 300 400 500 600 700 800 Sales Closed Sales Single-Family Homes Condos 0 100 200 300 400 500 600 202220232024 Closed Sales SFH(YTD) 0 200 400 600 800 1,000 1,200 202220232024 Closed Sales CND(YTD) 0 50 100 150 200 250 300 202220232024 Closed Sales SFH(Feb) 0 100 200 300 400 500 600 202220232024 Closed Sales CND(Feb)
Honolulu
REALTORS®,
©2024.HonoluluBoardofREALTORS®.AllRightsReserved.Informationhereindeemedreliablebutnotguaranteed.
SOURCE:
Board of
residential resales compiled from MLS data.
Median Sales Price
February 2024
OAHU, HAWAII (Themediansalespriceofallclosedpropertiesinagivenmonth)
Mo/Yr Single-Family HomesCondos
Feb-21$917,500$457,500
Mar-21$950,000$451,000
Apr-21$928,000$450,000
May-21$978,000$457,750
Jun-21$979,000$460,000
Jul-21$992,500$475,000
Aug-21$1,050,000$500,000
Sep-21$1,050,000$478,000
Oct-21$1,000,000$500,000
Nov-21$1,050,000$500,000
Dec-21$1,050,000$485,000
Jan-22$1,050,000$510,000
Feb-22$1,125,000$497,000
Mar-22$1,150,000$515,500
Apr-22$1,105,000$510,000
May-22$1,153,500$516,500
Jun-22$1,100,000$534,000
Jul-22$1,107,944$500,000
Aug-22$1,125,500$498,500
Sep-22$1,100,000$502,500
Oct-22$1,050,000$520,000
Nov-22$1,149,500$480,000
Dec-22$1,049,500$502,500
Monthly Median Sales Price
Year-to-Date Median Sales Price
Jan-23$970,000$495,000FebruarySFHYoY%chgCNDYoY%chgFebruaryYTDSFHYoY%chgYTDCNDYoY%chg
Apr-23$999,995$500,000
May-23$1,109,000$505,000
Jun-23$1,050,000$510,000
Jul-23$1,090,000$500,000
Aug-23$1,110,000$515,000
Sep-23$1,050,000$532,500
2024$1,075,0008.9%$512,5006.8%
©2024.HonoluluBoardofREALTORS®.AllRightsReserved.Informationhereindeemedreliablebutnotguaranteed.
2024$1,055,000 7.7%$510,0005.2%
Feb-23$987,000$480,0002022$1,125,00022.6%$497,0008.6%2022$1,084,25021.1%$500,0009.9% Mar-23$1,083,750$536,0002023$987,000-12.3%$480,000-3.4%2023$980,000-9.6%$485,000-3.0%
Oct-23$1,100,000$515,000 Nov-23$1,100,055$516,179
Feb-24$1,075,000$512,500
Dec-23$996,500$510,000 Jan-24$1,021,016$502,500
$0 $200,000 $400,000 $600,000 $800,000 $1,000,000 $1,200,000 $1,400,000 Price ($)
Single-Family Homes Condos 0K 200K 400K 600K 800K 1.0M 1.2M 202220232024 Price ($) SFH(YTD) 0K 100K 200K 300K 400K 500K 600K 202220232024 Price ($) CND(YTD) 0K 200K 400K 600K 800K 1.0M 1.2M 202220232024 Price ($)
0K 100K 200K 300K 400K 500K 600K 202220232024 Price ($)
Median Sales Price
SFH(Feb)
CND(Feb)
SOURCE: Honolulu Board of REALTORS®, residential resales compiled from MLS data.
February 2024
OAHU, HAWAII
(Theaveragesalespriceofallclosedpropertiesinagivenmonth)
Mo/Yr Single-Family HomesCondos
Feb-21$1,172,804$545,629
Mar-21$1,226,827$530,257
Apr-21$1,194,150$520,192
May-21$1,246,611$555,798
Jun-21$1,225,011$557,302
Jul-21$1,265,382$544,064
Aug-21$1,316,681$618,612
Sep-21$1,289,510$558,002
Oct-21$1,335,171$582,509
Nov-21$1,296,551$559,007
Dec-21$1,303,481$604,749
Jan-22$1,277,309$623,928
Feb-22$1,486,088$583,367
Mar-22$1,570,668$623,684
Apr-22$1,404,481$613,189
May-22$1,450,008$625,327
Jun-22$1,382,559$631,822
Jul-22$1,329,023$590,934
Aug-22$1,341,958$547,319
Sep-22$1,307,249$607,502
Oct-22$1,243,960$676,988
Nov-22$1,387,685$594,444 Dec-22$1,325,156$576,689
Mar-23$1,391,538$651,6302023$1,427,864-3.9%$592,1311.5%2023$1,293,853-5.2%$609,0160.7%
Apr-23$1,223,383$603,795 2024$1,437,6930.7%$580,274-2.0%
May-23$1,355,804$623,748
Jun-23$1,300,456$589,597
Jul-23$1,270,421$617,683
Aug-23$1,427,996$628,127
Sep-23$1,357,981$608,222
Oct-23$1,304,757$670,805
Nov-23$1,434,999$676,625
Dec-23$1,207,793$602,535
Jan-24$1,323,172$593,630
Feb-24$1,437,693$580,274
SOURCE:
2024$1,379,6446.6%$587,221-3.6%
Monthly Average Sales Price Year-to-Date Average Sales Price Jan-23$1,139,294$633,441FebruarySFHYoY%chgCNDYoY%chgFebruaryYTDSFHYoY%chgYTDCNDYoY%chg Feb-23$1,427,864$592,1312022$1,486,08826.7%$583,3676.9%2022$1,364,91223.3%$605,00915.8%
Average Sales Price $0 $200,000 $400,000 $600,000 $800,000 $1,000,000 $1,200,000 $1,400,000 $1,600,000 $1,800,000 Price ($) Average Sales Price Single-Family Homes Condos 0K 500K 1.0M 1.5M 202220232024 Price ($) SFH(YTD) 0K 200K 400K 600K 800K 202220232024 Price ($) CND(YTD) 0K 500K 1.0M 1.5M 2.0M 202220232024 Price ($)
0K 200K 400K 600K 800K 202220232024 Price ($) CND(Feb)
SFH(Feb)
©2024.HonoluluBoardofREALTORS®.AllRightsReserved.Informationhereindeemedreliablebutnotguaranteed.
Honolulu Board of REALTORS®, residential resales compiled from MLS data.
Median Days on Market
February 2024
OAHU, HAWAII
(DaysonMarketrepresentsthenumberofdaysfromwhenapropertyisfirstlistedtowhenanofferisaccepted;theMedianDaysonMarketrepresentsthemedianofallsalesinagivenmonth)
Mo/Yr Single-Family HomesCondos
Feb-21918
Mar-21914
Apr-21913
May-21812
Jun-21811
Jul-21911
Aug-21912
Sep-21911
Oct-211011
Nov-21119
Dec-211113
Jan-221214
Feb-221314
Mar-2299
Apr-221012
May-221010
Jun-221011
Jul-221112
Aug-221313
Sep-221814
Oct-221919
Nov-221818
Dec-222521
Jun-231718
Jul-231616
Aug-231818
Sep-232021
SOURCE:
Median Days on Market
Median Days on Market Jan-232424FebruarySFHYoY%chgCNDYoY%chgFebruaryYTDSFHYoY%chgYTDCNDYoY%chg Feb-23472820221344.4%14-22.2%20221233.3%14-17.6% Mar-233624202347261.5%28100.0%202335191.7%2685.7% Apr-232420 202430-36.2%3939.3% 202429-17.1%3430.8% May-232120
Monthly
Year-to-Date
Feb-2430 39
Oct-231821 Nov-232923 Dec-231826 Jan-242929
0 5 10 15 20 25 30 35 40 45 50 Days on Market Median Days on Market Single-Family Homes Condos 0 10 20 30 40 202220232024 Days on Market SFH(YTD) 0 10 20 30 40 202220232024 Days on Market CND(YTD) 0 10 20 30 40 50 202220232024 Days on Market SFH(Feb) 0 10 20 30 40 50 202220232024 Days on Market CND(Feb)
Honolulu Board of REALTORS®, residential resales compiled from MLS data. ©2024.HonoluluBoardofREALTORS®.AllRightsReserved.Informationhereindeemedreliablebutnotguaranteed.
February 2024
OAHU, HAWAII
(Thepercentagefoundwhendividingaproperty'ssalespricebytheoriginallistprice;reportedpercentageisthemedianofallsalesfortheperiodindicated)
Mo/Yr Single-Family HomesCondos
Feb-21100.0%98.8%
Mar-21100.4%99.1%
Apr-21101.9%99.6%
May-21101.4%100.0%
Jun-21104.2%100.0%
Jul-21103.9%100.0%
Aug-21103.0%100.0%
Sep-21103.1%100.0%
Oct-21102.2%100.0%
Nov-21102.2%100.0%
Dec-21102.1%100.0%
Jan-22101.6%100.0%
Feb-22100.8%100.0%
Mar-22102.0%100.0%
Apr-22102.6%100.0%
May-22102.2%100.0%
Jun-22102.0%100.0%
Jul-22100.0%100.0%
Aug-22100.0%100.0%
Sep-2299.2%100.0%
Oct-2299.8%99.0%
Nov-2298.4%98.8%
May-2398.7%99.0%
Jun-2399.5%98.9%
Jul-23100.0%98.8%
Aug-2399.1%99.6%
Sep-2399.0%98.8%
SOURCE:
Percent of Original List Price Received
Jan-2395.9%98.4%FebruarySFHYoY%chgCNDYoY%chgFebruaryYTDSFHYoY%chgYTDCNDYoY%chg Feb-2396.0%98.0%2022100.8%0.8%100.0%1.2%2022101.2%0.9%100.0%1.2% Mar-2396.7%98.5%202396.0%-4.8%98.0%-2.0%202395.9%-5.2%98.1%-1.9%
Dec-2296.7%98.5% Monthly Percent of Original List Price Received Year-to-Date Percent of Original List Price Received
Apr-2398.3%98.7% 202497.8%1.9%97.9%-0.1% 202498.1%2.3%97.7%-0.4%
Oct-2398.0%98.7% Nov-2397.1%98.0% Dec-2398.3%97.9% Jan-2498.3%97.5% Feb-2497.8%97.9% 90.0% 92.0% 94.0% 96.0% 98.0% 100.0% 102.0% 104.0% 106.0% Percent Received Percent of Original List Price Received Single-Family Homes Condos 95.0% 96.0% 97.0% 98.0% 99.0% 100.0% 101.0% 202220232024 Percent Received SFH(YTD) 95.0% 96.0% 97.0% 98.0% 99.0% 100.0% 101.0% 202220232024 Percent Received CND(YTD) 95.0% 97.0% 99.0% 101.0% 103.0% 202220232024 Percent Received SFH(Feb) 95.0% 96.0% 97.0% 98.0% 99.0% 100.0% 101.0% 202220232024 Percent Received CND(Feb)
©2024.HonoluluBoardofREALTORS®.AllRightsReserved.Informationhereindeemedreliablebutnotguaranteed.
Honolulu Board of REALTORS®, residential resales compiled from MLS data.
February 2024
OAHU, HAWAII
(Acountofpropertiesthathavebeennewlylistedonthemarketinagivenmonth)
Mo-Yr
Feb-21322623945
Mar-214397151,154
Apr-214597061,165
May-214306831,113
Jun-214827841,266
Jul-214696641,133
Aug-214607211,181
Sep-214127381,150
Oct-213767171,093
Nov-21358639997
Dec-21245527772
Jan-22320666986
Feb-223677391,106
Mar-224127141,126
Apr-224247221,146
May-224456871,132
Jun-223916861,077
Jul-223866161,002
Aug-22381608989
Sep-22304601905
Oct-22285532817
Nov-22289526815
Dec-22164371535
May-23309582891
Jun-23324535859
Jul-23275521796
Aug-23330549879
Sep-23281516797 Oct-23272566838
Nov-23267457724
Dec-23180349529 Jan-24285581866
Single-Family HomesCondosTotal
Monthly New Listings Year-to-Date New Listings Jan-23268523791FebruarySFHYoY%chgCNDYoY%chgFebruaryYTDSFHYoY%chgYTDCNDYoY%chg Feb-23233463696202236714.0%73918.6%20226870.0%1,4059.6% Mar-232935308232023233-36.5%463-37.3%2023501-27.1%986-29.8% Apr-23292532824 202429526.6%53315.1% 2024 58015.8%1,11413.0%
Feb-24295 533 828
0 100 200 300 400 500 600 700 800 900 Listings New Listings Single-Family Homes Condos 0 200 400 600 800 202220232024 Closed Sales SFH(YTD) 0 500 1,000 1,500 202220232024 Closed Sales CND(YTD) 0 100 200 300 400 202220232024 New Listings SFH(Feb) 0 200 400 600 800 202220232024 Closed Sales CND(Feb)
Honolulu
REALTORS®,
©2024.HonoluluBoardofREALTORS®.AllRightsReserved.Informationhereindeemedreliablebutnotguaranteed.
New Listings
SOURCE:
Board of
residential resales compiled from MLS data.
Pending Sales*
February 2024
OAHU, HAWAII
(Ameasureofcontractactivityrepresentedbyacountofpropertiesthathavehadoffersacceptedonthemduringagivenmonth)
Mo/Yr Single-Family HomesCondosTotal
Feb-21365572937
Mar-213706561,026
Apr-214507271,177
May-214316991,130
Jun-214226661,088
Jul-214336581,091
Aug-214156171,032
Sep-213986291,027
Oct-214006301,030
Nov-21367573940
Dec-21287511798
Jan-22315574889
Feb-22316643959
Mar-223846911,075
Apr-223666631,029
May-22356601957
Jun-22305501806
Jul-22297484781
Aug-22312475787
Sep-22224436660
Oct-22198342540
Nov-22198359557
Dec-22168289457

Jan-23267378645FebruarySFHYoY%chgCNDYoY%chgFebruaryYTDSFHYoY%chgYTDCNDYoY%chg
May-23258507765
Jun-23231415646
Jul-23247421668
Aug-23267425692
Sep-23232371603
Oct-23192325517
*Methodologyupdatedasof2021toreflectacountofpropertiesthatenteredcontractwithinthegivenmonthandremaininesc
SOURCE: Honolulu Board of REALTORS®, residential resales compiled from MLS data. ©2024.HonoluluBoardofREALTORS®.AllRightsReserved.Informationhereindeemedreliablebutnotguaranteed.
Monthly Pending Sales Year-to-Date Pending Sales
Feb-232173996162022316-13.4%64312.4%2022631-9.1%1,21710.0% Mar-232584447022023217-31.3%399-37.9%2023484-23.3%777-36.2% Apr-23271438709 202426924.0%390-2.3% 20244891.0%766-1.4%
390 659
Nov-23174308482 Dec-23182290472 Jan-24220376596 Feb-24269
rowstatusattheendofthemonth(alsoappliedtohistoricaldatashownabove). PendingSales,inreportspriorto2021,reflectacountofalllistingsthatheldaPending(P)statusthroughoutthegivenmonth.
0 100 200 300 400 500 600 700 800 Listings Pending Sales Single-Family Homes Condos 0 100 200 300 400 500 600 700 202220232024 Pending Sales SFH(YTD) 0 200 400 600 800 1,000 1,200 1,400 202220232024 Pending Sales CND(YTD) 0 50 100 150 200 250 300 350 202220232024 Pending Sales SFH(Feb) 0 100 200 300 400 500 600 700 202220232024 Pending Sales CND(Feb)
Active Inventory*
February
OAHU, HAWAII
2024
(ThenumberofpropertiesinActive(A)statusattheendofthegivenmonth)
Mo/Yr Single-Family HomesCondosTotal
Feb-213501,3321,682
Mar-213791,2571,636
Apr-213811,1331,514
May-213379831,320
Jun-213771,0251,402
Jul-214159691,384
Aug-214169501,366
Sep-214371,0301,467
Oct-214011,0391,440
Nov-213661,0331,399
Dec-213099461,255
Jan-223119671,278
Feb-223489891,337
Mar-223609191,279
Apr-223959171,312
May-224719391,410
Jun-225279981,525
Jul-225761,0501,626
Aug-225961,0731,669 Active Inventory
Sep-226291,1411,770FebruarySFHYoY%chgCNDYoY%chg
Oct-226561,1941,8502022348-0.6%989-25.8%
Nov-226821,2441,926202354757.2%1,17719.0%
Dec-225971,1701,767 20245999.5%1,38817.9%
Jan-235511,1961,747
Feb-235471,1771,724
Mar-235411,1521,693
Apr-235351,1441,679
May-235431,1181,661
Jun-236051,1591,764
Jul-235911,1541,745
Aug-235981,1461,744
Sep-235921,1941,786
Oct-236261,3061,932
Nov-236721,3372,009
Dec-236001,2341,834
Jan-246071,3481,955
Total Active Inventory: Single-Family Homes + Condos
Feb-24599 1,388 1,987 *Indicatormodifiedasof2021toreflectActivestatuslistingsonlyandappliedtohistoricalmonthlydatashownabove.Previousreportindicator,referredtoasActiveListings,reflectedallactivelymarketedlistingsinAandCstatus. 0 200 400 600 800 1,000 1,200 1,400 1,600 Listings Active Inventory Single-Family Homes Condos 0 500 1,000 Active202220232024 Listings SFH(Feb) 0 500 1,000 1,500 Active202220232024 Listings CND(Feb) 0 500 1,000 1,500 2,000 2,500 Feb-21Feb-22Feb-23Feb-24 Listings Total Active Inventory Single-Family Homes + Condos Single-Family Homes Condos
Honolulu
REALTORS®,
©2024.HonoluluBoardofREALTORS®.AllRightsReserved.Informationhereindeemedreliablebutnotguaranteed.
SOURCE:
Board of
residential resales compiled from MLS data.
Total Inventory In Escrow*
February 2024
OAHU, HAWAII
(Thenumberofpropertiesundercontractattheendofthegivenmonth/combinedlistingsinCandPstatus)
Mo/Yr Single-Family HomesCondosTotal
Feb-216979601,657
Mar-216919791,670
Apr-217391,0301,769
May-217931,1571,950
Jun-217541,0681,822
Jul-217351,0261,761
Aug-217279791,706
Sep-216609511,611
Oct-216639351,598
Nov-216378991,536
Dec-215287841,312
Jan-224987971,295
Feb-225449461,490
Mar-226039801,583
Apr-225929561,548
May-225838561,439
Jun-225097281,237
Jul-224796761,155
Aug-224626541,116
Sep-22388590978FebruarySFHYoY%chgCNDYoY%chg
Oct-223455068512022544-22.0%946-1.5%
Nov-223195128312023386-29.0%592-37.4%
Dec-22278430708 20244167.8%586-1.0%
Jan-23376523899
Feb-23386592978
Mar-23393602995
Apr-234356231,058
May-234186861,104
Jun-23370612982
Jul-23383586969
Aug-23391590981
Sep-23383569952
Oct-23333475808
Nov-23312473785
Dec-23305468773
Jan-24334532866
Total Inventory In Escrow
Total Inventory In Escrow: Single-Family Homes + Condos
Feb-24416 586 1,002 *Newindicatoraddedtoreportsasof2021,includingapplicablehistoricaldata. 0 200 400 600 800 1,000 1,200 1,400 Listings
Single-Family Homes Condos 0 200 400 600 202220232024 Listings SFH(Feb) 0 500 1,000 202220232024 Listings CND(Feb) 0 500 1,000 1,500 2,000 2,500 Feb-21Feb-22Feb-23Feb-24 Listings
Inventory In Escrow Single-Family Homes + Condos Single-Family Homes Condos
Total Inventory In Escrow
Total
©2024.HonoluluBoardofREALTORS®.AllRightsReserved.Informationhereindeemedreliablebutnotguaranteed.
SOURCE: Honolulu Board of REALTORS®, residential resales compiled from MLS data.
Months Supply of Active Inventory*
February 2024
OAHU, HAWAII (Comparesactiveinventorytoarolling12-monthaverageclosedsales)
Feb-211.13.3
Mar-211.23.0
Apr-211.12.5
May-211.02.1
Jun-211.02.0
Jul-211.11.8
Aug-211.11.7
Sep-211.21.8
Oct-211.11.8
Nov-211.01.7
Dec-210.81.6
Jan-220.81.6
Feb-220.91.6
Mar-221.01.5
Apr-221.11.5
May-221.31.5
Jun-221.51.6
Jul-221.61.7
Aug-221.71.8
Jan-232.02.4
Feb-232.02.4
Mar-232.12.4
Apr-232.12.5
May-232.22.6
Jun-232.62.8
Jul-232.62.8
Aug-232.72.8
Sep-232.73.0
Oct-232.93.3
SOURCE:
Mo/Yr Single-Family HomesCondos
Oct-222.12.120220.9-18.2%1.6-51.5% Nov-222.22.320232.0122.2%2.450.0%
20242.840.0%3.650.0%
Months Supply of Active Inventory Active Inventory vs. Closed Sales Sep-221.92.0FebruarySFHYoY%chgCNDYoY%chg
Dec-222.12.2
Nov-233.13.4 Dec-232.83.2 Jan-242.83.5 Feb-242.8 3.6
MonthsofInventory,inreportspriorto2021,reflectacomparisonofactivelistingstoaveragependingsales. 0.0 0.5 1.0 1.5 2.0 2.5 3.0 3.5 4.0 Months of Inventory
of Active Inventory Single-Family Homes Condos 0 1 2 3 Months202220232024 of Inventory SFH(Feb) 0 2 4 Months202220232024 of Inventory CND(Feb) 0 200 400 600 800 Feb-21Feb-22Feb-23Feb-24 Sales/Listings Single-Family Homes Active Closed 0 500 1,000 1,500 Feb-21Feb-22Feb-23Feb-24 Sales/Listings Condos Active Closed
*Methodologyupdatedasof2021(alsoappliedtohistoricaldatashownonthischart).
Months Supply
Honolulu Board of REALTORS®, residential resales compiled from MLS data. ©2024.HonoluluBoardofREALTORS®.AllRightsReserved.Informationhereindeemedreliablebutnotguaranteed.

$1,500,000 - 1,999,999 191346.2%1011-9.1%96.8%97.5%-0.7%37348.8%382272.7%897321.9%554037.5%3.62.356.5% $2,000,000 - $2,999,999 191711.8%1556-73.2%100.0%91.1%9.8%2325-8.0%231553.3%61577.0%292611.5%4.13.228.1%
$3,000,000 and above 912-25.0%11235220.0%95.7%91.5%4.6%1115-26.7%1113-15.4%958511.8%1623-30.4%10.66.563.1%
All Single-Family Homes1791733.5%3047-36.2%97.8%96.0%1.9%29523326.6%26921724.0%5995479.5%4163867.8%2.82.040.0%
$600,000 - $699,999 462958.6%32313.2%98.4%98.4%0.0%554327.9%49482.1%119122-2.5%6971-2.8%2.52.38.7%
$700,000 - $999,999 51486.3%2123-8.7%97.9%98.4%-0.5%8081-1.2%5763-9.5%2262155.1%9297-5.2%3.72.548.0%
$1,000,000 - $1,499,999 231464.3%3260-46.7%98.3%95.9%2.5%282512.0%1718-5.6%1171079.3%2833-15.2%5.94.531.1%
$1,500,000 - $1,999,999 45-20.0%2854-48.1%99.5%91.8%8.4%13130.0%914-35.7%6472-11.1%1017-41.2%9.19.01.1% $2,000,000
SOURCE: Honolulu Board of REALTORS®, residential resales compiled from MLS data. ©2024.HonoluluBoardofREALTORS®.AllRightsReserved.Informationhereindeemedreliablebutnotguaranteed.
Supply Overview
2024 OAHU, HAWAII (Ayear-over-yearoverviewoftheavailabilityandsalesofpropertiesinagivenmonth,bypricerange) Single-Family HomesFeb-24Feb-23%chgFeb-24Feb-23%chgFeb-24Feb-23%chgFeb-24Feb-23%chgFeb-24Feb-23%chgFeb-24Feb-23%chgFeb-24Feb-23 %chgFeb-24Feb-23%chg $449,999 and below 23-33.3%37348.8%73.9%102.6%-28.0%30-51400.0%63100.0%7616.7%3.01.5100.0% $450,000 - $599,999 36-50.0%997728.6%96.7%91.9%5.2%10100.0%71600.0%1921-9.5%157114.3%3.83.58.6% $600,000 - $699,999 79-22.2%2059-66.1%96.4%97.1%-0.7%131118.2%1112-8.3%2324-4.2%1622-27.3%2.32.7-14.8% $700,000 - $799,999 21210.0%2875-62.7%97.2%91.3%6.5%16156.7%19185.6%3138-18.4%372927.6%1.61.8-11.1% $800,000 - $899,999 2028-28.6%4214200.0%98.3%98.9%-0.6%472588.0%382740.7%69664.5%605215.4%2.21.915.8% $900,000 - $999,999 1921-9.5%3260-46.7%98.4%98.4%0.0%35342.9%3233-3.0%654932.7%5259-11.9%2.31.376.9% $1,000,000 - $1,499,999 604339.5%2652-50.0%98.0%96.5%1.6%1006456.3%857513.3%1411317.6%1291225.7%2.01.353.8%
Housing
February
CondosFeb-24Feb-23%chgFeb-24Feb-23%chgFeb-24Feb-23%chgFeb-24Feb-23%chgFeb-24Feb-23%chgFeb-24Feb-23%chgFeb-24Feb-23%chgFeb-24Feb-23%chg $149,999 and below 141040.0%322152.4%96.0%95.2%0.8%1320-35.0%1416-12.5%3841-7.3%2126-19.2%2.92.90.0% $150,000 - $299,999 3141-24.4%452860.7%95.6%97.5%-1.9%52512.0%42420.0%1471442.1%736119.7%3.42.441.7% $300,000 - $399,999 5566-16.7%483250.0%97.0%98.0%-1.0%1006749.3%746513.8%21212372.4%1039212.0%3.51.6118.8% $400,000 - $499,999 5767-14.9%342725.9%100.0%99.0%1.0%1068721.8%66651.5%21915937.7%98953.2%3.41.888.9% $500,000 - $599,999 503831.6%483537.1%98.2%97.4%0.8%68646.3%5560-8.3%14710737.4%8290-8.9%2.51.478.6%
All Condos3343252.8%392839.3%97.9%98.0%-0.1%53346315.1%390399-2.3%1,3881,17717.9%586592-1.0%3.62.450.0% Active Inventory Active Inventory Closed SalesMedian Days on Market Percent of Original List Price ReceivedPending Sales Closed SalesMedian Days on Market Percent of Original List Price ReceivedPending Sales New Listings New Listings In Escrow Months Supply of Active Inventory Total Inventory In Escrow Months Supply of Active Inventory Total Inventory
and above 37-57.1%905273.1%89.8%100.0%-10.2%181250.0%78-12.5%998713.8%10100.0%14.19.745.4%
Closed Sales by Price Range: Single-Family Homes
February 2024
OAHU, HAWAII
(Acountofpropertiesthathaveclosedinagivenmonth) Single-Family
$449,999andbelow23-33.3%28280.0%
$450,000-$599,99936-50.0%6369-8.7%
$600,000-$699,99979-22.2%11810413.5%
$700,000-$799,99921210.0%231247-6.5%
$800,000-$899,9992028-28.6%384412-6.8%
$900,000-$999,9991921-9.5%332448-25.9%
$1,000,000-$1,499,999604339.5%8591,170-26.6%
$1,500,000-1,999,999191346.2%305387-21.2%
$2,000,000-$2,999,999191711.8%174215-19.1%
$3,000,000andabove912-25.0%106150-29.3%
All Single-Family Homes 1791733.5%2,6003,230-19.5%
This12-monthperiodreflectstheconsecutive12-monthperiodupthroughthecurrentmonth,whilelastperiod reflectsthesame12-monthperiodoneyearprior.
SOURCE:


1,999,999 $2,000,000$2,999,999

HomesFeb-24Feb-23%chg 12-mth Total This Period 12-mth Total Last Period%chg
0 10 20 30 40 50 60 70 $449,999 and below $450,000$599,999 $600,000$699,999 $700,000$799,999 $800,000
$899,999 $900,000
$1,000,000
$1,500,000
$3,000,000 and above Closed Sales Sold Price Closed Sales by Price Range 1-mth Period: Single-Family Homes Feb-24 Feb-23 0 200 400 600 800 1,000 1,200 1,400 $449,999 and below $450,000$599,999 $600,000$699,999 $700,000$799,999 $800,000$899,999 $900,000$999,999 $1,000,000$1,499,999 $1,500,0001,999,999 $2,000,000$2,999,999 $3,000,000 and above Closed Sales Sold Price Closed Sales by Price Range 12-mth Period: Single-Family Homes 12-mth Total This Period 12-mth Total Last Period
-
$999,999
$1,499,999
Honolulu Board of REALTORS®, residential resales compiled from MLS data. ©2024.HonoluluBoardofREALTORS®.AllRightsReserved.Informationhereindeemedreliablebutnotguaranteed.
Closed Sales by Price Range: Condos
February 2024
OAHU, HAWAII
(Acountofpropertiesthathaveclosedinagivenmonth)
12-mth
This Period
$150,000-$299,9993141-24.4%518720-28.1%
$300,000-$399,9995566-16.7%725948-23.5%
$400,000-$499,9995767-14.9%7711,030-25.1%
$500,000-$599,999503831.6%723882-18.0%
$600,000-$699,999462958.6%561640-12.3%
$700,000-$999,99951486.3%7331,024-28.4%
$1,000,000-$1,499,999231464.3%239292-18.2%
$1,500,000-$1,999,99945-20.0%89101-11.9%
$2,000,000andabove37-57.1%81110-26.4%
All Condos 3343252.8%4,5995,915-22.2%
0 10 20 30 40 50 60 70 80 $149,999 and below $150,000$299,999 $300,000$399,999 $400,000$499,999 $500,000$599,999 $600,000$699,999 $700,000$999,999 $1,000,000

$1,499,999

Total
Condos Feb-24Feb-23%chg 12-mth Total Last Period%chg
$149,999andbelow141040.0%159168-5.4%
$1,500,000
and above Closed Sales Sold Price Closed Sales by Price Range 1-mth Period: Condos Feb-24 Feb-23 0 200 400 600 800 1,000 1,200 $149,999 and below $150,000$299,999 $300,000$399,999 $400,000$499,999 $500,000$599,999 $600,000$699,999 $700,000$999,999 $1,000,000$1,499,999 $1,500,000$1,999,999 $2,000,000 and above Closed Sales Sold Price Closed Sales by Price Range 12-mth Period: Condos 12-mth Total This Period 12-mth Total Last Period
This12-monthperiodreflectstheconsecutive12-monthperiodupthroughthecurrentmonth,whilelastperiod reflectsthesame12-monthperiodoneyearprior.
$1,999,999 $2,000,000
Honolulu Board of REALTORS®, residential resales compiled from MLS data. ©2024.HonoluluBoardofREALTORS®.AllRightsReserved.Informationhereindeemedreliablebutnotguaranteed.
SOURCE:
Median Days on Market by Price Range: Single-Family Homes
February 2024
OAHU, HAWAII
(Themediannumberofdaysfromwhenapropertyisfirstlistedtowhenanofferisaccepted)
$449,999andbelow37348.8%3110210.0%
$450,000-$599,999997728.6%4416175.0%
$600,000-$699,9992059-66.1%3918116.7%
$700,000-$799,9992875-62.7%241833.3%
$800,000-$899,9994214200.0%2812133.3%
$900,000-$999,9993260-46.7%211190.9%
$1,000,000-$1,499,9992652-50.0%181163.6%
$1,500,000-1,999,9991011-9.1%171241.7%
$2,000,000-$2,999,9991556-73.2%14137.7%
$3,000,000andabove11235220.0%412846.4%
All Single-Family Homes 3047-36.2%211275.0%
This12-monthperiodreflectstheconsecutive12-monthperiodupthroughthecurrentmonth,whilelastperiod reflectsthesame12-monthperiodoneyearprior.
Median Days on Market by Price Range
1-mth Period: Single-Family Homes Feb-24 Feb-23

$999,999
$1,499,999
1,999,999 $2,000,000$2,999,999 $3,000,000 and above
Median Days on Market by Price Range
SOURCE: Honolulu Board of REALTORS®, residential resales compiled from MLS data.
©2024.HonoluluBoardofREALTORS®.AllRightsReserved.Informationhereindeemedreliablebutnotguaranteed.

HomesFeb-24Feb-23%chg 12-mth Median This Period 12-mth Median Last Period%chg
Single-Family
0 20 40 60 80 100 120 $449,999 and below $450,000$599,999 $600,000$699,999 $700,000
$799,999 $800,000
$1,000,000
Days on Market Sold Price
-
$899,999 $900,000
$1,500,000
0 5 10 15 20 25 30 35 40 45 50 $449,999 and below $450,000$599,999 $600,000$699,999 $700,000$799,999 $800,000$899,999 $900,000$999,999 $1,000,000$1,499,999 $1,500,000
$2,000,000
$3,000,000
Days on Market Sold Price
1,999,999
$2,999,999
and above
12-mth Median This Period 12-mth Median Last Period
12-mth Period: Single-Family Homes
Median Days on Market by Price Range: Condos
February 2024
OAHU, HAWAII
(Themediannumberofdaysfromwhenapropertyisfirstlistedtowhenanofferisaccepted)
Median Days on Market by Price Range
1-mth Period:
$149,999andbelow322152.4%352729.6%
$150,000-$299,999452860.7%221822.2%
$300,000-$399,999483250.0%211361.5%
$400,000-$499,999342725.9%171241.7%
$500,000-$599,999483537.1%191172.7%
$600,000-$699,99932313.2%221283.3%
$700,000-$999,9992123-8.7%2211100.0%
$1,000,000-$1,499,9993260-46.7%322152.4%
$1,500,000-$1,999,9992854-48.1%423231.3%

$299,999 $300,000$399,999 $400,000$499,999 $500,000$599,999 $600,000$699,999 $700,000$999,999 $1,000,000$1,499,999 $1,500,000$1,999,999 $2,000,000 and above
Median Days on Market by Price Range

$2,000,000andabove905273.1%533839.5%
All Condos 392839.3%211361.5%
This12-monthperiodreflectstheconsecutive12-monthperiodupthroughthecurrentmonth,whilelastperiod reflectsthesame12-monthperiodoneyearprior.
SOURCE: Honolulu Board of REALTORS®, residential resales compiled from MLS data.
Condos Feb-24Feb-23%chg 12-mth Median This Period 12-mth Median Last Period%chg
0 10 20 30 40 50 60 70 80 90 100 $149,999
$150,000
Days on Market Sold Price
and below
Condos Feb-24 Feb-23 0 10 20 30 40 50 60 $149,999 and below $150,000$299,999 $300,000$399,999 $400,000$499,999 $500,000$599,999 $600,000$699,999 $700,000$999,999 $1,000,000$1,499,999 $1,500,000$1,999,999 $2,000,000 and above Days on Market Sold Price
Condos 12-mth Median This Period 12-mth Median Last Period
12-mth Period:
©2024.HonoluluBoardofREALTORS®.AllRightsReserved.Informationhereindeemedreliablebutnotguaranteed.
Median Percent of Original List Price Received by Price Range: Single-Family Homes
February 2024
OAHU, HAWAII (Thepercentagefoundwhendividingaproperty'ssalespricebytheoriginallistprice;reportedpercentageisthemedianofallsalesfortheperiodandpricerangeindicated)
Median Percent of Original List Price Received by Price Range 1-mth Period: Single-Family Homes Feb-24 Feb-23

$449,999 and below $450,000$599,999 $600,000$699,999 $700,000$799,999 $800,000$899,999 $900,000$999,999 $1,000,000$1,499,999 $1,500,0001,999,999 $2,000,000$2,999,999 $3,000,000 and above
$1,500,000-1,999,99996.8%97.5%-0.7%99.5%100.1%-0.6%
$2,000,000-$2,999,999100.0%91.1%9.8%98.4%100.0%-1.6%
$3,000,000andabove95.7%91.5%4.6%95.5%97.3%-1.8%
All Single-Family Homes 97.8%96.0%1.9%98.4%100.0%-1.6%
This12-monthperiodreflectstheconsecutive12-monthperiodupthroughthecurrentmonth,whilelastperiod reflectsthesame12-monthperiodoneyearprior.
SOURCE: Honolulu Board of REALTORS®, residential resales compiled from MLS data. ©2024.HonoluluBoardofREALTORS®.AllRightsReserved.Informationhereindeemedreliablebutnotguaranteed.
Median Percent of Original List Price Received by Price Range
12-mth Period: Single-Family Homes

and below $450,000$599,999 $600,000$699,999 $700,000$799,999 $800,000$899,999 $900,000$999,999 $1,000,000$1,499,999 $1,500,0001,999,999 $2,000,000$2,999,999 $3,000,000 and above
Single-Family HomesFeb-24Feb-23%chg 12-mth Median This Period 12-mth Median Last Period%chg $449,999andbelow73.9%102.6%-28.0%92.5%100.0%-7.5% $450,000-$599,99996.7%91.9%5.2%97.4%97.4%0.0% $600,000-$699,99996.4%97.1%-0.7%96.7%100.0%-3.3% $700,000-$799,99997.2%91.3%6.5%98.4%100.0%-1.6% $800,000-$899,99998.3%98.9%-0.6%98.8%100.0%-1.2% $900,000-$999,99998.4%98.4%0.0%99.0%100.2%-1.2% $1,000,000-$1,499,99998.0%96.5%1.6%98.5%100.0%-1.5%
80.0% 85.0% 90.0% 95.0% 100.0% 105.0%
Percent Orig. LP Received Sold Price
80.0% 85.0% 90.0% 95.0% 100.0% 105.0% $449,999
Percent Orig. LP Received Sold Price
12-mth Median This Period 12-mth Median Last Period
Median Percent of Original List Price Received by Price Range: Condos
February 2024
OAHU, HAWAII
(Thepercentagefoundwhendividingaproperty'ssalespricebytheoriginallistprice;reportedpercentageisthemedianofallsalesfortheperiodandpricerangeindicated)
Median Percent of Original List Price Received by Price Range
1-mth Period: Condos Feb-24 Feb-23
$149,999andbelow96.0%95.
$150,000-$299,99995.6%97.5%-1
$300,000-$399,99997.0%98.0%-1
$400,000-$499,999100.0%99.0%1.0%99.0%100.0%-1.0% $500,000-$599,99998.2%97.4%0.8%99.4%100.0%-0.6%
$600,000-$699,99998.4%98.4%0.0%98.8%100.0%-1.2%
$700,000-$999,99997.9%98.4%-0
$1,000,000-$1,499,99998.3%95.9%2.5%96.2%97.6%-1.4%
$1,500,000-$1,999,99999.5%91.8%8.4%96.8%97.0%-0.2%
$2,000,000andabove89.8%100.0%-10.2%95.7%95.7%0.0%
All Condos 97.9%98.0%-0.1%98.5%100.0%-1.5% This12-monthperiodreflectstheconsecutive12-monthperiodupthroughthecurrentmonth,whilelastperiod reflectsthesame12-monthperiodoneyearprior.
$149,999 and below $150,000$299,999 $300,000$399,999 $400,000$499,999 $500,000$599,999 $600,000$699,999 $700,000$999,999 $1,000,000$1,499,999 $1,500,000$1,999,999 $2,000,000 and above
SOURCE: Honolulu Board of REALTORS®, residential resales compiled from MLS data. ©2024.HonoluluBoardofREALTORS®.AllRightsReserved.Informationhereindeemedreliablebutnotguaranteed.
Median Percent of Original List Price Received by Price Range
12-mth Period: Condos
$149,999 and below $150,000$299,999 $300,000$399,999 $400,000$499,999 $500,000$599,999 $600,000$699,999 $700,000$999,999 $1,000,000$1,499,999 $1,500,000$1,999,999 $2,000,000 and above
Condos Feb-24Feb-23%chg 12-mth Median This Period 12-mth Median Last Period%chg
2%0.8%93.3%96.1%-2.9%
.9%97.8%98.7%-0.9%
.0%98.6%100.0%-1.4%
.5%98.8%100.0%-1.2%
84.0% 86.0% 88.0% 90.0% 92.0% 94.0% 96.0% 98.0% 100.0% 102.0%
Percent Orig. LP Received Sold Price
84.0% 86.0% 88.0% 90.0% 92.0% 94.0% 96.0% 98.0% 100.0% 102.0%
Percent Orig. LP Received Sold Price
Period
Last
12-mth Median This
12-mth Median
Period

February 2024
OAHU, HAWAII
(Acountofpropertiesthathavebeennewlylistedonthemarketinagivenmonth)
$449,999andbelow30-27270.0%
$450,000-$599,99910100.0%77770.0%
$600,000-$699,999131118.2%135163-17.2%
$700,000-$799,99916156.7%280298-6.0%
$800,000-$899,999472588.0%461506-8.9%
$900,000-$999,99935342.9%437566-22.8%
$1,000,000-$1,499,9991006456.3%1,0301,250-17.6%
$1,500,000-1,999,99937348.8%474509-6.9%
$2,000,000-$2,999,9992325-8.0%252308-18.2%
$3,000,000andabove1115-26.7%230278-17.3%
All Single-Family Homes29523326.6%3,4033,982-14.5%
This12-monthperiodreflectstheconsecutive12-monthperiodupthroughthecurrentmonth,whilelastperiod reflectsthesame12-monthperiodoneyearprior.
SOURCE: Honolulu Board of REALTORS®, residential resales compiled from MLS data.
New Listings by Price Range
1-mth

Feb-24 Feb-23

-
$700,000$799,999 $800,000$899,999 $900,000$999,999 $1,000,000$1,499,999 $1,500,0001,999,999 $2,000,000$2,999,999
New Listings by Price Range
12-mth Period: Single-Family Homes

New Listings by Price Range: Single-Family Homes
Single-Family HomesFeb-24Feb-23%chg 12-mth Total This Period 12-mth Total Last Period %chg
0 20 40 60 80 100 120 $449,999 and below $450,000
$599,999
New Listings Original List Price
-
$600,000
$699,999
$3,000,000 and above
Period: Single-Family Homes
0 200 400 600 800 1,000 1,200 1,400 $449,999 and below $450,000$599,999 $600,000$699,999 $700,000$799,999 $800,000$899,999 $900,000$999,999 $1,000,000$1,499,999 $1,500,000
$2,000,000
New Listings Original List Price
1,999,999
$2,999,999 $3,000,000 and above
12-mth Total This
12-mth Total Last Period
Period
©2024.HonoluluBoardofREALTORS®.AllRightsReserved.Informationhereindeemedreliablebutnotguaranteed.
New Listings by Price Range: Condos
February 2024
OAHU, HAWAII
(Acountofpropertiesthathavebeennewlylistedonthemarketinagivenmonth)
$149,999andbelow1320-35.0%171186-8.1%
$150,000-$299,99952512.0%680852-20.2%
$300,000-$399,9991006749.3%9621,067-9.8%
$400,000-$499,9991068721.8%1,0411,153-9.7%
$500,000-$599,99968646.3%932959-2.8%
$600,000-$699,999554327.9%714776-8.0%
$700,000-$999,9998081-1.2%9881,265-21.9%
$1,000,000-$1,499,999282512.0%396413-4.1%
$1,500,000-$1,999,99913130.0%169190-11.1%
$2,000,000andabove181250.0%1981885.3%
All Condos 53346315.1%6,2517,049-11.3%
This12-monthperiodreflectstheconsecutive12-monthperiodupthroughthecurrentmonth,whilelastperiod reflectsthesame12-monthperiodoneyearprior.
SOURCE: Honolulu Board of REALTORS®, residential resales compiled from MLS data.
New
and below $150,000$299,999 $300,000$399,999 $400,000$499,999 $500,000$599,999 $600,000$699,999 $700,000$999,999 $1,000,000$1,499,999 $1,500,000 -
New
Condos Feb-24Feb-23%chg 12-mth Total This Period 12-mth Total Last Period %chg
0 20 40 60 80 100 120 $149,999
New Listings Original List Price
$1,999,999 $2,000,000 and above
Period: Condos
Feb-23 0 200 400 600 800 1,000 1,200 1,400 $149,999 and below $150,000$299,999 $300,000$399,999 $400,000$499,999 $500,000$599,999 $600,000$699,999 $700,000$999,999 $1,000,000
$1,499,999 $1,500,000
New Listings Original List Price
Listings by Price Range 1-mth
Feb-24
-
$1,999,999 $2,000,000 and above
Period: Condos 12-mth Total This Period 12-mth Total Last Period
Listings by Price Range 12-mth
©2024.HonoluluBoardofREALTORS®.AllRightsReserved.Informationhereindeemedreliablebutnotguaranteed.
Pending Sales by Price Range: Single-Family Homes
February 2024
OAHU, HAWAII
(Ameasureofcontractactivity/acountofpropertiesthathavehadoffersacceptedontheminagivenmonth) Single-Family
$449,999andbelow51400.0%2333-30.3%
$450,000-$599,99971600.0%847216.7%
$600,000-$699,9991112-8.3%122156-21.8%
$700,000-$799,99919185.6%279287-2.8%
$800,000-$899,999382740.7%431456-5.5%
$900,000-$999,9993233-3.0%352484-27.3%
$1,000,000-$1,499,999857513.3%8861,115-20.5%
$1,500,000-1,999,999382272.7%344347-0.9%
$2,000,000-$2,999,999231553.3%169208-18.8%
$3,000,000andabove1113-15.4%111134-17.2%
All Single-Family Homes 26921724.0%2,8013,292-14.9%
This12-monthperiodreflectstheconsecutive12-monthperiodupthroughthecurrentmonth,whilelastperiod reflectsthesame12-monthperiodoneyearprior.
Pending Sales by Price Range

$699,999
$799,999 $800,000$899,999 $900,000$999,999 $1,000,000$1,499,999 $1,500,0001,999,999
Pending Sales by Price Range
SOURCE: Honolulu Board of REALTORS®, residential resales compiled from MLS data.
HomesFeb-24Feb-23%chg 12-mth Total This Period 12-mth Total Last Period%chg
0 10 20 30 40 50 60 70 80 90 $449,999 and below $450,000
$600,000
$2,000,000
$2,999,999 $3,000,000 and above Pending Sales Current List Price
$599,999
$700,000
-
1-mth Period: Single-Family Homes Feb-24 Feb-23 0 200 400 600 800 1,000 1,200 $449,999 and below $450,000$599,999 $600,000$699,999 $700,000$799,999 $800,000$899,999 $900,000$999,999 $1,000,000$1,499,999 $1,500,0001,999,999 $2,000,000$2,999,999 $3,000,000 and above Pending Sales Current List Price
12-mth Period: Single-Family Homes 12-mth Total This Period 12-mth Total Last Period
©2024.HonoluluBoardofREALTORS®.AllRightsReserved.Informationhereindeemedreliablebutnotguaranteed.
Pending Sales by Price Range: Condos
February 2024
OAHU, HAWAII
(Ameasureofcontractactivity/acountofpropertiesthathavehadoffersacceptedontheminagivenmonth)
$149,999andbelow1416-12.5%154171-9.9%
$150,000-$299,99942420.0%549701-21.7%
$300,000-$399,999746513.8%767952-19.4%
$400,000-$499,99966651.5%805985-18.3%
$500,000-$599,9995560-8.3%738793-6.9%
$600,000-$699,99949482.1%573649-11.7%
$700,000-$999,9995763-9.5%728912-20.2%
$1,000,000-$1,499,9991718-5.6%225259-13.1%
$1,500,000-$1,999,999914-35.7%7899-21.2%
$2,000,000andabove78-12.5%9397-4.1%
All Condos 390399-2.3%4,7105,618-16.2%
This12-monthperiodreflectstheconsecutive12-monthperiodupthroughthecurrentmonth,whilelastperiod reflectsthesame12-monthperiodoneyearprior.
SOURCE:
Pending
$399,999 $400,000$499,999 $500,000$599,999 $600,000$699,999 $700,000$999,999 $1,000,000$1,499,999 $1,500,000
Feb-24Feb-23%chg
Total
12-mth Total
Period%chg
Condos
12-mth
This Period
Last
0 10 20 30 40 50 60 70 80 $149,999 and below $150,000
$299,999
$1,999,999 $2,000,000 and above Pending Sales Current List Price
-
$300,000
Sales by Price Range 1-mth Period: Condos Feb-24 Feb-23 0 200 400 600 800 1,000 1,200 $149,999 and below $150,000$299,999 $300,000$399,999 $400,000$499,999 $500,000$599,999 $600,000$699,999 $700,000$999,999 $1,000,000$1,499,999 $1,500,000$1,999,999 $2,000,000 and above Pending Sales Current List Price
Sales by Price Range 12-mth Period: Condos 12-mth Total This Period 12-mth Total Last Period
Pending
REALTORS®,
©2024.HonoluluBoardofREALTORS®.AllRightsReserved.Informationhereindeemedreliablebutnotguaranteed.
Honolulu Board of
residential resales compiled from MLS data.
Active Inventory* by Price Range: Single-Family Homes
February 2024
OAHU, HAWAII
(Thenumberofpropertiesactiveonmarketattheendofagivenmonth)
Single-Family HomesFeb-24Feb-23YOY chg
$449,999andbelow63100.0%
$450,000-$599,9991921-9.5%
$600,000-$699,9992324-4.2%
$700,000-$799,9993138-18.4%
$800,000-$899,99969664.5%
$900,000-$999,999654932.7%
$1,000,000-$1,499,9991411317.6%
$1,500,000-1,999,999897321.9%
$2,000,000-$2,999,99961577.0%
$3,000,000andabove958511.8%
All Single-Family Homes 5995479.5%
Active Inventory by Price Range
Single-Family Homes
Feb-24 Feb-23

$449,999 and below $450,000$599,999 $600,000$699,999 $700,000$799,999 $800,000$899,999 $900,000$999,999 $1,000,000$1,499,999 $1,500,0001,999,999 $2,000,000$2,999,999 $3,000,000 and above
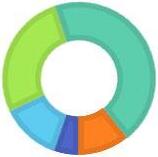
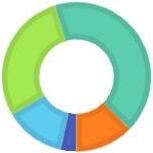
Active Inventory - Percent Share by Price Range (portionoftotalactivestatuslistingsrepresentedbyagivenpricerange)
$599,999 and below
$600,000 to $799,999
$800,000 to $999,999
$1,000,000 to $1,999,999
$2,000,000 and above
FEB-23
$599,999 and below
$600,000 to $799,999
$800,000 to $999,999
$1,000,000 to $1,999,999
$2,000,000 and above
*Indicatormodifiedasof2021toreflectActivestatuslistingsonlyandappliedtohistoricalmonthlydatashownabove.Previousreportindicator,referredtoasActiveListings,reflectedallactivelymarketedlistingsinAandC status.
SOURCE: Honolulu Board of REALTORS®, residential resales compiled from MLS data. ©2024.HonoluluBoardofREALTORS®.AllRightsReserved.Informationhereindeemedreliablebutnotguaranteed.
0 20 40 60 80 100 120 140 160
Active Listings Current List Price
5% 11% 21% 37% 26%
4% 9% 22% 39% 26% FEB-24
Active Inventory* by Price Range: Condos
February 2024
OAHU, HAWAII
(Thenumberofpropertiesactiveonmarketattheendofagivenmonth)
Condos Feb-24Feb-23YOY chg
$149,999andbelow3841-7.3%
$150,000-$299,9991471442.1%
$300,000-$399,99921212372.4%
$400,000-$499,99921915937.7%
$500,000-$599,99914710737.4%
$600,000-$699,999119122-2.5%
$700,000-$999,9992262155.1%
$1,000,000-$1,499,9991171079.3%
$1,500,000-$1,999,9996472-11.1%
$2,000,000andabove998713.8%
All Condos 1,3881,17717.9%

$149,999 and below $150,000$299,999 $300,000$399,999 $400,000$499,999 $500,000$599,999 $600,000$699,999 $700,000$999,999 $1,000,000$1,499,999 $1,500,000$1,999,999 $2,000,000 and above
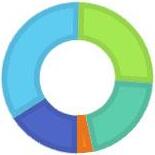
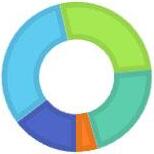
Active Inventory - Percent Share by Price Range (portionoftotalactivestatuslistingsrepresentedbyagivenpricerange)
$299,999 and below
$300,000 to $499,999
$500,000 to $699,999
$700,000 to $1,499,999
$1,500,000 and above
$299,999 and below
$300,000 to $499,999
$500,000 to $699,999
$700,000 to $1,499,999
$1,500,000 and above
*Indicatormodifiedasof2021toreflectActivestatuslistingsonlyandappliedtohistoricalmonthlydatashownabove.Previousreportindicator,referredtoasActiveListings,reflectedallactivelymarketedlistingsinAandC status.
SOURCE: Honolulu Board of REALTORS®, residential resales compiled from MLS data. ©2024.HonoluluBoardofREALTORS®.AllRightsReserved.Informationhereindeemedreliablebutnotguaranteed.
0 50 100 150 200 250
Active Listings Current List Price
Condos Feb-24
16% 24% 19% 27% 14% FEB-23
Active Inventory by Price Range
Feb-23
13% 31% 19% 25% 12% FEB-24


$599,999 and below
$600,000 to $799,999
$800,000 to $999,999
$1,000,000 to $1,999,999
$2,000,000 and above

SOURCE: Honolulu Board of REALTORS®, residential resales compiled from MLS data. ©2024.HonoluluBoardofREALTORS®.AllRightsReserved.Informationhereindeemedreliablebutnotguaranteed.
$299,999 and below
$300,000 to $499,999
$500,000 to $699,999
$700,000 to $1,499,999
$1,500,000 and above
Active Inventory*: Single-Family Homes and Condos February 2024 OAHU,
Single-Family Homes F-22M-22A-22M-22J-22J-22A-22S-22O-22N-22D-22J-23F-23M-23A-23M-23J-23J-23A-23S-23O-23N-23D-23J-24F-24 $599,999 and below 1111101415128101416151224181513182117151321262525 $600,000 to $799,999 40382738465957648094676562695560666870717182615854 $800,000 to $999,999 4952719399113128133157148143121115127117117130121127121143138114119134 $1,000,000 to $1,999,999 139139160193218226236251243251216207204191201209240229238233247260234235230 $2,000,000 and above 109120127133149166167171162173156146142136147144151152146152152171165170156 Total 348360395471527576596629656682597551547541535543605591598592626672600607599 Condos F-22M-22A-22M-22J-22J-22A-22S-22O-22N-22D-22J-23F-23M-23A-23M-23J-23J-23A-23S-23O-23N-23D-23J-24F-24 $299,999 and below 204188194187199188176184183189185179185183182184177177170180196177152186185 $300,000 to $499,999 243205194219229238243263267292261277282251251252273272287314352363349386431 $500,000 to $699,999 183165161162171172196250274272245243229251244236252233243234266296264273266 $700,000 to $1,499,999 232232240253271328330317325340318329322308307289309323301304333337315343343 $1,500,000 and above 127129128118128124128127145151161168159159160157148149145162159164154160163 Total 9899199179399981,0501,0731,1411,1941,2441,1701,1961,1771,1521,1441,1181,1591,1541,1461,1941,3061,3371,2341,3481,388
0 50 100 150 200 250 300 Feb-22 Feb-23 Feb-24 Listings
Inventory Single-Family Homes
HAWAII
*Indicatormodifiedasof2021toreflectActivestatuslistingsonlyandappliedtohistoricalmonthlydatashownabove.Previousreportindicator,referredtoasActiveListings,reflectedallactivelymarketedlistingsinAandCstatus.
Active
0 50 100 150 200 250 300 350 400 450 500 Feb-22 Feb-23 Feb-24 Lisings Active Inventory Condos
Total Inventory In Escrow* by Price Range: Single-Family Homes
February 2024
OAHU, HAWAII
(Thenumberofpropertiesinanescrowstatusattheendofagivenmonth)
Total Inventory In Escrow by Price Range
Single-Family HomesFeb-24Feb-23YOY chg
$449,999andbelow7616.7%
$450,000-$599,999157114.3%
$600,000-$699,9991622-27.3%
$700,000-$799,999372927.6%
$800,000-$899,999605215.4%
$900,000-$999,9995259-11.9%
$1,000,000-$1,499,9991291225.7%
$1,500,000-1,999,999554037.5%
$2,000,000-$2,999,999292611.5%
$3,000,000andabove1623-30.4%
All Single-Family Homes 4163867.8%
Single-Family Homes
Feb-24 Feb-23
$449,999 and below $450,000$599,999 $600,000$699,999 $700,000$799,999 $800,000$899,999 $900,000$999,999 $1,000,000$1,499,999 $1,500,0001,999,999 $2,000,000$2,999,999 $3,000,000 and above
Total Inventory In Escrow - Percent Share by Price Range
*Newindicatoraddedtoreportsasof2021,includingapplicablehistoricaldata.
SOURCE: Honolulu Board of REALTORS®, residential resales compiled from MLS data. ©2024.HonoluluBoardofREALTORS®.AllRightsReserved.Informationhereindeemedreliablebutnotguaranteed.
$599,999 and below
$600,000 to $799,999
$800,000 to $999,999
$1,000,000 to $1,999,999
$2,000,000 and above
(portionoftotalinventoryinescrowrepresentedbyagivenprice range)
FEB-23
$599,999 and below
$600,000 to $799,999
$800,000 to $999,999
$1,000,000 to $1,999,999
$2,000,000 and above
0 20 40 60 80 100 120 140
Active Listings
Current List Price
3% 13% 29% 42% 13%
5% 13% 27% 44% 11%
FEB-24
Total Inventory In Escrow* by Price Range: Condos
February 2024
OAHU, HAWAII
(Thenumberofpropertiesinanescrowstatusattheendofagivenmonth)
Condos Feb-24Feb-23YOY chg
$149,999andbelow2126-19.2%
$150,000-$299,999736119.7%
$300,000-$399,9991039212.0%
$400,000-$499,99998953.2%
$500,000-$599,9998290-8.9%
$600,000-$699,9996971-2.8%
$700,000-$999,9999297-5.2%
$1,000,000-$1,499,9992833-15.2%
$1,500,000-$1,999,9991017-41.2%
$2,000,000andabove10100.0%
All Condos 586592-1.0%
Total Inventory In Escrow by Price Range Condos

$149,999 and below $150,000$299,999 $300,000$399,999 $400,000$499,999 $500,000$599,999 $600,000$699,999 $700,000$999,999 $1,000,000$1,499,999 $1,500,000$1,999,999 $2,000,000 and above
Total Inventory In Escrow - Percent Share by Price Range
*Newindicatoraddedtoreportsasof2021,includingapplicablehistoricaldata.
SOURCE: Honolulu Board of REALTORS®, residential resales compiled from MLS data.
©2024.HonoluluBoardofREALTORS®.AllRightsReserved.Informationhereindeemedreliablebutnotguaranteed.
$299,999 and below
$300,000 to $499,999
$500,000 to $699,999
$700,000 to $1,499,999
$1,500,000 and above
(portionoftotalinventoryinescrowrepresentedbyagivenprice range)
$299,999 and below
$300,000 to $499,999
$500,000 to $699,999
$700,000 to $1,499,999
$1,500,000 and above
0 20 40 60 80 100 120
Active Listings Current List Price
15% 32% 27% 22% 4%
Feb-24 Feb-23
FEB-23
16% 34% 26% 21% 3% FEB-24
Months Supply of Active Inventory by Price Range: Single-Family Homes
February 2024
OAHU, HAWAII
(Comparesactiveinventorytoarolling12-monthaverageclosedsales)
Months Supply of Inventory by Price Range
Single-Family HomesFeb-24Feb-23YOY chg
$449,999andbelow3.01.5100.0%
$450,000-$599,9993.83.58.6%
$600,000-$699,9992.32.7-14.8%
$700,000-$799,9991.61.8-11.1%
$800,000-$899,9992.21.915.8%
$900,000-$999,9992.31.376.9%
$1,000,000-$1,499,9992.01.353.8%
$1,500,000-1,999,9993.62.356.5%
$2,000,000-$2,999,9994.13.228.1%
$3,000,000andabove10.66.563.1%
All Single-Family Homes 2.82.040.0%
SOURCE:
Single-Family Homes
Feb-24 Feb-23

and below
$599,999 $600,000$699,999 $700,000$799,999 $800,000$899,999 $900,000$999,999 $1,000,000$1,499,999 $1,500,0001,999,999 $2,000,000$2,999,999 $3,000,000 and above
Months Supply of Inventory
Single-Family Homes

$599,999 and below
$600,000 to $799,999
$800,000 to $999,999
$1,000,000 to $1,999,999
$2,000,000 and above
0 3 6 9 12 $449,999
$450,000
Months of Inventory
Current List Price
0 2 4 6 8 Feb-22Feb-23Feb-24 Months of Inventory
©2024.HonoluluBoardofREALTORS®.AllRightsReserved.Informationhereindeemedreliablebutnotguaranteed.
Honolulu Board of REALTORS®, residential resales compiled from MLS data.
Months Supply of Active Inventory by Price Range: Condos
February 2024
OAHU, HAWAII
(Comparesactiveinventorytoarolling12-monthaverageclosedsales)
Feb-24Feb-23YOY chg
$149,999andbelow2.92.90.0%
$150,000-$299,9993.42.441.7%
$300,000-$399,9993.51.6118.8%
$400,000-$499,9993.41.888.9%
$500,000-$599,9992.51.478.6%
$600,000-$699,9992.52.38.7%
$700,000-$999,9993.72.548.0%
$1,000,000-$1,499,9995.94.531.1%
$1,500,000-$1,999,9999.19.01.1%
$2,000,000andabove14.19.745.4%

$149,999 and below $150,000$299,999 $300,000$399,999 $400,000$499,999 $500,000$599,999 $600,000$699,999 $700,000$999,999 $1,000,000$1,499,999 $1,500,000$1,999,999 $2,000,000 and above
$299,999 and below
$300,000 to $499,999
$500,000 to $699,999
$700,000 to $1,499,999
$1,500,000 and above
Condos
All Condos 3.62.450.0% 0 3 6 9 12 15
Months of Inventory Current List Price
Supply of Inventory by Price Range Condos Feb-24
0 2 4 6 8 10 12 14 Feb-22Feb-23Feb-24 Months of Inventory
Supply of Inventory Condos
Months
Feb-23
Months
residential resales compiled
data. ©2024.HonoluluBoardofREALTORS®.AllRightsReserved.Informationhereindeemedreliablebutnotguaranteed.
SOURCE: Honolulu Board of REALTORS®,
from MLS

Sales Single-Family Homes and Condos OAHU, HAWAII: Jan 1987 to the Present 0 100 200 300 400 500 600 700 800 900 19871988198919901991199219931994199519961997199819992000200120022003200420052006200720082009201020112012201320142015201620172018201920202021202220232024 Closed Sales SFH Closed Sales CONDO
REALTORS®, compiled
MLS data. ©2024. Honolulu Board of REALTORS®. All Rights Reserved. Information herein deemed reliable but not guaranteed.
Closed
SOURCE: Honolulu Board of
from

Median Sales Price Single-Family Homes and Condos OAHU, HAWAII: Jan 1987 to the Present $0 $200,000 $400,000 $600,000 $800,000 $1,000,000 $1,200,000 $1,400,000 19871988198919901991199219931994199519961997199819992000200120022003200420052006200720082009201020112012201320142015201620172018201920202021202220232024 Median Sales Price SFH Median Sales Price CONDO SOURCE: Honolulu Board of REALTORS®, compiled from MLS data. ©2024. Honolulu Board of REALTORS®. All Rights Reserved. Information herein deemed reliable but not guaranteed.
