
*seefootnotesonpages9-12regardingmethodologyupdatesYoY%chg=year-over-yearpercentchangecomparingcurrentmonthtothesamemonthlastyear. MoM%chg=month-over-monthpercentchangecomparingcurrentmonthtothepreviousmonth.
*seefootnotesonpages9-12regardingmethodologyupdates1-yr%chg=percentchangecomparingthecurrentYTDtimeperiodtothesameYTDtimeperiodoneyearago. 2-yr%chg=percentchangecomparingthecurrentYTDtimeperiodtothesameYTDtimeperiodtwoyearsago.
SOURCE: Honolulu Board of REALTORS®, residential resales compiled from MLS data. ©2023.HonoluluBoardofREALTORS®.AllRightsReserved.Informationhereindeemedreliablebutnotguaranteed.


September 2023
OAHU, HAWAII
(Acountofpropertiesthathaveclosedinagivenmonth)

Mo-Yr Single-Family HomesCondosTotal
Sep-20391456847
Oct-20345480825
Nov-20338407745
Dec-20420514934
Jan-21291392683
Feb-21260446706
Mar-21361626987
Apr-213756451,020
May-214055981,003
Jun-214517301,181
Jul-214046711,075
Aug-214256751,100
Sep-214246151,039
Oct-21381611992
Nov-21371601972
Dec-21378593971
Jan-22326552878
Feb-22241486727
Mar-22321672993
SOURCE: Honolulu Board of REALTORS®, residential resales compiled from MLS data. ©2023.HonoluluBoardofREALTORS®.AllRightsReserved.Informationhereindeemedreliablebutnotguaranteed.
September 2023
OAHU, HAWAII
(Themediansalespriceofallclosedpropertiesinagivenmonth)
Mo/Yr Single-Family HomesCondos
Sep-20$880,000$445,000
Oct-20$865,000$439,500
Nov-20$872,500$420,000
Dec-20$870,000$455,000
Jan-21$883,000$452,000
Feb-21$917,500$457,500
Mar-21$950,000$451,000
Apr-21$928,000$450,000
May-21$978,000$457,750
Jun-21$979,000$460,000
Jul-21$992,500$475,000
Aug-21$1,050,000$500,000
Sep-21$1,050,000$478,000
Oct-21$1,000,000$500,000
Nov-21$1,050,000$500,000
Dec-21$1,050,000$485,000
Jan-22$1,050,000$510,000
Feb-22$1,125,000$497,000
Mar-22$1,150,000$515,500
Apr-22$1,105,000$510,000
May-22$1,153,500$516,500
Jun-22$1,100,000$534,000
Jul-22$1,107,944$500,000
SOURCE: Honolulu Board of REALTORS®, residential resales compiled from MLS data. ©2023.HonoluluBoardofREALTORS®.AllRightsReserved.Informationhereindeemedreliablebutnotguaranteed.
September 2023
OAHU, HAWAII
(Theaveragesalespriceofallclosedpropertiesinagivenmonth)
Mo/Yr Single-Family HomesCondos
Sep-20$1,073,692$545,367
Oct-20$1,065,594$479,736
Nov-20$1,084,834$472,726
Dec-20$1,113,076$504,222
Jan-21$1,050,263$496,296
Feb-21$1,172,804$545,629
Mar-21$1,226,827$530,257
Apr-21$1,194,150$520,192
May-21$1,246,611$555,798
Jun-21$1,225,011$557,302
Jul-21$1,265,382$544,064
Aug-21$1,316,681$618,612
Sep-21$1,289,510$558,002
Oct-21$1,335,171$582,509
Nov-21$1,296,551$559,007
Dec-21$1,303,481$604,749
Jan-22$1,277,309$623,928
Feb-22$1,486,088$583,367
Mar-22$1,570,668$623,684
Apr-22$1,404,481$613,189
May-22$1,450,008$625,327
SOURCE: Honolulu Board of REALTORS®, residential resales compiled from MLS data. ©2023.HonoluluBoardofREALTORS®.AllRightsReserved.Informationhereindeemedreliablebutnotguaranteed.
September 2023
OAHU, HAWAII
(DaysonMarketrepresentsthenumberofdaysfromwhenapropertyisfirstlistedtowhenanofferisaccepted;theMedianDaysonMarketrepresentsthemedianofallsalesinagivenmonth)
SOURCE:
September 2023
OAHU, HAWAII
(Thepercentagefoundwhendividingaproperty'ssalespricebytheoriginallistprice;reportedpercentageisthemedianofallsalesfortheperiodindicated)
Mo/Yr Single-Family HomesCondos
Sep-20100.0%98.6%
Oct-20100.0%98.3%
Nov-20100.0%99.0%
Dec-20100.0%98.5%
Jan-21100.7%98.8%
Feb-21100.0%98.8%
Mar-21100.4%99.1%
Apr-21101.9%99.6%
May-21101.4%100.0%
Jun-21104.2%100.0%
Jul-21103.9%100.0%
Aug-21103.0%100.0%
Sep-21103.1%100.0%
Oct-21102.2%100.0%
Nov-21102.2%100.0%
Dec-21102.1%100.0%
Jan-22101.6%100.0%
Feb-22100.8%100.0%
Mar-22102.0%100.0%
Apr-22102.6%100.0%
May-22102.2%100.0%
Jun-22102.0%100.0%
SOURCE: Honolulu Board of REALTORS®, residential resales compiled from MLS data. ©2023.HonoluluBoardofREALTORS®.AllRightsReserved.Informationhereindeemedreliablebutnotguaranteed.
September 2023
OAHU, HAWAII
(Acountofpropertiesthathavebeennewlylistedonthemarketinagivenmonth)
Mo-Yr Single-Family HomesCondosTotal
Sep-20368576944
Oct-203806641,044
Nov-20379561940
Dec-20264466730
Jan-213656591,024
Feb-21322623945
Mar-214397151,154
Apr-214597061,165
May-214306831,113
Jun-214827841,266
Jul-214696641,133
Aug-214607211,181
Sep-214127381,150
Oct-213767171,093
Nov-21358639997
Dec-21245527772
Jan-22320666986
Feb-223677391,106
September 2023
OAHU, HAWAII
(Ameasureofcontractactivityrepresentedbyacountofpropertiesthathavehadoffersacceptedonthemduringagivenmonth)

Mo/Yr Single-Family HomesCondosTotal
Sep-20389451840
Oct-20358484842
Nov-20394470864
Dec-20315438753
Jan-21329534863
Feb-21365572937
Mar-213706561,026
Apr-214507271,177
May-214316991,130
Jun-214226661,088
Jul-214336581,091
Aug-214156171,032
Sep-213986291,027
Oct-214006301,030
Nov-21367573940
Dec-21287511798
Jan-22315574889
Feb-22316643959
Apr-23271438709
May-23258507765
Jun-23231415646
Jul-23247421668
Aug-23267425692
Sep-23232 371 603
*Methodologyupdatedasof2021toreflectacountofpropertiesthatenteredcontractwithinthegivenmonthandremaininescrowstatusattheendofthemonth(alsoappliedtohistoricaldatashownabove). PendingSales,inreportspriorto2021,reflectacountofalllistingsthatheldaPending(P)statusthroughoutthegivenmonth.
SOURCE: Honolulu Board of REALTORS®, residential resales compiled from MLS data. ©2023.HonoluluBoardofREALTORS®.AllRightsReserved.Informationhereindeemedreliablebutnotguaranteed.
September 2023
OAHU, HAWAII
(ThenumberofpropertiesinActive(A)statusattheendofthegivenmonth)
Mo/Yr Single-Family HomesCondosTotal
Sep-205291,7422,271
Oct-205211,7152,236
Nov-205031,6452,148
Dec-204191,4591,878
Jan-214171,3961,813
Feb-213501,3321,682
Mar-213791,2571,636
Apr-213811,1331,514
May-213379831,320
Jun-213771,0251,402
Jul-214159691,384
Aug-214169501,366
Sep-214371,0301,467
Oct-214011,0391,440
Nov-213661,0331,399
Dec-213099461,255
Jan-223119671,278
Feb-223489891,337
Mar-223609191,279
*Indicatormodifiedasof2021toreflectActivestatuslistingsonlyandappliedtohistoricalmonthlydatashownabove.Previousreportindicator,referredtoasActiveListings,reflectedallactivelymarketedlistingsinAandCstatus.
SOURCE: Honolulu Board of REALTORS®, residential resales compiled from MLS data. ©2023.HonoluluBoardofREALTORS®.AllRightsReserved.Informationhereindeemedreliablebutnotguaranteed.
September 2023
OAHU, HAWAII
(Thenumberofpropertiesundercontractattheendofthegivenmonth/combinedlistingsinCandPstatus)
Mo/Yr Single-Family HomesCondosTotal
Sep-207027691,471
Oct-206937571,450
Nov-207118001,511
Dec-205757031,278
Jan-215968371,433
Feb-216979601,657
Mar-216919791,670
Apr-217391,0301,769
May-217931,1571,950
Jun-217541,0681,822
Jul-217351,0261,761
Aug-217279791,706
Sep-216609511,611
Oct-216639351,598
Nov-216378991,536
Dec-215287841,312
Jan-224987971,295
Feb-225449461,490
Mar-226039801,583
Total Inventory In Escrow
Total Inventory In Escrow: Single-Family Homes + Condos Apr-225929561,548SeptemberSFHYoY%chgCNDYoY%chg
Aug-224626541,116
Sep-22388590978
Oct-22345506851
Nov-22319512831
Dec-22278430708
Jan-23376523899
Feb-23386592978
Mar-23393602995
Apr-234356231,058
May-234186861,104
Jun-23370612982
Jul-23383586969
Aug-23391590981
Sep-23383 569 952
*Newindicatoraddedtoreportsasof2021,includingapplicablehistoricaldata.
SOURCE: Honolulu Board of REALTORS®, residential resales compiled from MLS data. ©2023.HonoluluBoardofREALTORS®.AllRightsReserved.Informationhereindeemedreliablebutnotguaranteed.
September 2023
OAHU, HAWAII (Comparesactiveinventorytoarolling12-monthaverageclosedsales) Mo/Yr Single-Family
*Methodologyupdatedasof2021(alsoappliedtohistoricaldatashownonthischart). MonthsofInventory,inreportspriorto2021,reflectacomparisonofactivelistingstoaveragependingsales.
OAHU, HAWAII
(Ayear-over-yearoverviewoftheavailabilityandsalesofpropertiesinagivenmonth,bypricerange)
SOURCE: Honolulu Board of REALTORS®, residential resales compiled from MLS data. ©2023.HonoluluBoardofREALTORS®.AllRightsReserved.Informationhereindeemedreliablebutnotguaranteed.

September 2023
OAHU, HAWAII
(Acountofpropertiesthathaveclosedinagivenmonth) Single-Family


$449,999andbelow3250.0%2931-6.5%
$450,000-$599,999126100.0%6484-23.8%
$600,000-$699,999612-50.0%112134-16.4%
$700,000-$799,9992223-4.3%232306-24.2%
$800,000-$899,99939368.3%401487-17.7%
$900,000-$999,9992329-20.7%332590-43.7%
$1,000,000-$1,499,99980107-25.2%8651,410-38.7%
$1,500,000-1,999,9992137-43.2%289495-41.6%
$2,000,000-$2,999,9991318-27.8%168261-35.6%
$3,000,000andabove13862.5%109190-42.6%
All Single-Family Homes 232278-16.5%2,6013,988-34.8%

This12-monthperiodreflectstheconsecutive12-monthperiodupthroughthecurrentmonth,whilelastperiod reflectsthesame12-monthperiodoneyearprior.
SOURCE: Honolulu Board of REALTORS®, residential resales compiled from MLS data. ©2023.HonoluluBoardofREALTORS®.AllRightsReserved.Informationhereindeemedreliablebutnotguaranteed.
OAHU, HAWAII
(Acountofpropertiesthathaveclosedinagivenmonth)
$149,999andbelow67-14.3%161194-17.0%
$150,000-$299,9994669-33.3%566893-36.6%
$300,000-$399,9995679-29.1%7731,064-27.3%
$400,000-$499,9996090-33.3%8011,244-35.6%
$500,000-$599,9995777-26.0%6961,061-34.4%
$600,000-$699,9994748-2.1%573768-25.4%
$700,000-$999,9996586-24.4%7311,215-39.8%
$1,000,000-$1,499,99925244.2%240366-34.4%
$1,500,000-$1,999,99910742.9%94108-13.0%
$2,000,000andabove49-55.6%92110-16.4%
All Condos 376496-24.2%4,7277,023-32.7%
This12-monthperiodreflectstheconsecutive12-monthperiodupthroughthecurrentmonth,whilelastperiod reflectsthesame12-monthperiodoneyearprior.
SOURCE: Honolulu Board of REALTORS®, residential resales compiled from MLS data. ©2023.HonoluluBoardofREALTORS®.AllRightsReserved.Informationhereindeemedreliablebutnotguaranteed.
OAHU, HAWAII
(Themediannumberofdaysfromwhenapropertyisfirstlistedtowhenanofferisaccepted) Single-Family

$449,999andbelow115120.0%2612116.7%
Median Days on Market by Price Range
1-mth Period: Single-Family Homes
$450,000-$599,9992911163.6%4614228.6%
$600,000-$699,99935342.9%3711236.4%
$700,000-$799,9992526-3.8%3010200.0%
$800,000-$899,9991621-23.8%2610160.0%
$900,000-$999,9992010100.0%2210120.0%
Median Days on Market by Price Range 12-mth Period:
$1,000,000-$1,499,9991719-10.5%181080.0%
$1,500,000-1,999,9991011-9.1%151136.4%
$2,000,000-$2,999,9991116-31.3%161323.1%
$3,000,000andabove2678-66.7%402560.0%
All Single-Family Homes 201811.1%211190.9%
This12-monthperiodreflectstheconsecutive12-monthperiodupthroughthecurrentmonth,whilelastperiod reflectsthesame12-monthperiodoneyearprior.
SOURCE: Honolulu Board of REALTORS®, residential resales compiled from MLS data. ©2023.HonoluluBoardofREALTORS®.AllRightsReserved.Informationhereindeemedreliablebutnotguaranteed.
OAHU, HAWAII
(Themediannumberofdaysfromwhenapropertyisfirstlistedtowhenanofferisaccepted)
$149,999andbelow7113446.2%29277.4%
$150,000-$299,9991822-18.2%201811.1%
$300,000-$399,999221369.2%201266.7%
$400,000-$499,999191258.3%161145.5%
$500,000-$599,999151136.4%16977.8%
$600,000-$699,999211540.0%2010100.0%
$700,000-$999,999161414.3%2310130.0%
$1,000,000-$1,499,999373023.3%321877.8%
$1,500,000-$1,999,9994074-45.9%352540.0%
$2,000,000andabove5418200.0%3448-29.2%
All Condos 211450.0%201181.8%
This12-monthperiodreflectstheconsecutive12-monthperiodupthroughthecurrentmonth,whilelastperiod reflectsthesame12-monthperiodoneyearprior.
SOURCE: Honolulu Board of REALTORS®, residential resales compiled from MLS data. ©2023.HonoluluBoardofREALTORS®.AllRightsReserved.Informationhereindeemedreliablebutnotguaranteed.
OAHU, HAWAII
(Thepercentagefoundwhendividingaproperty'ssalespricebytheoriginallistprice;reportedpercentageisthemedianofallsalesfortheperiodandpricerangeindicated)
Median Percent of Original List Price Received by Price Range
All Single-Family Homes 99.0%99.2%-0.2%98.3%101.3%-3.0% This12-monthperiodreflectstheconsecutive12-monthperiodupthroughthecurrentmonth,whilelastperiod reflectsthesame12-monthperiodoneyearprior.
Median Percent of Original List Price Received by Price Range
SOURCE: Honolulu Board of REALTORS®, residential resales compiled from MLS data. ©2023.HonoluluBoardofREALTORS®.AllRightsReserved.Informationhereindeemedreliablebutnotguaranteed.
OAHU, HAWAII
(Thepercentagefoundwhendividingaproperty'ssalespricebytheoriginallistprice;reportedpercentageisthemedianofallsalesfortheperiodandpricerangeindicated)
All Condos 98.8%100.0%-1.2%98.7%100.0%-1.3% This12-monthperiodreflectstheconsecutive12-monthperiodupthroughthecurrentmonth,whilelastperiod reflectsthesame12-monthperiodoneyearprior.
SOURCE: Honolulu Board of REALTORS®, residential resales compiled from MLS data. ©2023.HonoluluBoardofREALTORS®.AllRightsReserved.Informationhereindeemedreliablebutnotguaranteed.
OAHU, HAWAII
(Acountofpropertiesthathavebeennewlylistedonthemarketinagivenmonth)

New Listings by Price Range
$449,999andbelow110.0%2126-19.2%
$450,000-$599,999550.0%7987-9.2%
$600,000-$699,99912119.1%140176-20.5%
$700,000-$799,999211816.7%272364-25.3%
$800,000-$899,9993235-8.6%453572-20.8%
New Listings by Price Range
$900,000-$999,9993740-7.5%429636-32.5%
$1,000,000-$1,499,99988110-20.0%1,0011,411-29.1%
$1,500,000-1,999,999484117.1%473529-10.6%
$2,000,000-$2,999,9991723-26.1%235322-27.0%
$3,000,000andabove20200.0%240286-16.1%
All Single-Family Homes281304-7.6%3,3434,409-24.2%
This12-monthperiodreflectstheconsecutive12-monthperiodupthroughthecurrentmonth,whilelastperiod reflectsthesame12-monthperiodoneyearprior.
SOURCE: Honolulu Board of REALTORS®, residential resales compiled from MLS data. ©2023.HonoluluBoardofREALTORS®.AllRightsReserved.Informationhereindeemedreliablebutnotguaranteed.
OAHU, HAWAII
(Acountofpropertiesthathavebeennewlylistedonthemarketinagivenmonth)
$149,999andbelow1317-23.5%189203-6.9%
$150,000-$299,9995964-7.8%709991-28.5%
$300,000-$399,9998391-8.8%9301,204-22.8%
$400,000-$499,99983101-17.8%9921,337-25.8%
$500,000-$599,99973101-27.7%8811,126-21.8%
$600,000-$699,9995768-16.2%722885-18.4%
$700,000-$999,9998492-8.7%9781,354-27.8%
$1,000,000-$1,499,9992738-28.9%377462-18.4%
$1,500,000-$1,999,999161145.5%1951798.9%
$2,000,000andabove211816.7%20718114.4%
All Condos 516601-14.1%6,1807,922-22.0%
This12-monthperiodreflectstheconsecutive12-monthperiodupthroughthecurrentmonth,whilelastperiod reflectsthesame12-monthperiodoneyearprior.
SOURCE: Honolulu Board of REALTORS®, residential resales compiled from MLS data. ©2023.HonoluluBoardofREALTORS®.AllRightsReserved.Informationhereindeemedreliablebutnotguaranteed.
OAHU, HAWAII
(Ameasureofcontractactivity/acountofpropertiesthathavehadoffersacceptedontheminagivenmonth)

Pending Sales by Price Range
$449,999andbelow10#DIV/0!302520.0%
$450,000-$599,99973133.3%7596-21.9%
$600,000-$699,999141040.0%134182-26.4%
$700,000-$799,999221915.8%264355-25.6%
$800,000-$899,9993135-11.4%427549-22.2%
$900,000-$999,999312334.8%370594-37.7%
Pending Sales by Price Range
$1,000,000-$1,499,9997988-10.2%9011,302-30.8%
$1,500,000-1,999,999312240.9%317423-25.1%
$2,000,000-$2,999,999915-40.0%168238-29.4%
$3,000,000andabove79-22.2%126165-23.6%
All Single-Family Homes 2322243.6%2,8123,929-28.4%
This12-monthperiodreflectstheconsecutive12-monthperiodupthroughthecurrentmonth,whilelastperiod reflectsthesame12-monthperiodoneyearprior.
SOURCE: Honolulu Board of REALTORS®, residential resales compiled from MLS data. ©2023.HonoluluBoardofREALTORS®.AllRightsReserved.Informationhereindeemedreliablebutnotguaranteed.
OAHU, HAWAII
(Ameasureofcontractactivity/acountofpropertiesthathavehadoffersacceptedontheminagivenmonth)
Pending Sales by Price Range
$149,999andbelow710-30.0%153205-25.4%
$150,000-$299,9994352-17.3%580859-32.5%
$300,000-$399,9996077-22.1%7941,124-29.4%
$400,000-$499,9996772-6.9%8251,254-34.2%
$500,000-$599,99962603.3%720946-23.9%
$600,000-$699,9994449-10.2%597765-22.0%
Pending Sales by Price Range
$700,000-$999,9996073-17.8%7111,070-33.6%
$1,000,000-$1,499,9992023-13.0%230330-30.3%
$1,500,000-$1,999,99938-62.5%89111-19.8%
$2,000,000andabove512-58.3%89118-24.6%
All Condos 371436-14.9%4,7886,782-29.4% This12-monthperiodreflectstheconsecutive12-monthperiodupthroughthecurrentmonth,whilelastperiod reflectsthesame12-monthperiodoneyearprior.
SOURCE: Honolulu Board of REALTORS®, residential resales compiled from MLS data. ©2023.HonoluluBoardofREALTORS®.AllRightsReserved.Informationhereindeemedreliablebutnotguaranteed.
September 2023
OAHU, HAWAII
(Thenumberofpropertiesactiveonmarketattheendofagivenmonth)
Single-Family HomesSep-23Sep-22YOY chg
$449,999andbelow330.0%
$450,000-$599,99912771.4%
$600,000-$699,999292516.0%
$700,000-$799,99942397.7%
$800,000-$899,9996570-7.1%
$900,000-$999,9995663-11.1%
$1,000,000-$1,499,999142166-14.5%
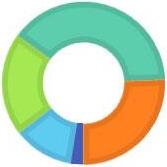
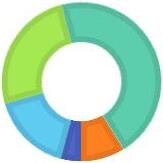
Active Inventory - Percent Share by Price Range (portionoftotalactivestatuslistingsrepresentedbyagivenpricerange)
$1,500,000-1,999,99991857.1%
$2,000,000-$2,999,9995969-14.5%
$3,000,000andabove93102-8.8%
All Single-Family Homes 592629-5.9%
*Indicatormodifiedasof2021toreflectActivestatuslistingsonlyandappliedtohistoricalmonthlydatashownabove.Previousreportindicator,referredtoasActiveListings,reflectedallactivelymarketedlistingsinAandC status.
SOURCE: Honolulu Board of REALTORS®, residential resales compiled from MLS data. ©2023.HonoluluBoardofREALTORS®.AllRightsReserved.Informationhereindeemedreliablebutnotguaranteed.
September 2023
OAHU, HAWAII
(Thenumberofpropertiesactiveonmarketattheendofagivenmonth)
Condos Sep-23Sep-22YOY chg
$149,999andbelow452395.7%
$150,000-$299,999135161-16.1%
$300,000-$399,99915312027.5%
$400,000-$499,99916114312.6%
$500,000-$599,999127129-1.6%
$600,000-$699,999107121-11.6%
$700,000-$999,999206210-1.9%
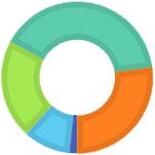
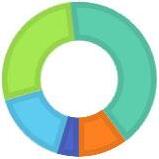
Active Inventory - Percent Share by Price Range (portionoftotalactivestatuslistingsrepresentedbyagivenpricerange)
$1,000,000-$1,499,99998107-8.4%
$1,500,000-$1,999,99962603.3%
$2,000,000andabove1006749.3%
All Condos 1,1941,1414.6%
*Indicatormodifiedasof2021toreflectActivestatuslistingsonlyandappliedtohistoricalmonthlydatashownabove.Previousreportindicator,referredtoasActiveListings,reflectedallactivelymarketedlistingsinAandC status.
SOURCE: Honolulu Board of REALTORS®, residential resales compiled from MLS data. ©2023.HonoluluBoardofREALTORS®.AllRightsReserved.Informationhereindeemedreliablebutnotguaranteed.


iousreportindicator,referredtoasActiveListings,reflectedallactivelymarketedlistingsinAandCstatus.

SOURCE: Honolulu Board of REALTORS®, residential resales compiled from MLS data. ©2023.HonoluluBoardofREALTORS®.AllRightsReserved.Informationhereindeemedreliablebutnotguaranteed.

OAHU, HAWAII
(Thenumberofpropertiesinanescrowstatusattheendofagivenmonth)
Single-Family HomesSep-23Sep-22YOY chg
$449,999andbelow36-50.0%
$450,000-$599,99913128.3%
$600,000-$699,999221915.8%
$700,000-$799,9994143-4.7%
$800,000-$899,9994959-16.9%
$900,000-$999,99948480.0%
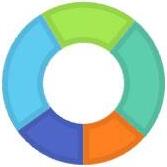
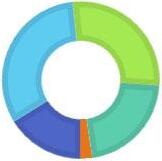
(portionoftotalinventoryinescrowrepresentedbyagivenprice range)
$1,000,000-$1,499,999123126-2.4%
$1,500,000-1,999,999503542.9%
$2,000,000-$2,999,9991925-24.0%
$3,000,000andabove15150.0%
All Single-Family Homes 383388-1.3%
*Newindicatoraddedtoreportsasof2021,includingapplicablehistoricaldata.
SOURCE: Honolulu Board of REALTORS®, residential resales compiled from MLS data. ©2023.HonoluluBoardofREALTORS®.AllRightsReserved.Informationhereindeemedreliablebutnotguaranteed.
OAHU, HAWAII
(Thenumberofpropertiesinanescrowstatusattheendofagivenmonth)
Condos Sep-23Sep-22YOY chg
$149,999andbelow1920-5.0%
$150,000-$299,99973730.0%
$300,000-$399,99987102-14.7%
$400,000-$499,99996960.0%
$500,000-$599,999986844.1%
$600,000-$699,9996062-3.2%
$700,000-$999,99992108-14.8%
$1,000,000-$1,499,99931310.0%
$1,500,000-$1,999,999412-66.7%
$2,000,000andabove918-50.0%
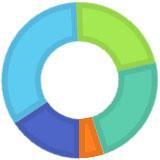
All Condos 569590-3.6%
*Newindicatoraddedtoreportsasof2021,includingapplicablehistoricaldata.
SOURCE: Honolulu Board of REALTORS®, residential resales compiled from MLS data. ©2023.HonoluluBoardofREALTORS®.AllRightsReserved.Informationhereindeemedreliablebutnotguaranteed.
OAHU, HAWAII
(Comparesactiveinventorytoarolling12-monthaverageclosedsales)


Single-Family HomesSep-23Sep-22YOY chg
$449,999andbelow1.51.050.0%
$450,000-$599,9992.41.0140.0%
$600,000-$699,9993.22.339.1%
$700,000-$799,9992.21.546.7%
$800,000-$899,9992.01.717.6%
$900,000-$999,9992.01.353.8%
SOURCE: Honolulu Board of REALTORS®, residential resales compiled from MLS data. ©2023.HonoluluBoardofREALTORS®.AllRightsReserved.Informationhereindeemedreliablebutnotguaranteed.
OAHU, HAWAII
(Comparesactiveinventorytoarolling12-monthaverageclosedsales)
Condos Sep-23Sep-22YOY chg
$149,999andbelow3.51.4150.0%
$150,000-$299,9992.92.231.8%
$300,000-$399,9992.41.384.6%
$400,000-$499,9992.41.471.4%
$500,000-$599,9992.21.546.7%
$600,000-$699,9992.21.915.8%
$700,000-$999,9993.42.161.9% $1,000,000-$1,499,9994.93.540.0%
SOURCE: Honolulu Board of REALTORS®, residential resales compiled from MLS data. ©2023.HonoluluBoardofREALTORS®.AllRightsReserved.Informationhereindeemedreliablebutnotguaranteed.

Single-Family
SOURCE: Honolulu Board of REALTORS®, compiled from MLS data. ©2023. Honolulu Board of REALTORS®. All Rights Reserved. Information herein deemed reliable but not guaranteed.