Micro Market Report
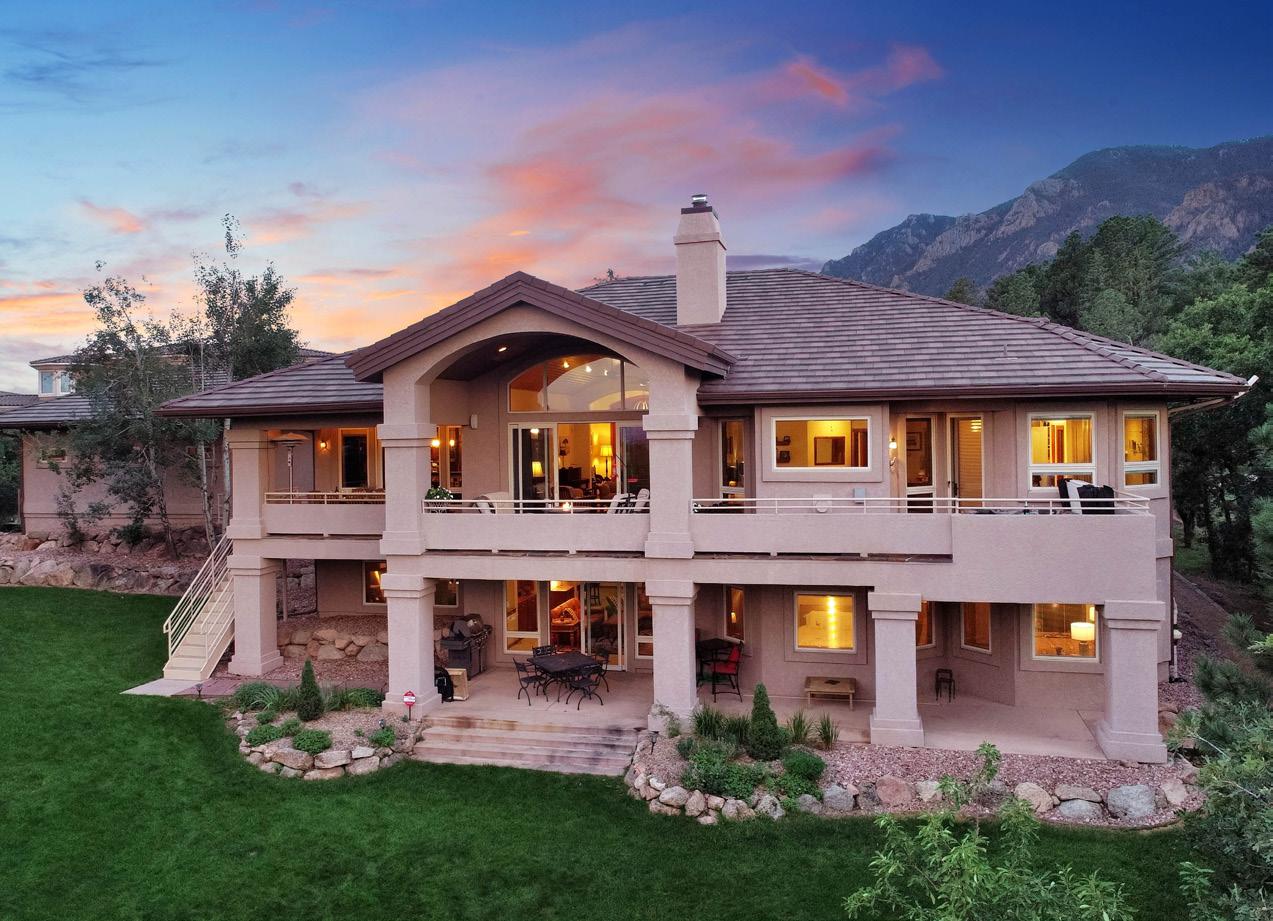

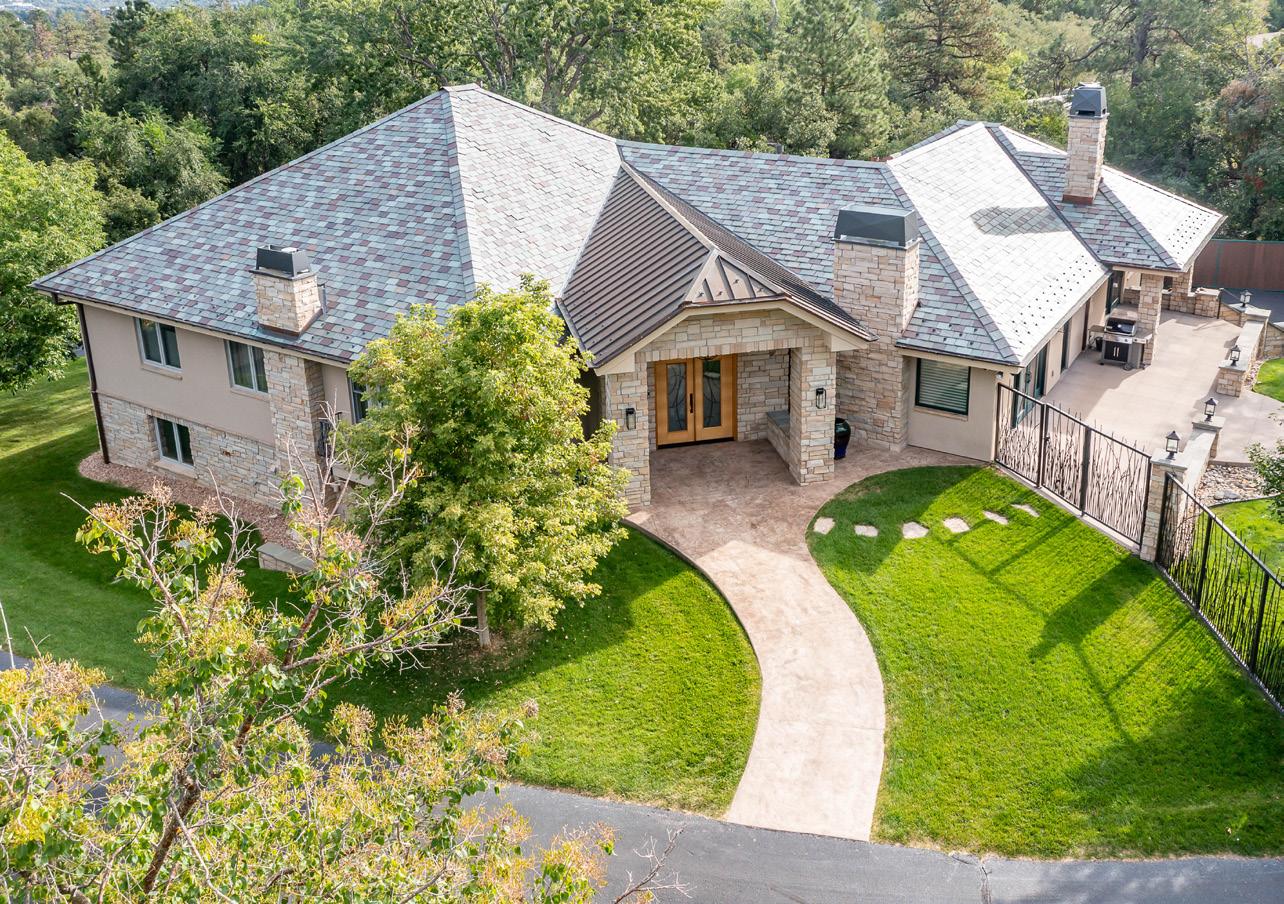
QUARTER 3 2022 COLORADO SPRINGS 3850 South Club Drive 5 Alta Vista Road

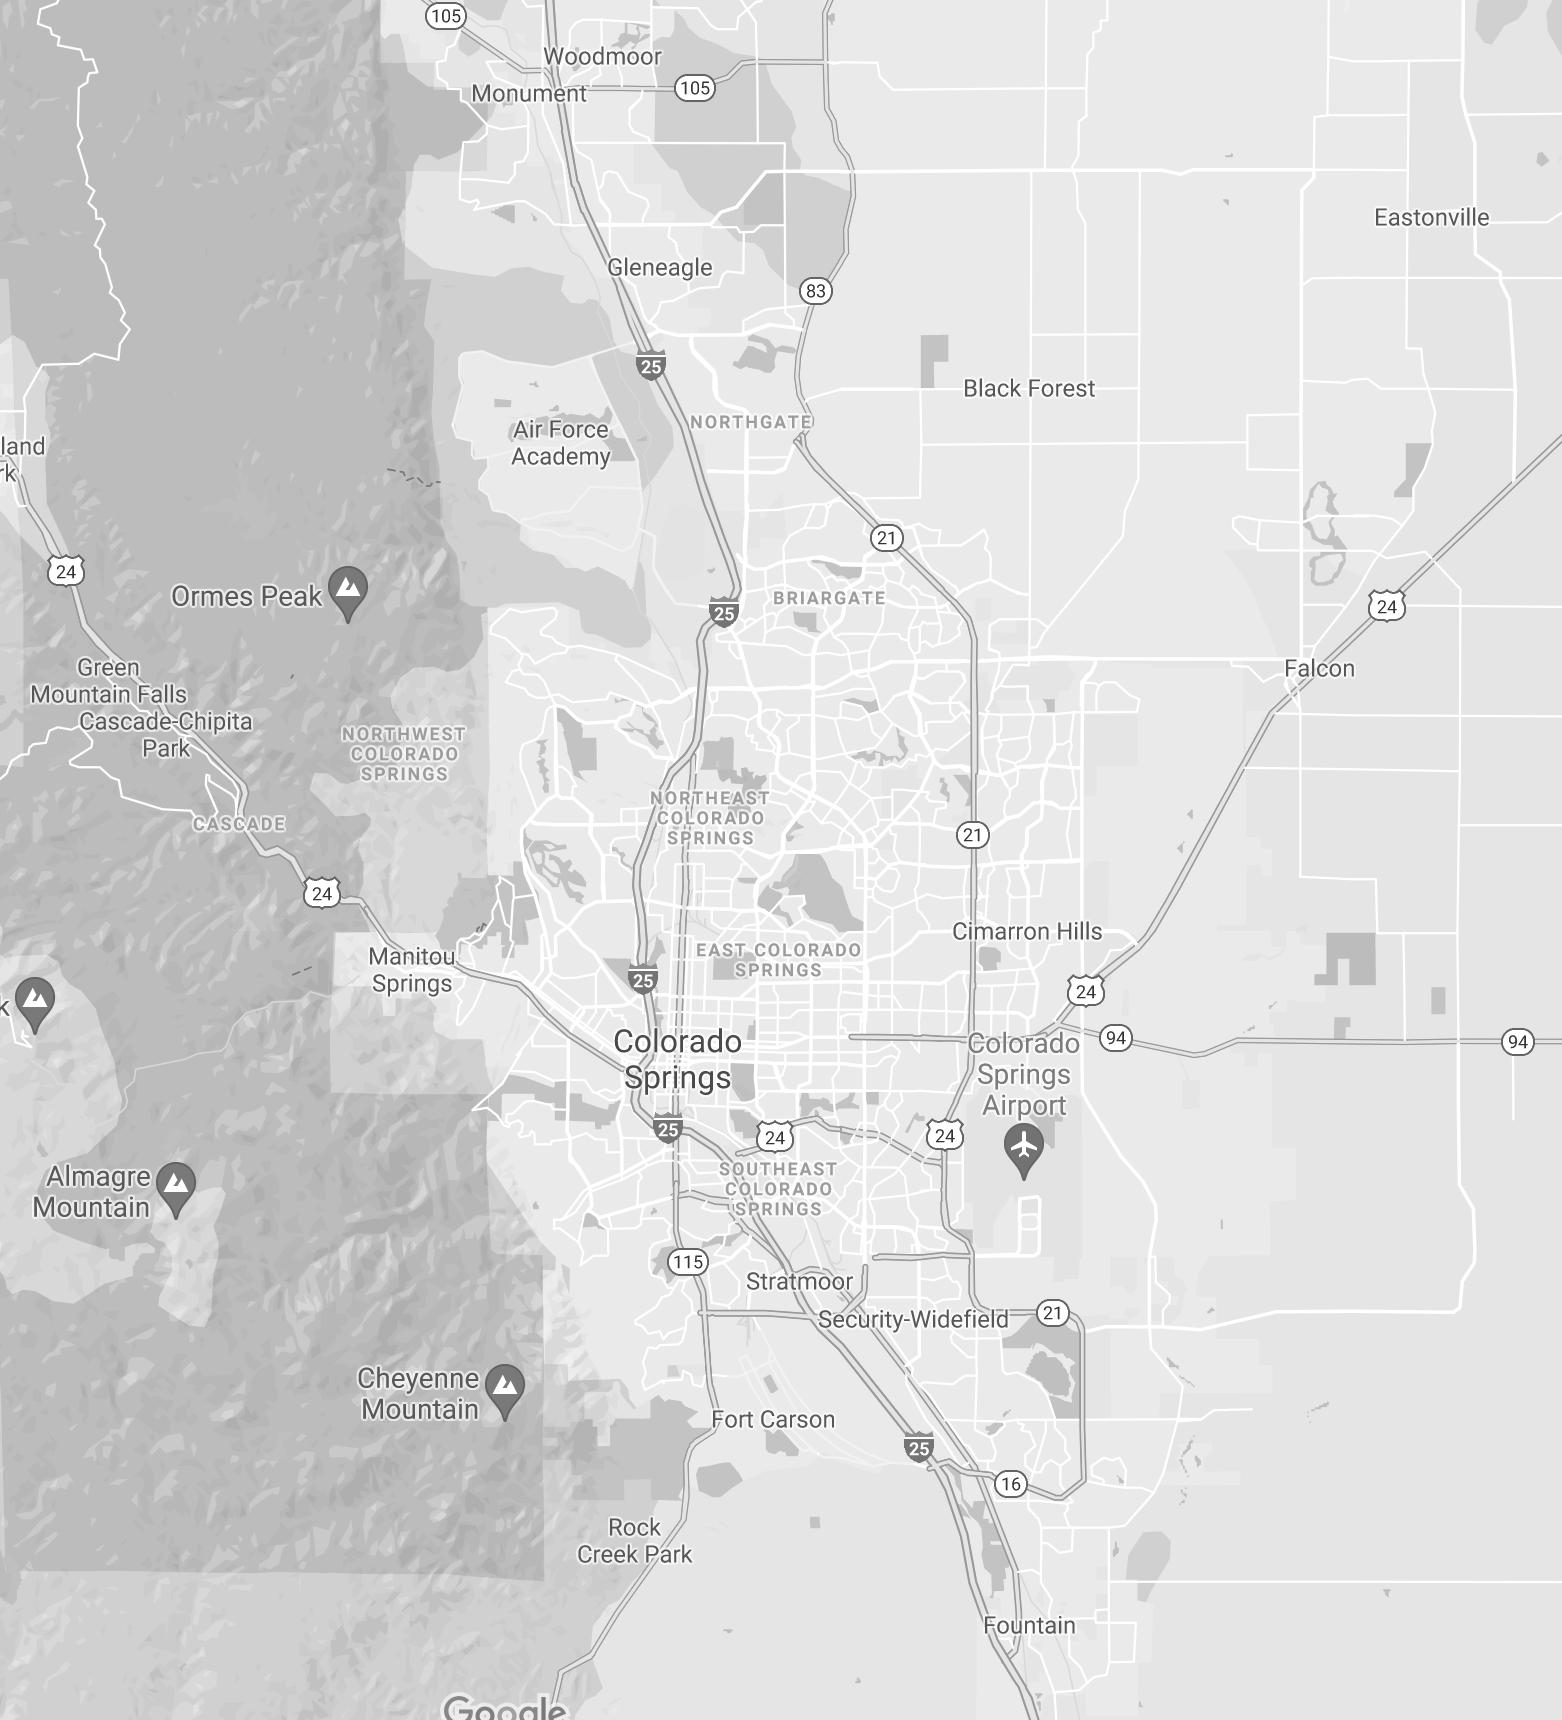
Colorado Springs, the state’s second largest city, is currently one of the most sought-after areas to live in the country. This colorful Colorado community offers its residents exciting entertainment options, unique cultural offerings, and enough outdoor activities to keep any adventurer satisfied. Thanks to the amazing array of lifestyles this city can cater to, more consumers are deciding to make this community their home.
LIV Sotheby’s International Realty produces a Micro Market Report focused on the Colorado Springs market, located within El Paso County, and its performance through Q3 of 2022 in comparison to the same period in 2021. The total dollar volume sold in El Paso County totaled $5,651,944,398 through September. Although the number of real estate sales dipped slightly by -11.5%, those homes that did sell sold for 12.8% more than they did in January through September of 2021, making the average sale price for local homes $542,309.
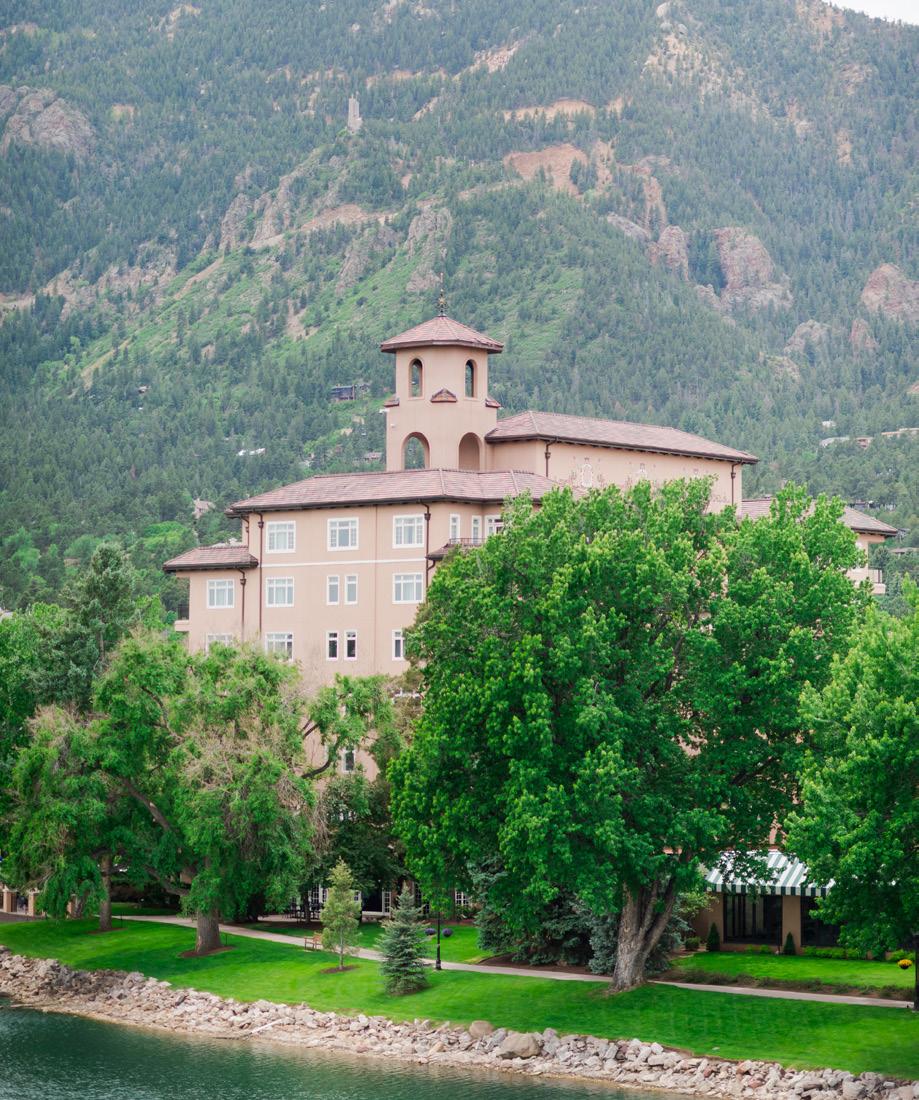
Similar real estate trends were seen throughout the individual neighborhoods within the Colorado Springs community. Home values appreciated the most significantly in the Mountain Shadows and Broadmoor neighborhoods where the average sale prices rose by 19.1% and 16.3% respectively. The area with the highest-priced homes through Q3 of this year was Broadmoor Resort, where the average home sale price was $1,940,063 – a 7.0% decrease from the previous year. The most affordable homes in Colorado Springs were found in Old North End / Patty Jewett where the average sale price was $647,909 through September.
Some neighborhoods within Colorado Springs experienced notable increases in the number of homes sold through September of this year compared to the same time frame in 2021. The Wolf Ranch neighborhood has the highest sales volume – rising by 30% from 170 homes sold through Q3 of last year to 221 homes sold so far this year. Kissing Camels also experienced
The speed of the market varied across the individual communities within Colorado Springs. The average days spent on market for home in El Paso County was 13 days through Q3 of this year. Individual neighborhoods varied in their speed of sale during the same period. In the Cordera neighborhood home spent an average of 35 days on the market, which is 40% more time than last year. Pine Creek homes sold more quickly, remaining on the market for an average of 12 days so far this year.
Considering the lifestyle and market advantages that Colorado Springs provides to its residents, this community will continue to be a popular destination for those looking to buy and sell homes in the state.

Based on information from the Pikes Peak REALTOR® Services Corp. (“RSC”), for the period January 1st, 2022 - September 30th, 2022. RSC does not guarantee or is in any way responsible for its accuracy. Data maintained by RSC may not reflect all real estate activity in the market.
Average
The average number of days on market in Broadmoor Bluffs/The Spires decreased by 21.7% January through September 2022 compared to that of 2021.
Highest Price $2,300,000 $2,400,000 4.3% Properties Sold 88 45 -48.9%
Average
January
Average Price $667,117 $782,553 17.3%
Average Price Per Square Foot $178 $209 17.4%
Average Days on Market 25 35 40.0%
Highest Price $990,900 $1,248,642 26.0%
Properties Sold 133 137 3.0%
% Sold Price to List Price 101.2% 100.6% -0.6%
The average home sale price in Cordera increased by 17.3% January through September 2022 compared to that of 2021.
Average Price $869,910 $927,530 6.6%
Average Price Per Square Foot $203 $222 9.4%
Average Days on Market 21 24 14.3%
Highest Price $3,800,000 $1,992,500 -47.6%
Properties Sold 132 110 -16.7%
% Sold Price to List Price 100.5% 100.2% -0.3%
The Colorado lifestyle comes together in one magnificent vision at Flying Horse, where you’ll find elegant homes, breathtaking views, and a private resort-style athletic club and spa. With homes priced from the upper $400k’s to custom homes in the millions, there’s something for everyone.
Average Price $1,009,935 $1,157,710 14.6%
Average Price Per Square Foot $254 $366 44.1%
Average Days on Market 37 48 29.7%
Highest Price $1,800,000 $4,390,265 143.9%
Properties Sold 29 40 37.9%
% Sold Price to List Price 98.8% 102.9% 4.1%
Mountain Shadows is a unique community built up against the Rocky Mountains. It’s located off of Centennial Boulevard and Flying W Ranch Road, just minutes from Garden of the Gods.
The highest sale price in Peregrine increased by 23.4% January through September 2022 compared to that of 2021.
January
Average Price
$609,760 $726,210 19.1%
Average Price Per Square Foot $187 $208 11.2%
Average Days on Market 25 25 0.0%
Highest Price $1,265,000 $1,102,500 -12.8%
Properties Sold 76 49 -35.5%
% Sold Price to List Price 101.2% 100.4% -0.8%
Average Price $620,799 $647,909 4.4%
Average Price Per Square Foot $285 $314 10.2%
Average Days on Market 13 14 7.7%
Highest Price $2,400,000 $1,425,000 -40.6%
Properties Sold 88 70 -20.5%
% Sold Price to List Price 103.0% 102.4% -0.6%
January through September 2021 2022 % Change
Average Price
$846,553 $935,378 10.5%
Average Price Per Square Foot $181 $206 13.8%
Average Days on Market 13 15 15.4%
Highest Price $1,175,000 $1,450,000 23.4%
Properties Sold 38 23 -39.5%
% Sold Price to List Price 103.5% 101.0% -2.4%
The
The
The number of properties sold in Wolf Ranch increased by 30.0% January through September 2022 compared to that of 2021.
The average sale price in Woodmoor increased by 16.3% January through September 2022 compared to that of 2021.
January through September 2021 2022 % Change
Average Price
$575,669 $673,430 17.0%
Average Price Per Square Foot $167 $203 21.6%
Average Days on Market 18 51 183.3%
Highest Price $750,000 $940,000 25.3% Properties Sold 170 221 30.0%
% Sold Price to List Price 102.0% 101.3% -0.7%
January through September
Average Price
2021 2022 % Change
$677,778 $787,971 16.3%
Average Price Per Square Foot $193 $216 11.9%
Average Days on Market 11 13 18.2%
Highest Price $1,055,000 $1,350,000 28.0% Properties Sold 171 140 -18.1%
% Sold Price to List Price 103.0% 102.0% -1.0%


MICRO MARKET REPORT | Colorado Springs JANUARY SEPTEMBER 2022 • COLORADOMICROREPORTS.COM