Micro Market Report

YEAR-END
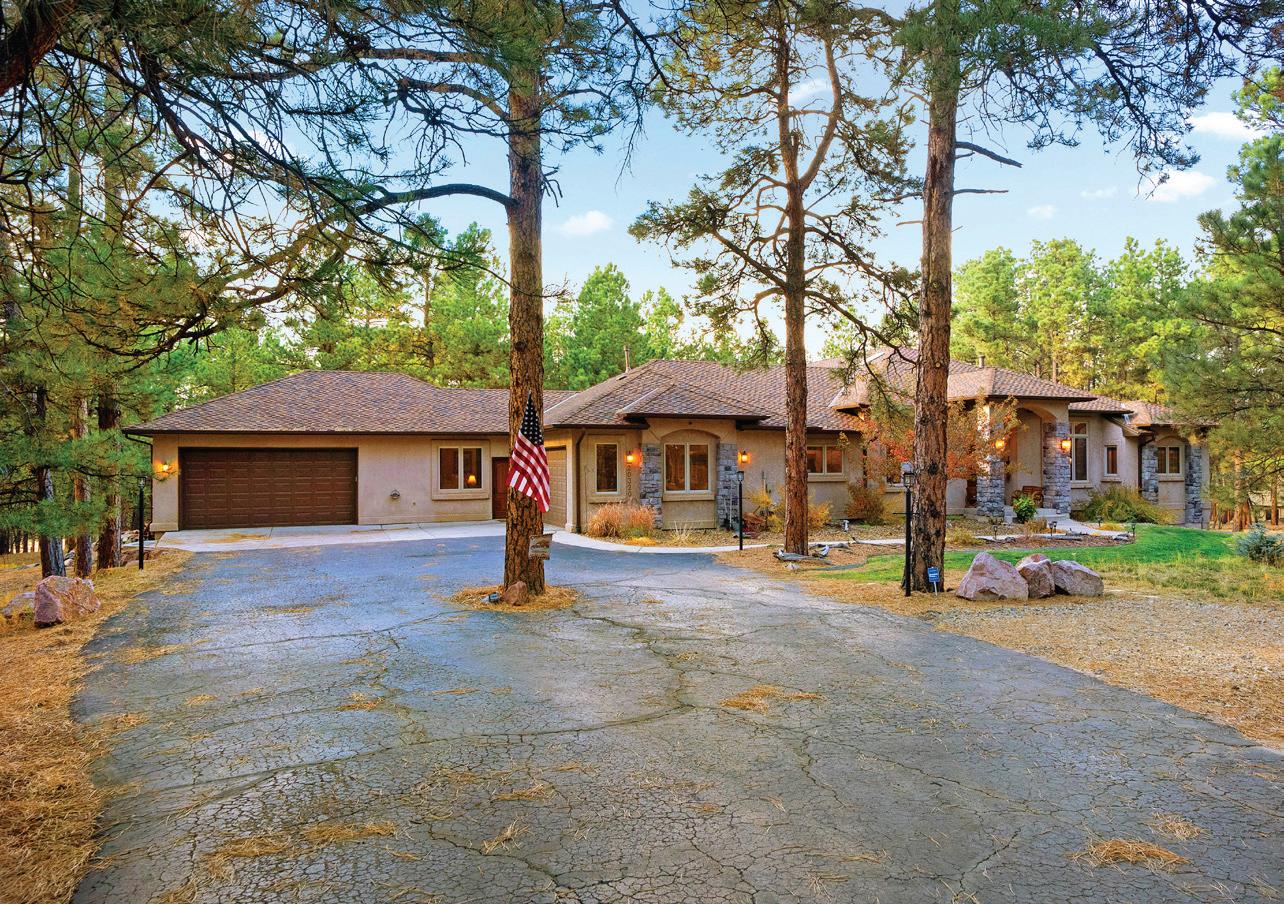
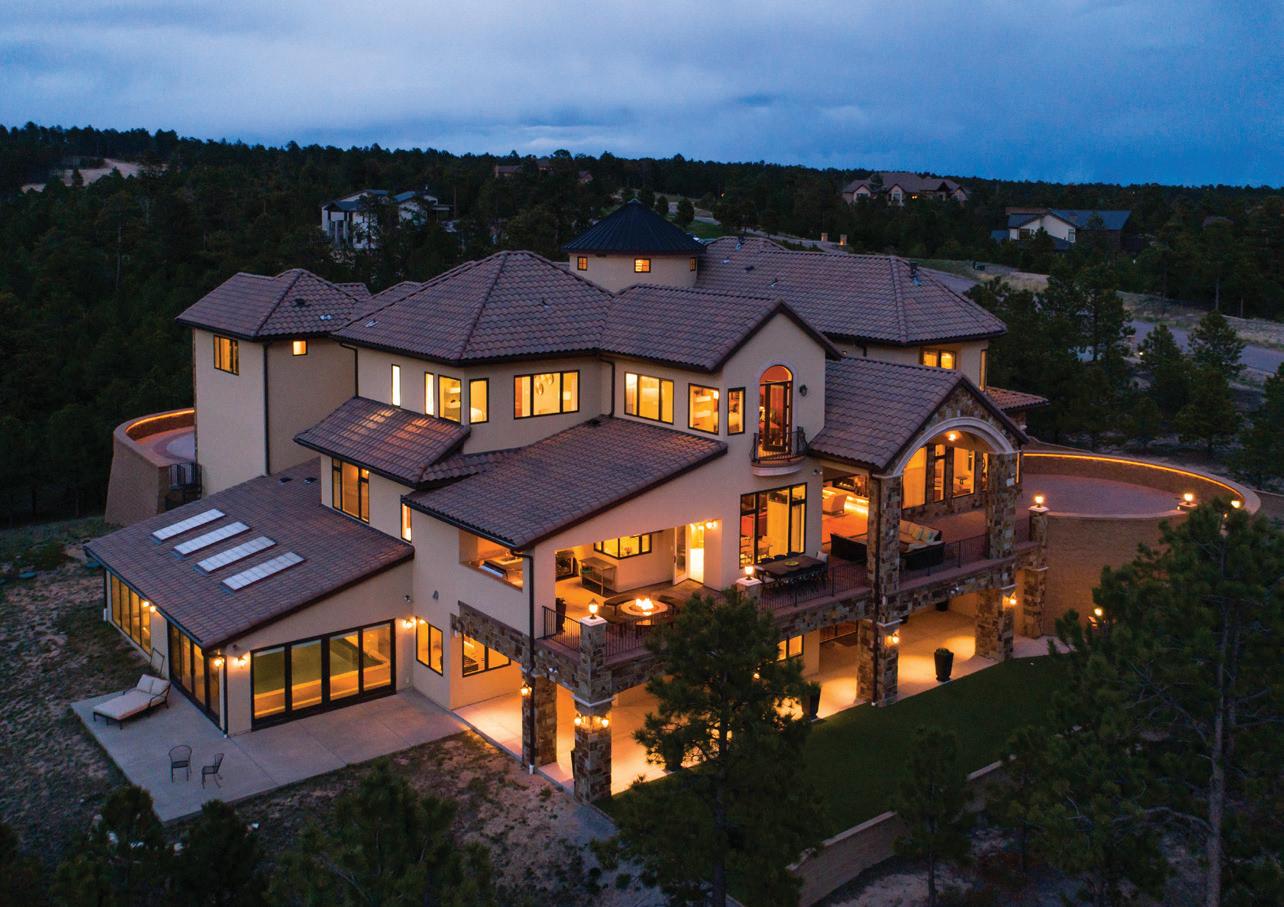
14345 Millhaven Place 20320 Lockridge Drive
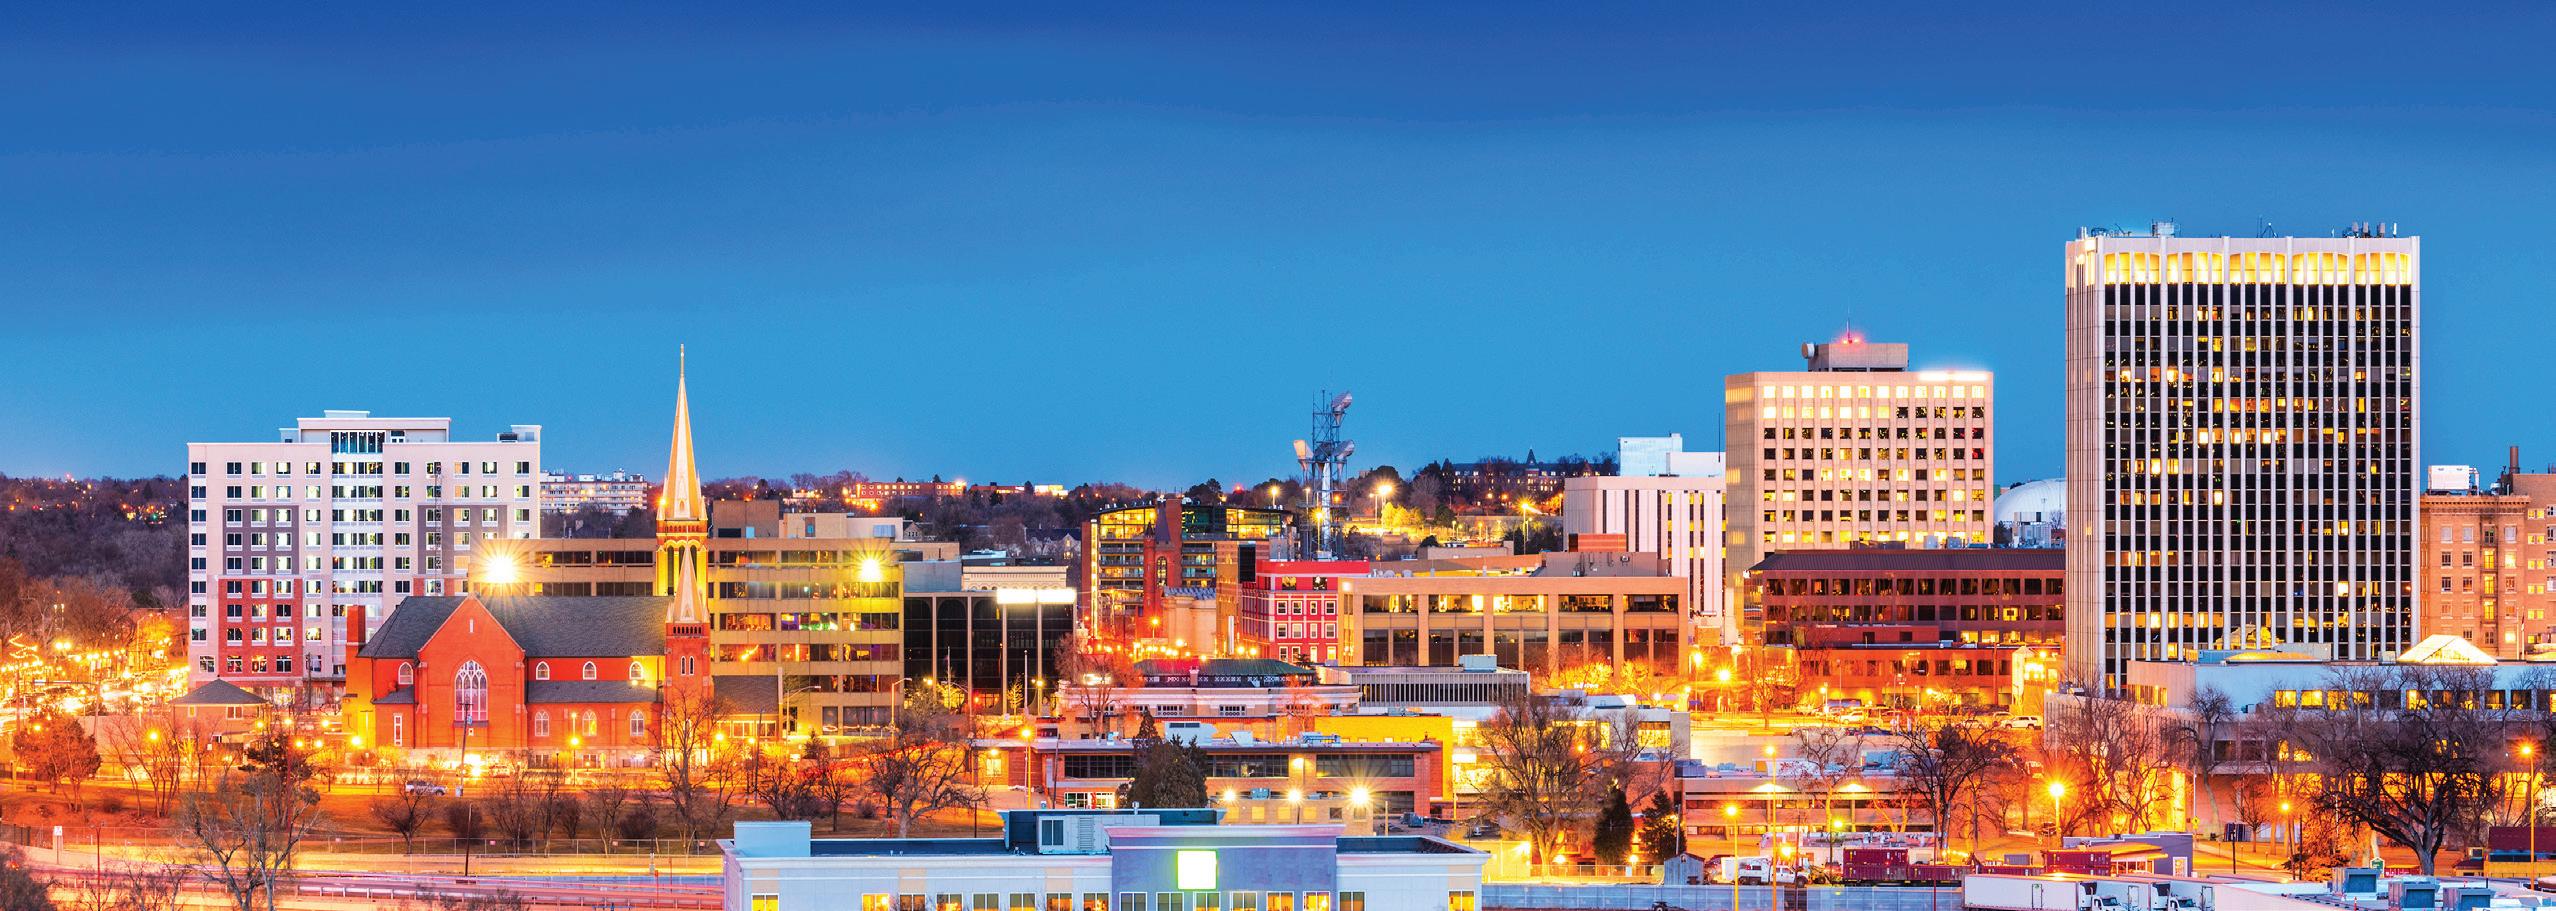
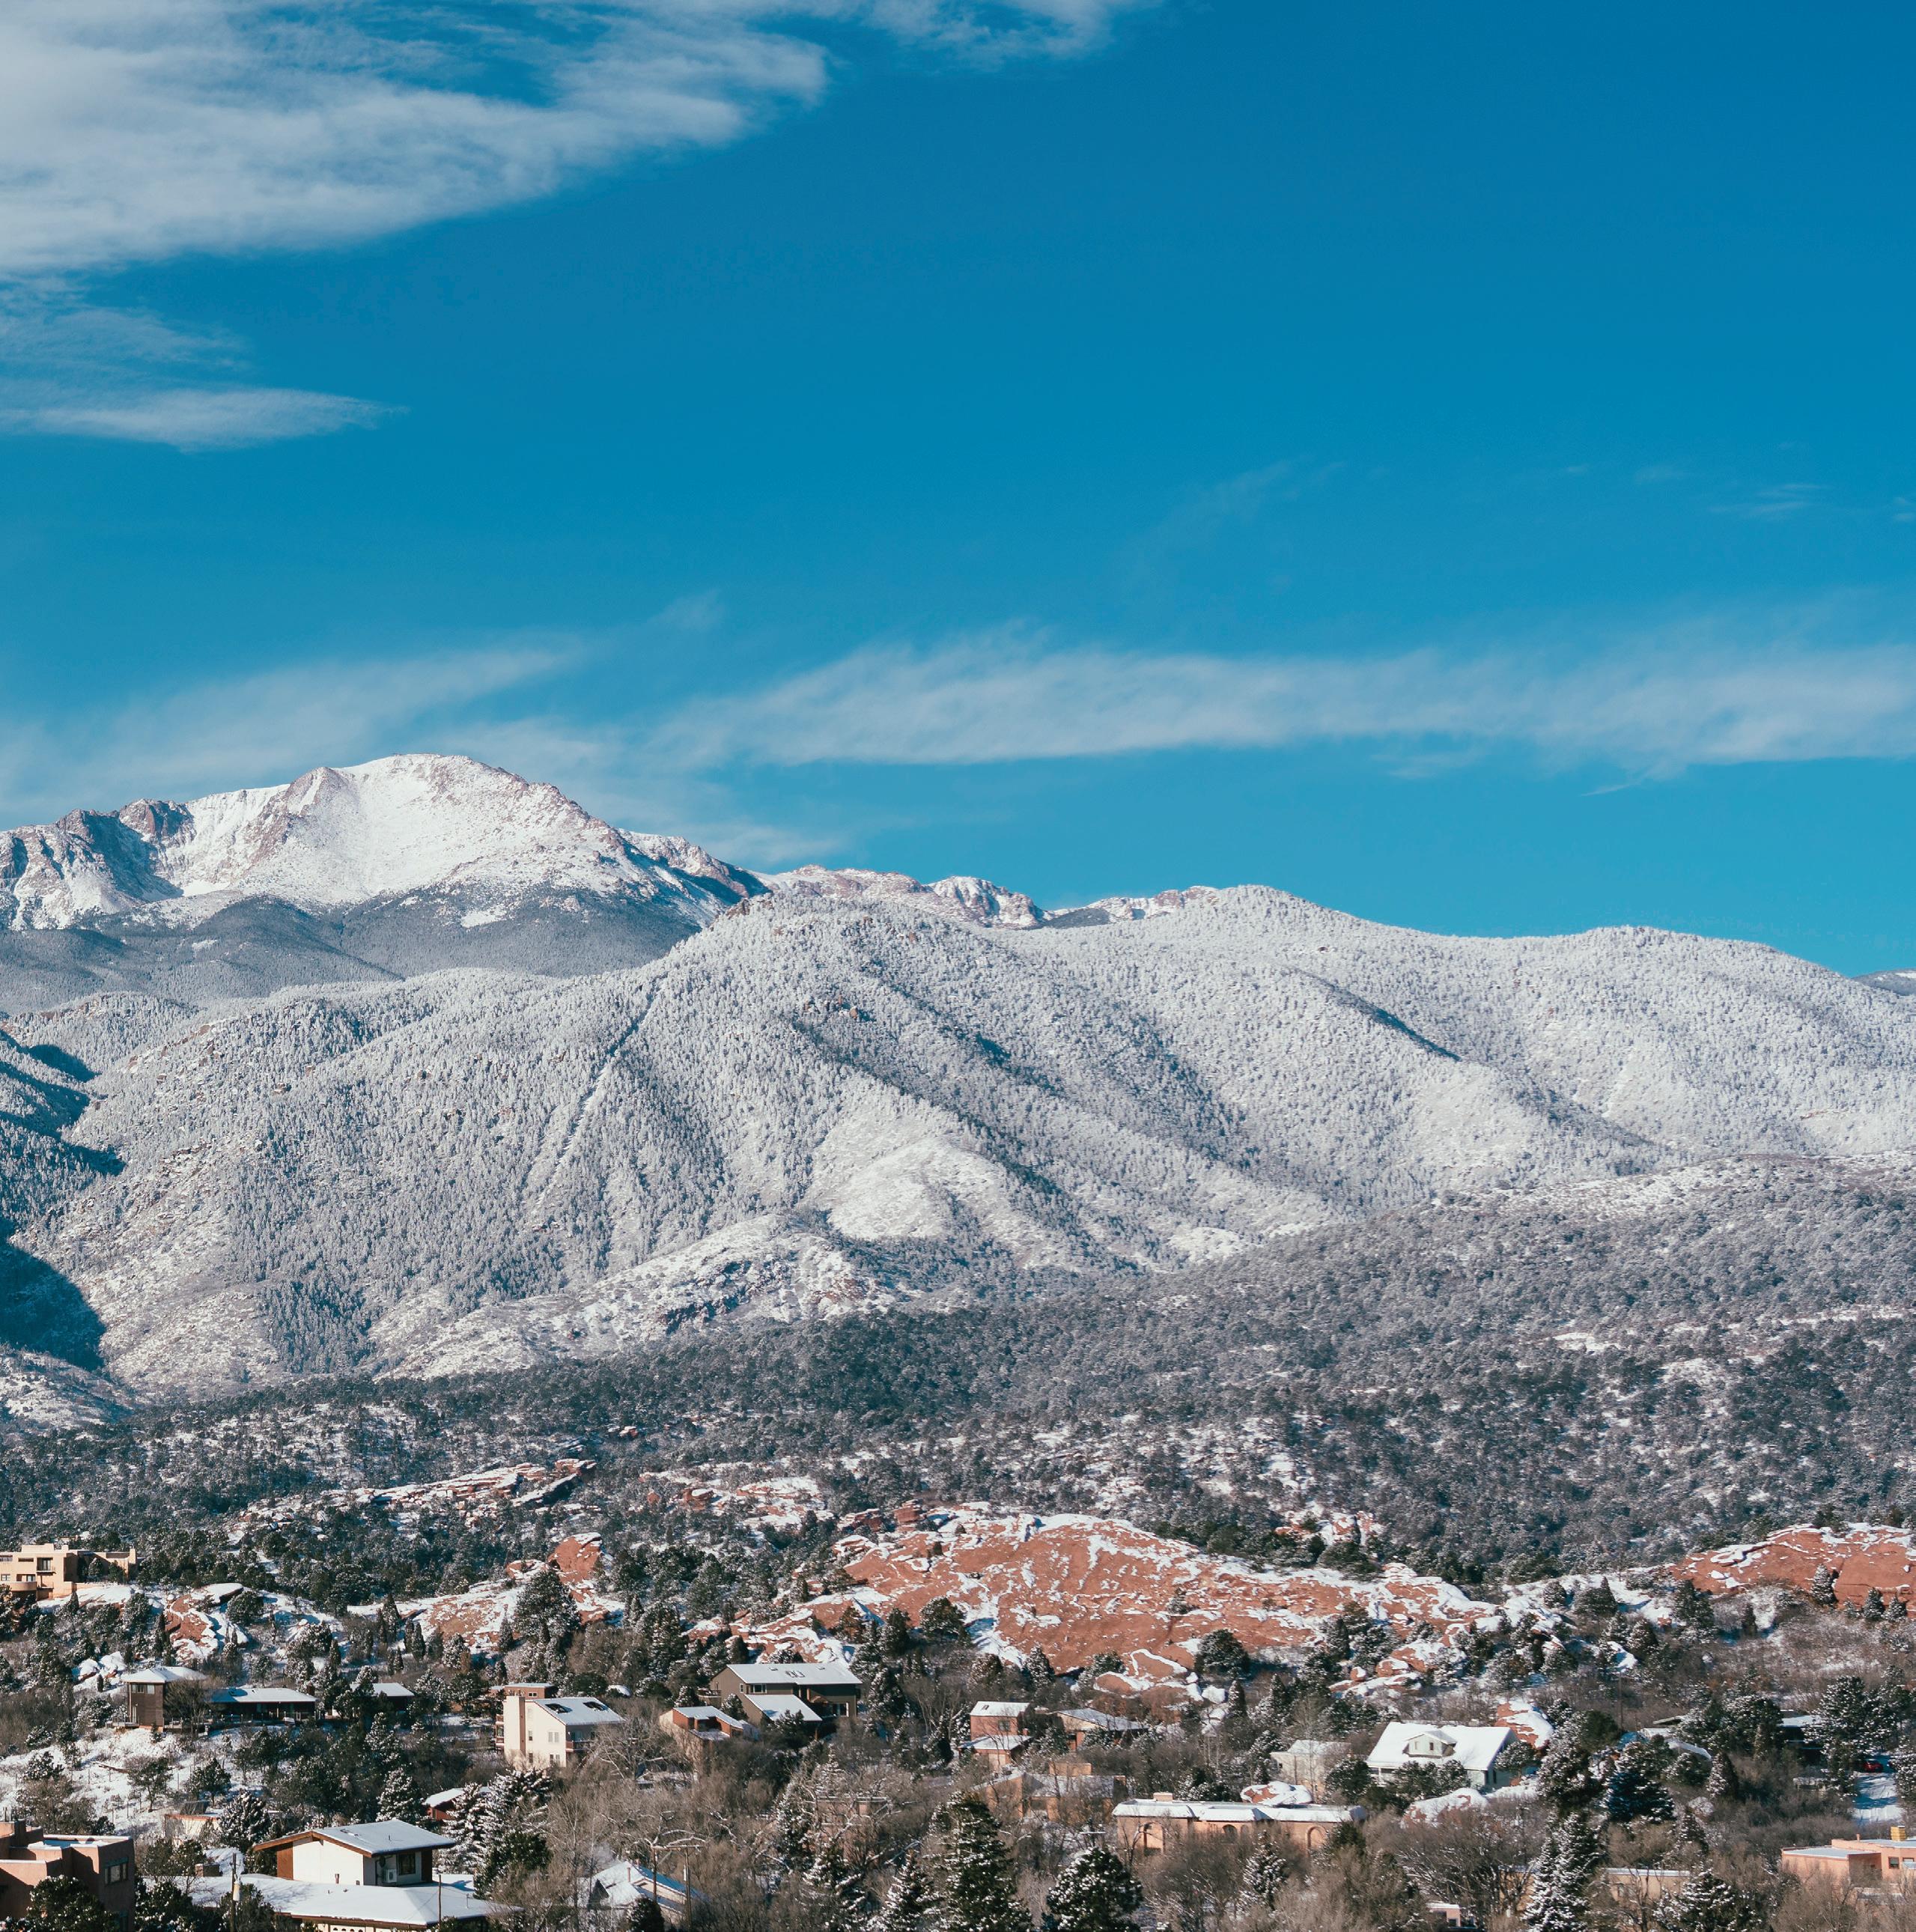
2022 COLORADO SPRINGS


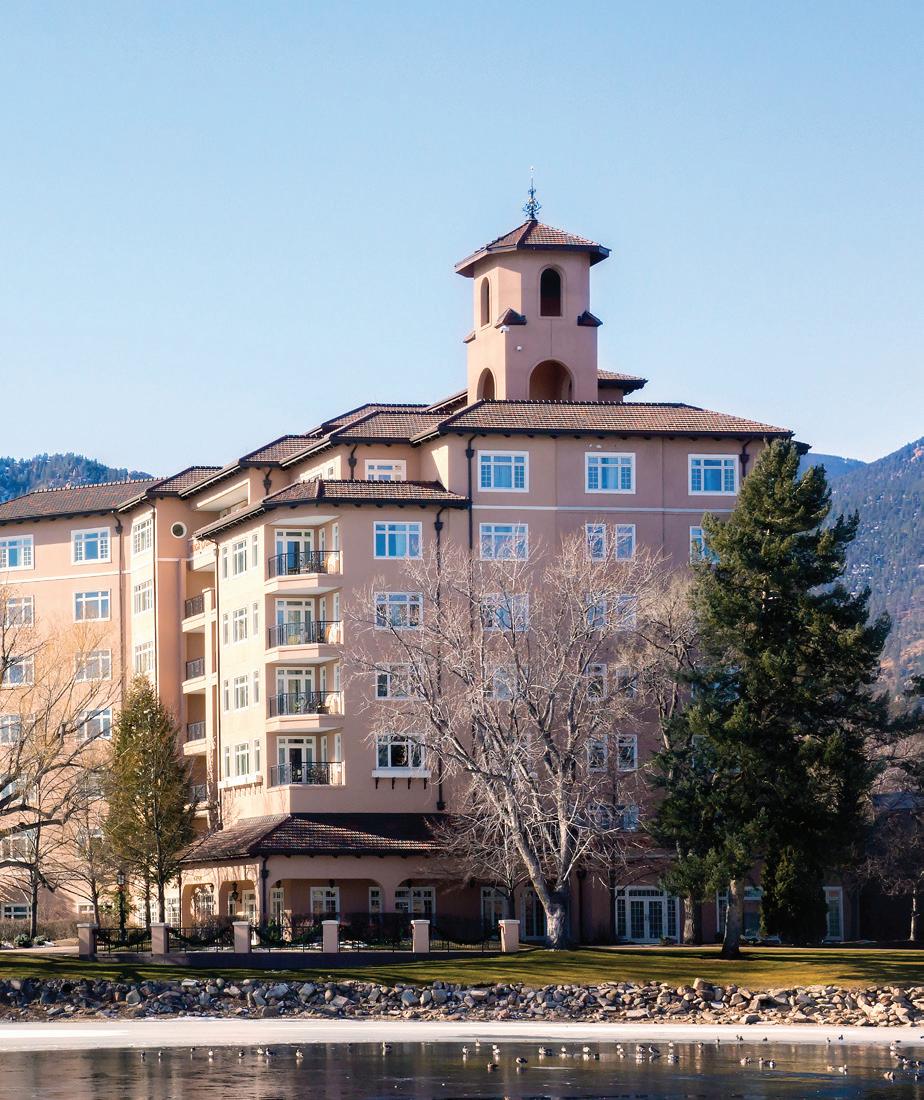
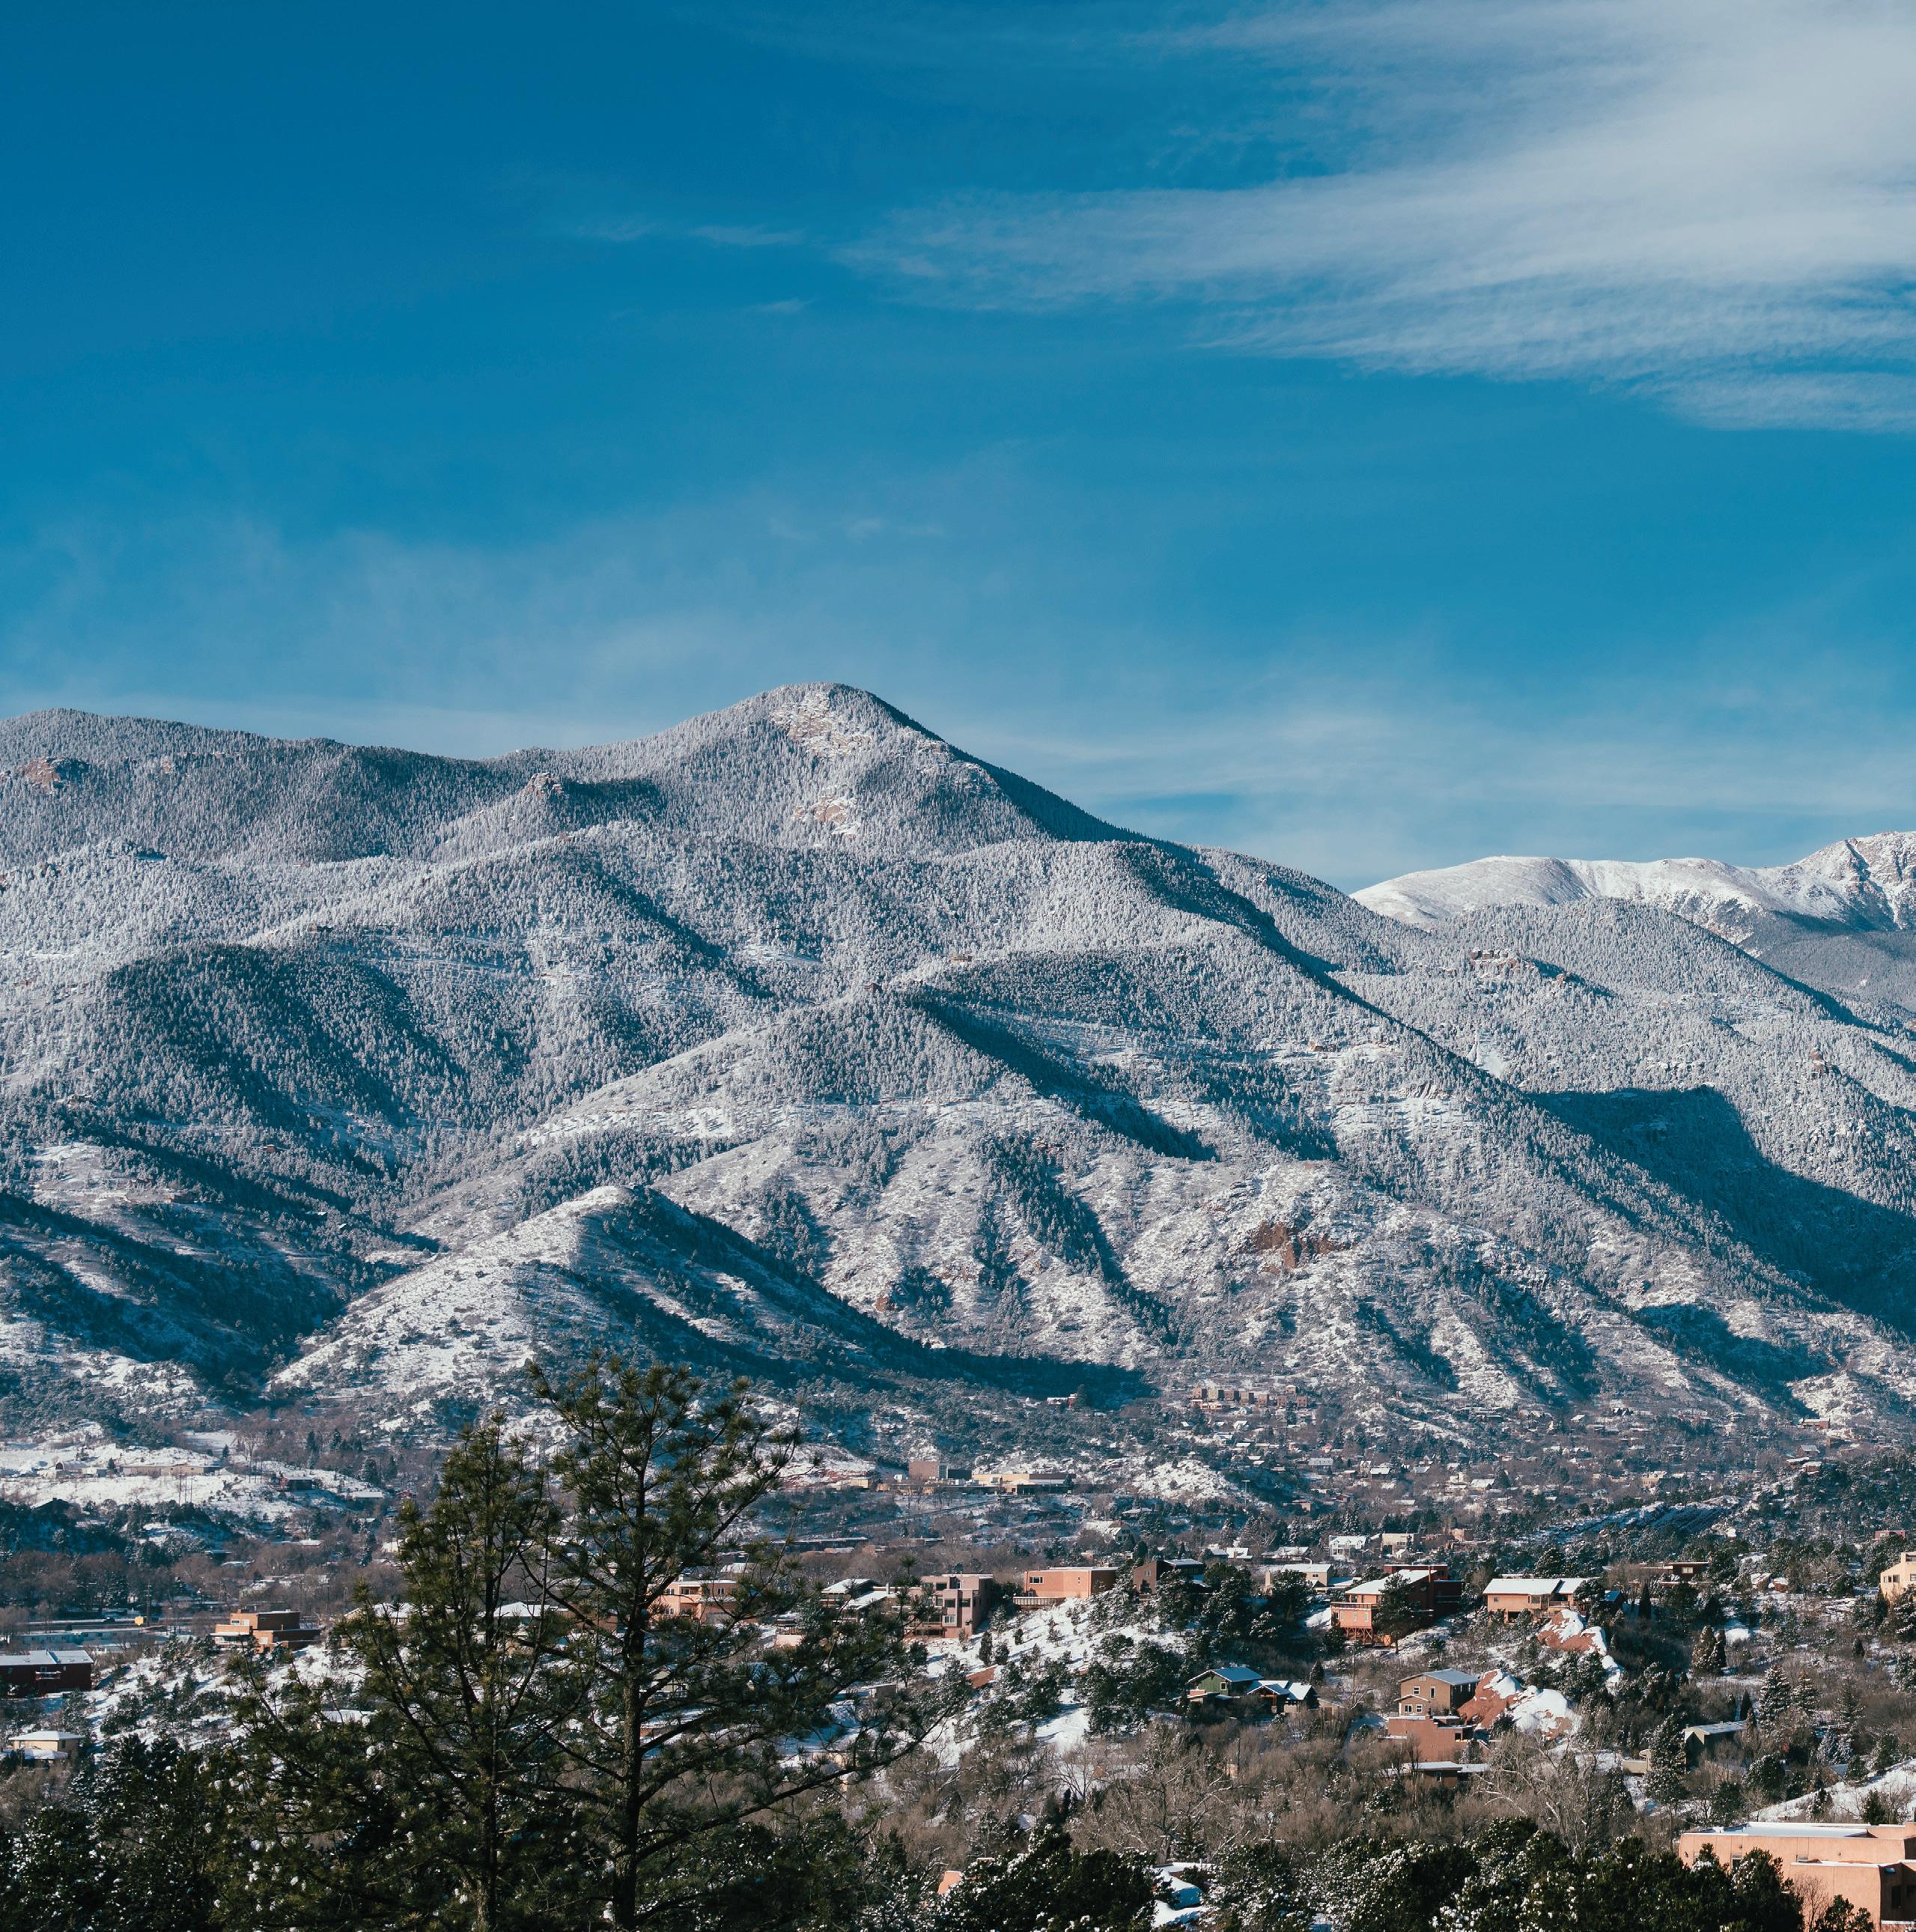
Colorado Springs, the state’s second largest city, is currently one of the most sought-after areas to live in the country. This colorful Colorado community offers its residents exciting entertainment options, unique cultural offerings, and enough outdoor activities to keep any adventurer satisfied. Thanks to the amazing array of lifestyles this city can cater to, more consumers are deciding to make this community their home.
2022 is now over and what a year it was. In the last half of 2022, the real estate market showed strong signs of normalizing after the 2021 COVID-driven boom.The first half of the year was still driven by incredibly high buyer demand, and it felt similar to the 2021 market. The market started to shift when mortgage interest rates started to rise. This was intended to tamp down buyer demand, but because of limited inventory in Colorado Springs—which saw a decrease of 5.3% in new listings in 2022 as compared to 2021—they still managed to have historically high appreciation averaging 10.0% for the average home price.
The media and many “experts” anticipated that home prices would fall in, but that hasn’t been the case in highly sought out areas like Colorado Springs. To further understand the Colorado Springs market, one must look at micro markets because there are many nuances within a small geographic region. In 2022, The Farm saw a 23.4% average price increase compared to 2021, and the Skyway neighborhood saw a 2.7% decrease for the same time period.
We recognize each neighborhood is unique and no two regions respond to market shifts the same way. To aid in presenting an accurate picture of each of the areas that make up Colorado Springs, LIV Sotheby’s International Realty is proud to present our year-end Micro Market Report, representing the metrics of many key and beloved neighborhoods.
Considering the lifestyle and market advantages that Colorado Springs provides to its residents, this community will continue to be a popular destination for those looking to buy and sell homes in the state.
Counties: El Paso, Teller

The average home sale price in Broadmoor Bluffs/The Spires increased by 14.6% in 2022 compared to that of 2021.
Average
January
January
Average Price $675,102 $787,586 16.7%
Average Price Per Square Foot $180 $211 17.2%
Average Days on Market 25 36 44.0%
Highest Price $990,900 $1,248,642 26.0%
Properties Sold 167 164 -1.8%
% Sold Price to List Price 101.3% 100.3% -1.0%
The highest home sale price in Cordera increased by 26.0% in 2022 compared to that of 2021.
Average Price $859,667 $947,913 10.3%
Average Price Per Square Foot $202 $224 10.9%
Average Days on Market 20 30 50.0%
Highest Price $3,800,000 $3,500,000 -7.9%
Properties Sold 159 130 -18.2%
%
-0.8%
The Colorado lifestyle comes together in one magnificent vision at Flying Horse, where you’ll find elegant homes, breathtaking views, and a private resort-style athletic club and spa. With homes priced from the upper $400k’s to custom homes in the millions, there’s something for everyone.

Average Price
$1,151,364 $1,409,626 22.4%
Average Price Per Square Foot $296 $367 24.0%
Average Days on Market 36 55 52.8%
Highest Price $3,800,000 $4,390,265 15.5%
Properties Sold 37 30 -18.9%
% Sold Price to List Price 99.5% 102.5% 3.0%
Mountain Shadows is a unique community built up against the Rocky Mountains. It’s located off of Centennial Boulevard and Flying W Ranch Road, just minutes from Garden of the Gods.
January
Average Price $620,827 $726,545 17.0%
Average Price Per Square Foot $188 $205 9.0%
Average Days on Market 22 26 18.2%
Highest Price $1,265,000 $1,150,000 -9.1% Properties Sold 97 60 -38.1%
% Sold Price to List Price 102.1% 100.1% -2.0%
The average price per square foot in Peregrine increased by 11.0% in 2022 compared to that of 2021.
Average
Highest Price $2,400,000 $1,425,000 -40.6% Properties Sold 111 90 -18.9%
% Sold Price to List Price 103.0% 101.2% -1.7%
January
Average Price $845,565 $883,584 4.5%
Average Price Per Square Foot $182 $202 11.0%
Average Days on Market 17 19 11.8%
Highest Price $1,295,000 $1,450,000 12.0% Properties Sold 51 32 -37.3%
% Sold Price to List Price 102.9% 100.9% -1.9%
Average
The average price per square foot in Pine Creek increased by 13.1% in 2022 compared to that of 2021.
The average price per square foot in Skyway increased by 10.4% in 2022 compared to that of 2021.
The average home sale price in Wolf Ranch increased by 13.6% in 2022 compared to that of 2021.
January through December 2021 2022 % Change
Average Price
$593,403 $674,230 13.6%
Average Price Per Square Foot $168 $203 20.8%
Average Days on Market 38 60 57.9%
Highest Price $920,375 $969,353 5.3% Properties Sold 278 280 0.7%
% Sold Price to List Price 101.8% 101.0% -0.8%
The average home sale price in Woodmoor increased by 12.3% in 2022 compared to that of 2021.
January through December
Average Price
2021 2022 % Change
$688,765 $773,519 12.3%
Average Price Per Square Foot $194 $212 9.3%
Average Days on Market 13 21 61.5%
Highest Price $1,275,000 $1,350,000 5.9% Properties Sold 220 175 -20.5%
% Sold Price to List Price 102.7% 101.4% -1.3%

MICRO MARKET REPORT | Colorado Springs JANUARY - DECEMBER 2022 • COLORADOMICROREPORTS.COM