
2 minute read
DENVER METRO LUXURY MARKET


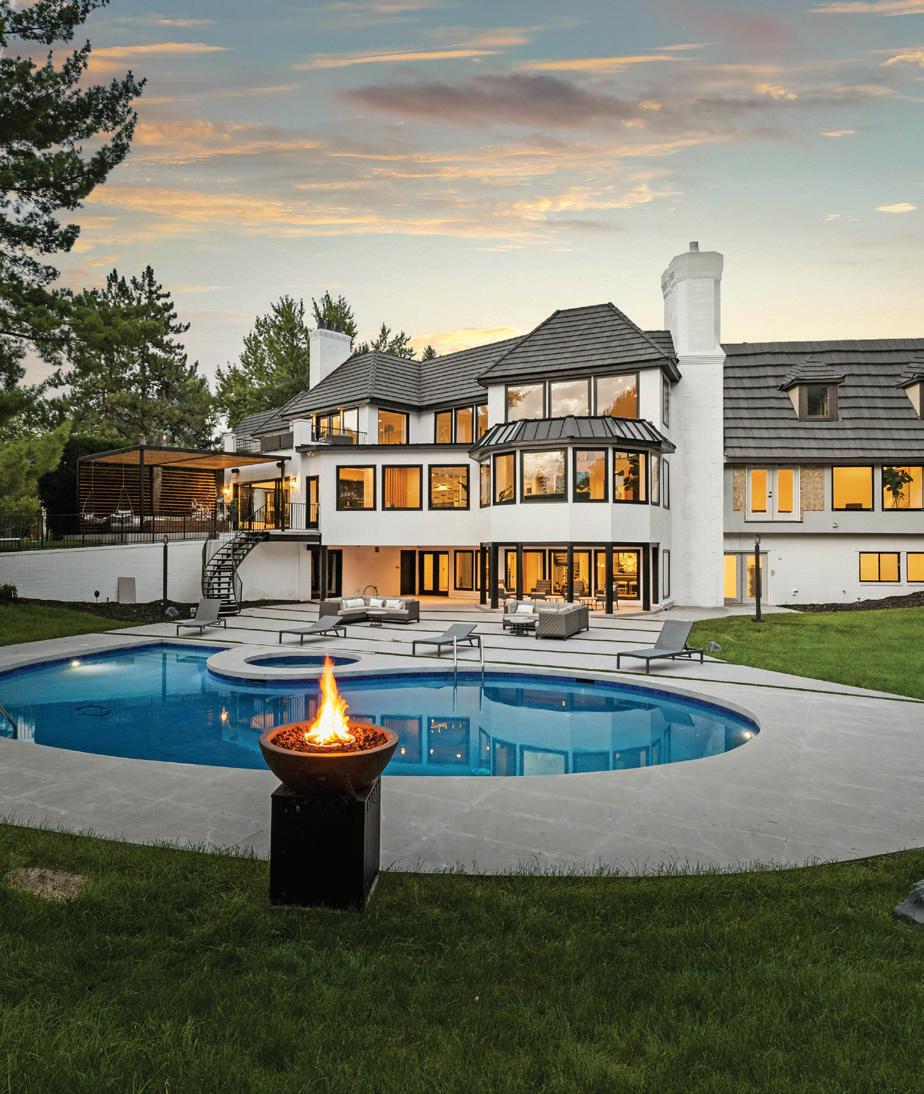
Luxury homes in the Denver Metro offer an upscale Colorado living experience near the excitement of the city while positioning residents just a short drive from some of the state’s most amazing outdoor spaces. Overall, the six counties across Denver Metro have experienced a 7.7% increase in the number of luxury homes sold through December of 2022 compared to 2021, with 5,317 luxury homes sold. The average sale price of those luxury homes decreased by 0.9%, bringing the average price for luxury homes in the community to $1,587,639. The increase in number of properties sold resulted in a 6.8% rise in the total dollar volume sold, totaling $8,441,474,147.
The strength of the market was seen throughout the individual neighborhoods within Denver Metro as well. In Bow Mar/Bow Mar South, there was a 187.5% increase in the number of luxury homes sold, growing from eight homes sold in 2021 to 23 homes sold in 2022. Greenwood Village East also saw rises in luxury home sales, increasing by 11.1%.
As homebuyers compete for luxury real estate in Denver Metro, an upward trend in home prices has been observed. The Washington Park East/Central neighborhood is popular due to its access to the park and the activities and amenities that come with it, saw an 10.5% increase in sale prices for luxury homes. From January to December of this year, the average sold price for luxury homes in this neighborhood was $2,132,638. Cherry Creek North also saw home values appreciate, rising by 14.5% to reach an average sale price of $2,251,398.
Denver Metro’s limited inventory of available luxury homes has motivated buyers to purchase homes in several individual communities more quickly than last year. For example, luxury homes in the Country Club neighborhood spent an average of 24 days on the market in 2022—63.1% less time than the same time period last year.
18.5%
The average price per square foot in Bonnie increased by 18.5% in 2022 compared to that of 2021.
196.7%
The total dollar volume in Bow Mar/ Bow Mar South increased by 196.7% in 2022 compared to that of 2021.
18.9%
The average price per square foot in Cherry Creek North increased by 18.9% in 2022 compared to that of 2021.
The average number of days on market in Cherry Hills Village (over 1 acre) decreased by 66.7% in 2022 compared to that of 2021.
14.5%
The average sale price in Columbine Valley increased by 14.5% in 2022 compared to that of 2021.

56.3%
The average number of days on market in Crestmoor decreased by 56.3% in 2022 compared to that of 2021.
17.3%
The average price per square foot in Greenwood Village West (over 1 acre) increased by compared to that in

42.1%
The average number of days on market in Greenwood Village West (under 1 acre) decreased by 42.1% in 2022 compared to that of 2021.
43.4%
The average price per square foot in Huntington Trails/Lexington increased by 43.4% in 2022 compared to that of 2021.
57.1%
The average number of days on market in Ken Caryl North Ranch decreased by 57.1% in 2022 compared to that of 2021.
23.5%
The highest sale price in Mayfair/ increased by 23.5% in 2022 compared to that of 2021.
84.9%
The average number of days on market in Polo Reserve decreased by 84.9% in 2022 compared to that of 2021.

The average home sale price in Spruce Meadows increased by 52.4% in 2022 compared to that of 2021.


