
Micro Market Report YEAR-END
SOUTH METRO
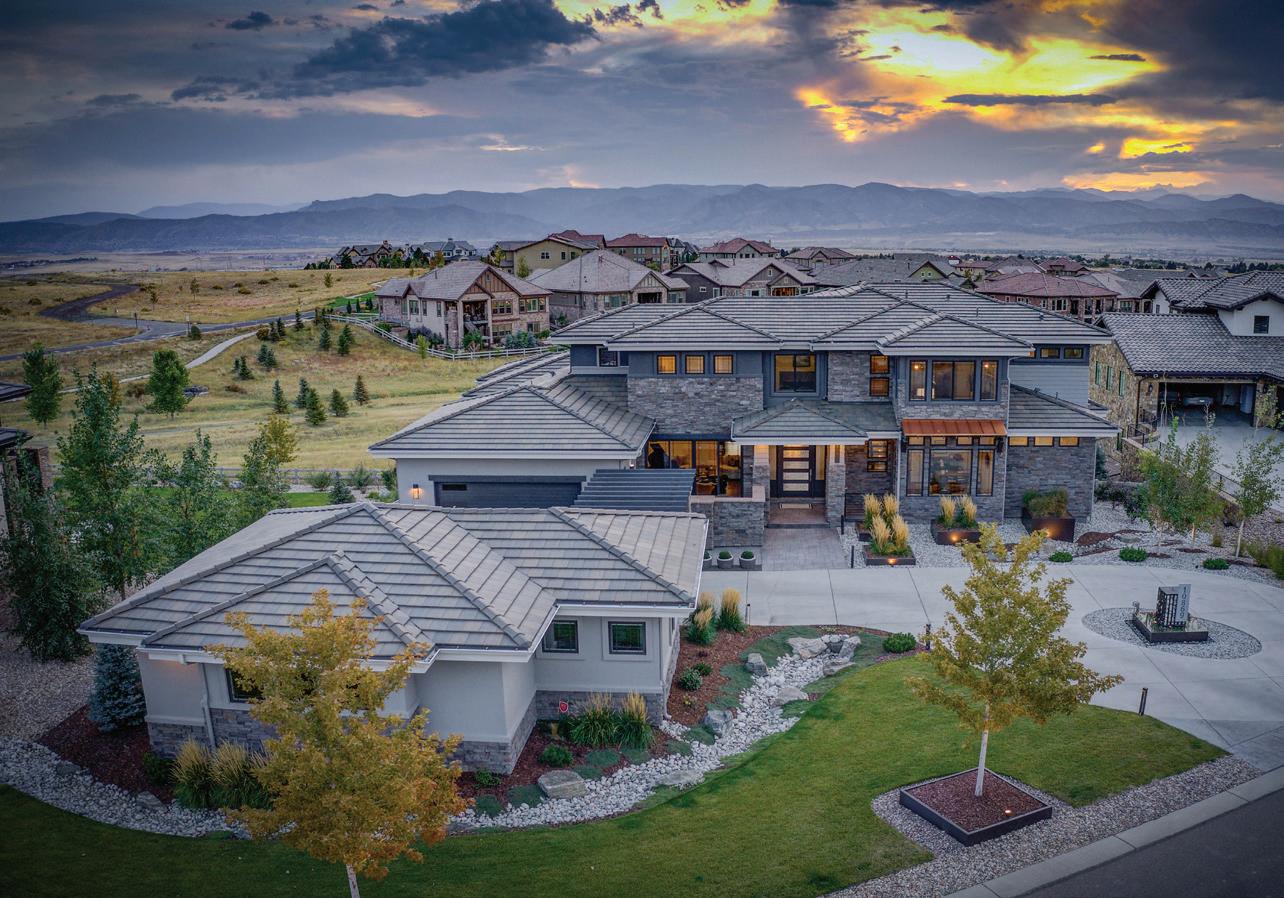
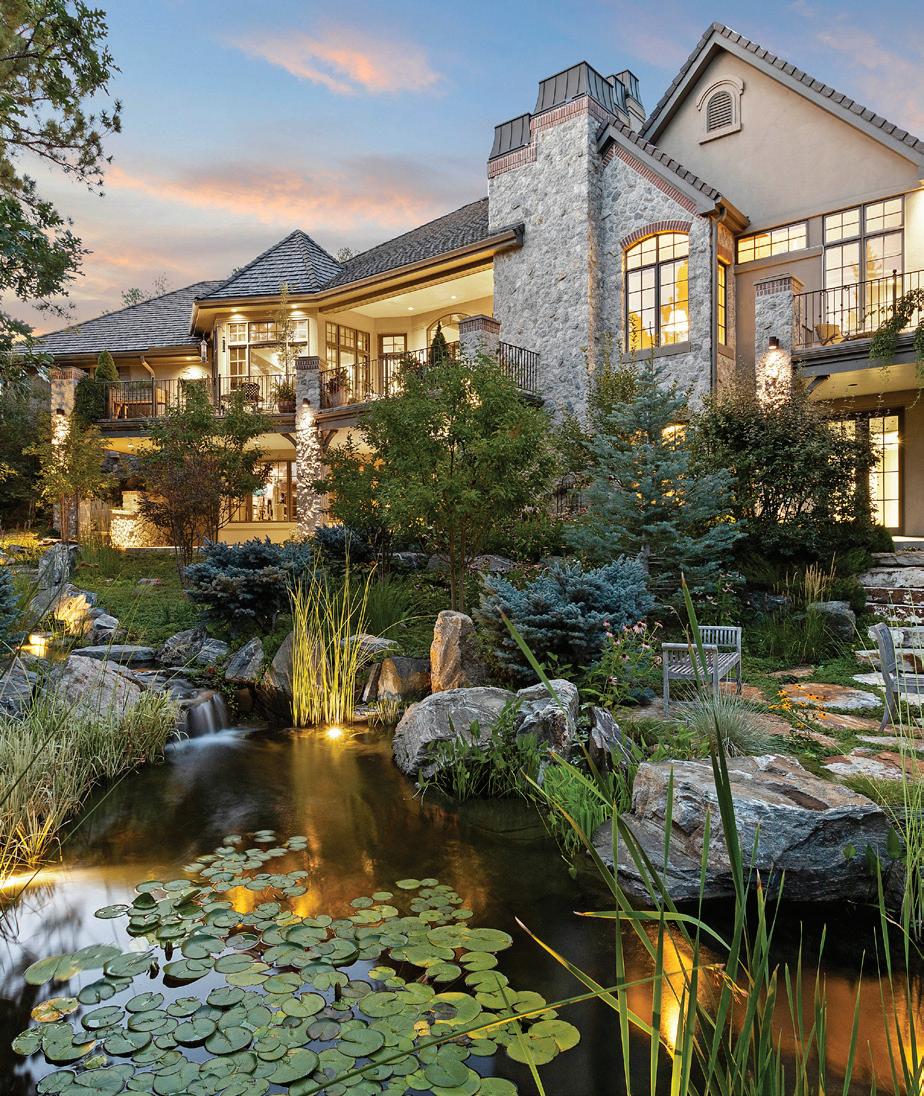
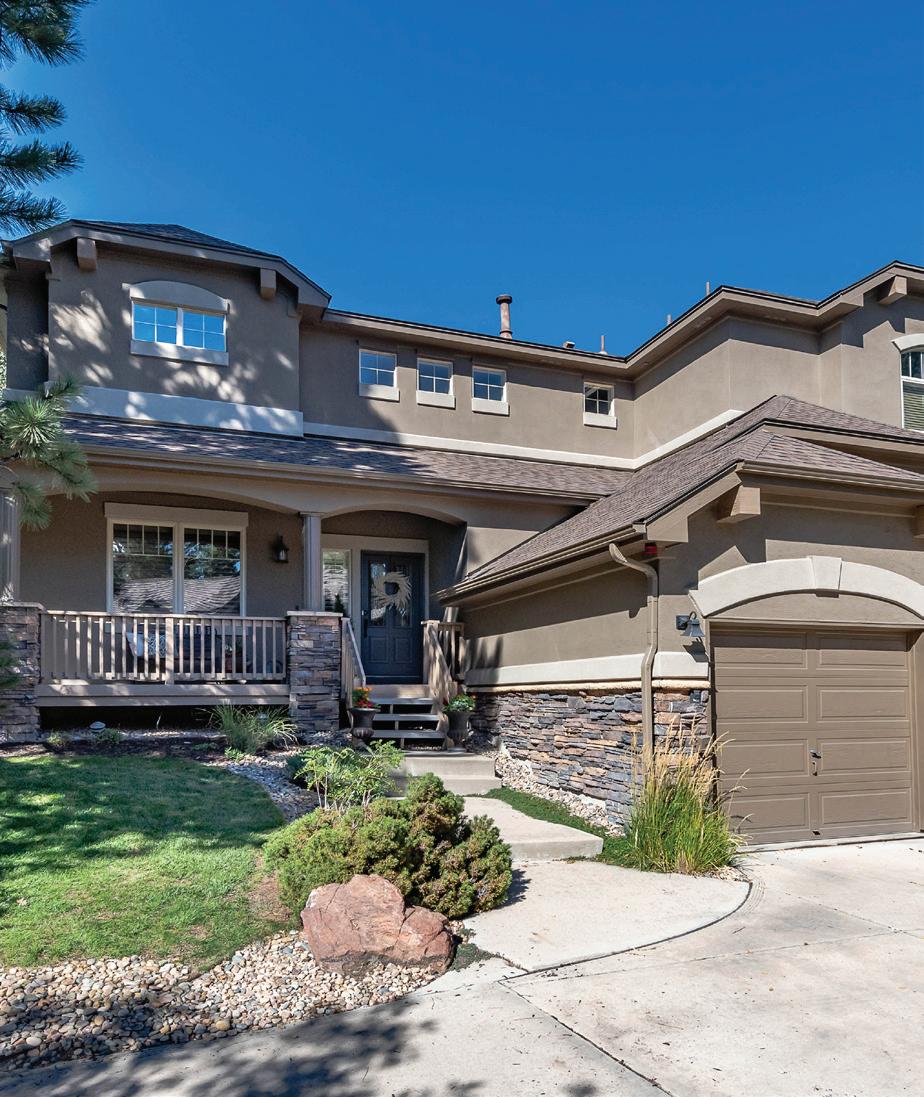
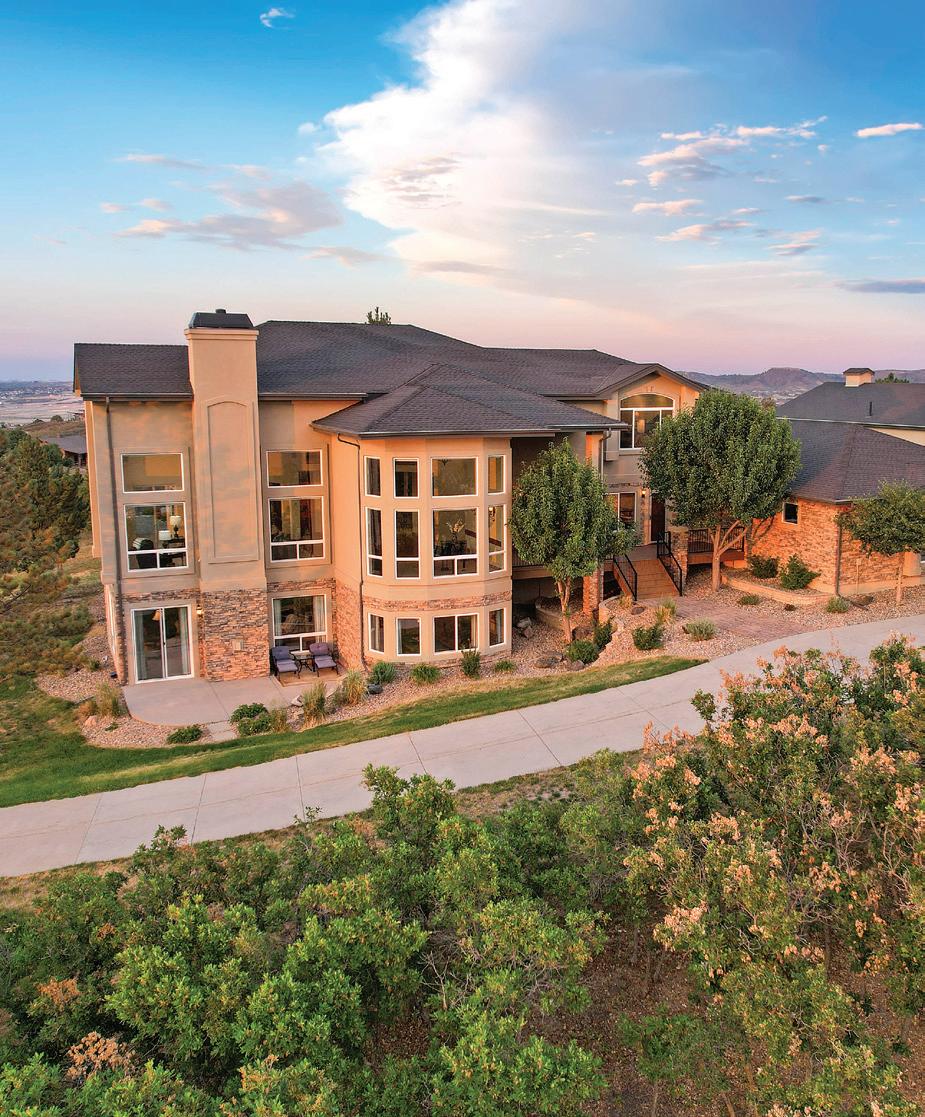
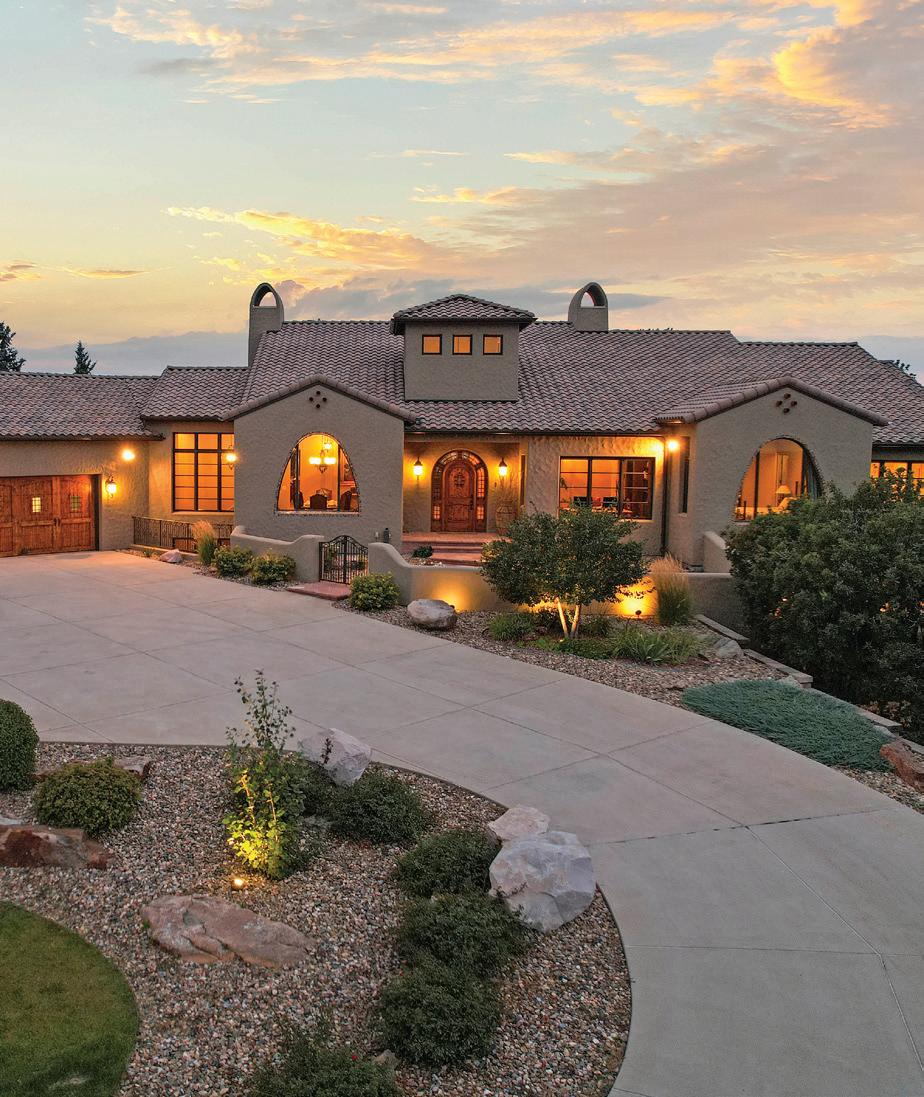
 386 Castle Pines Drive
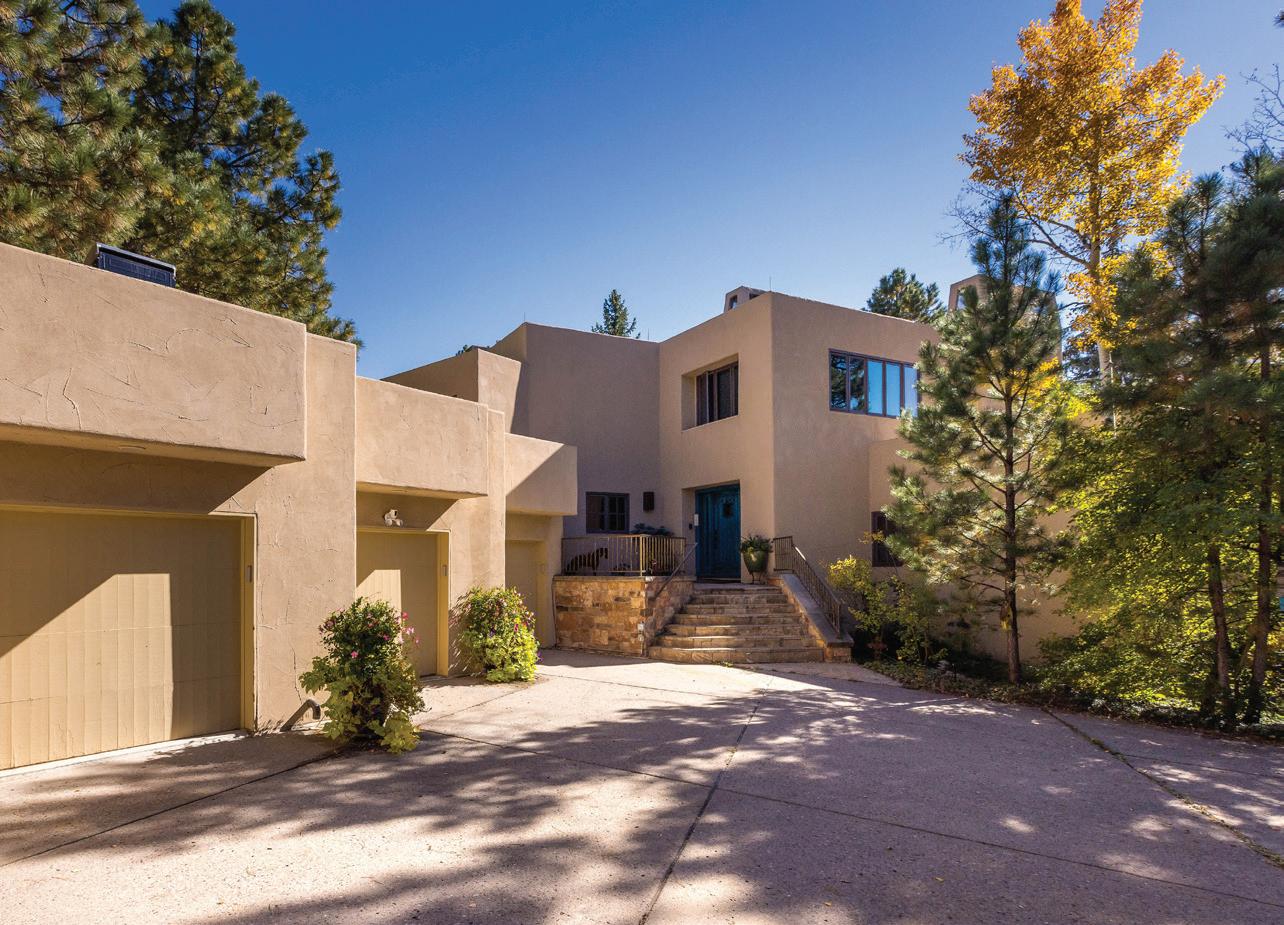
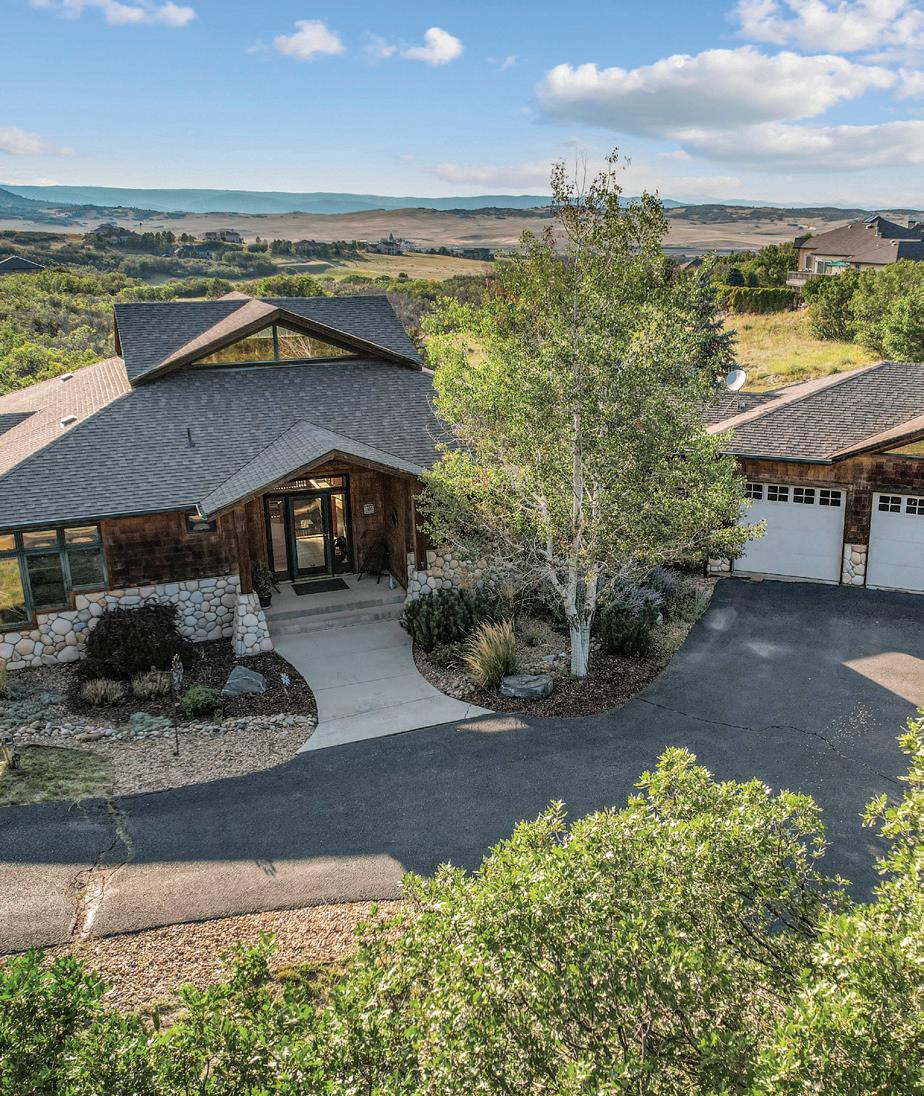
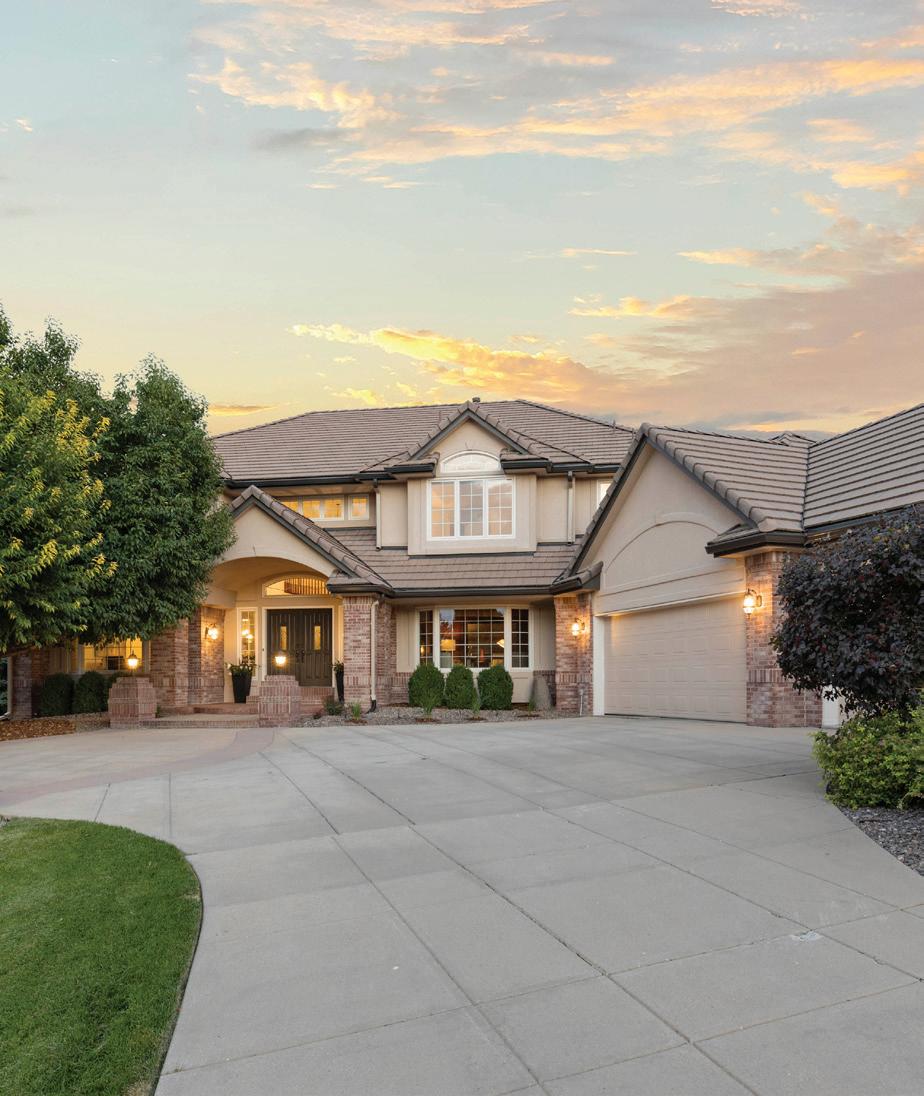
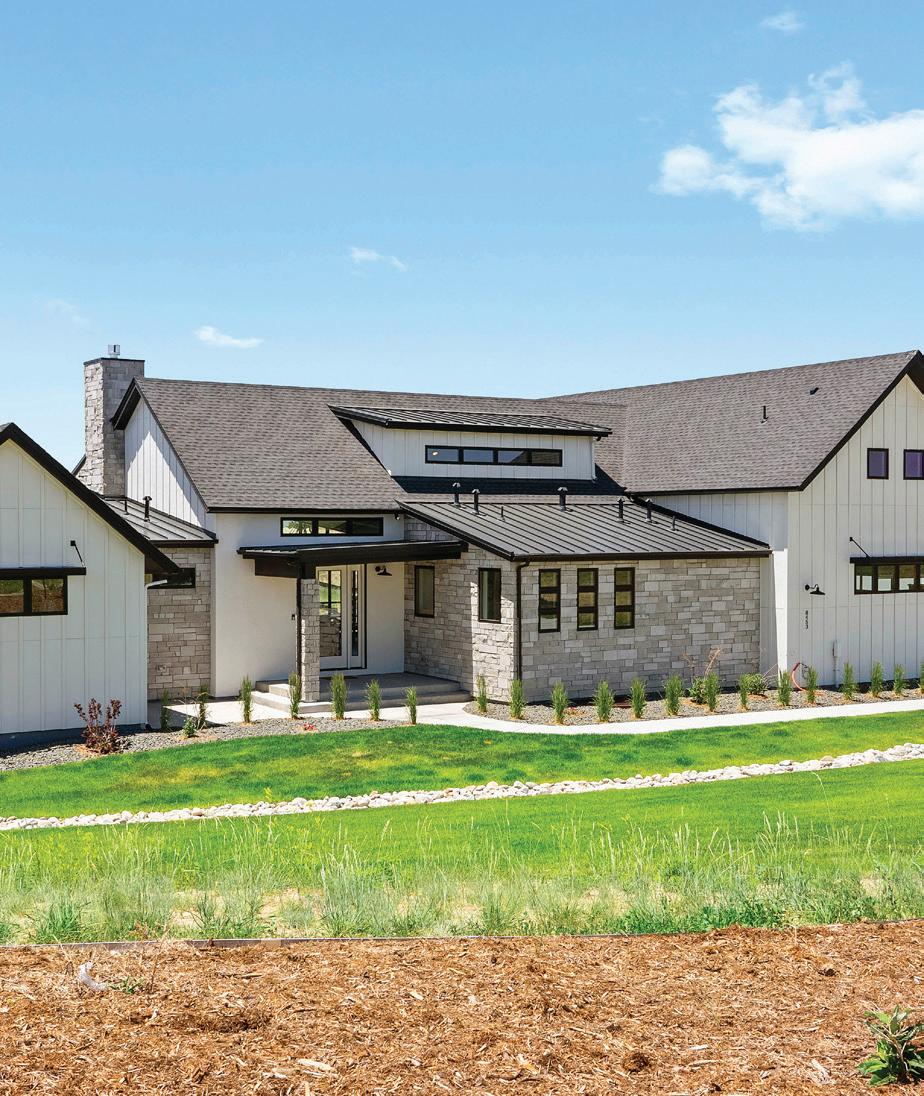
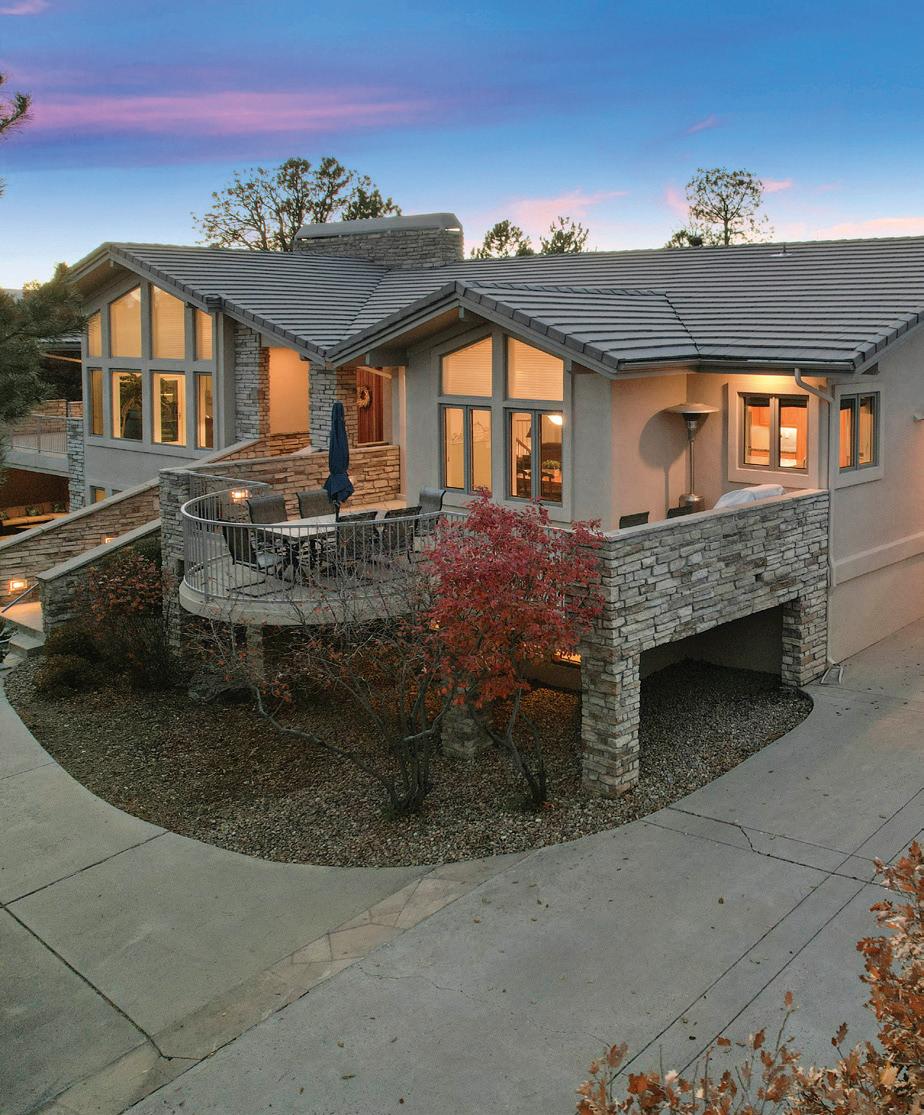
10869 Evergold Way
386 Castle Pines Drive
10869 Evergold Way
MARKET UPDATE South Metro
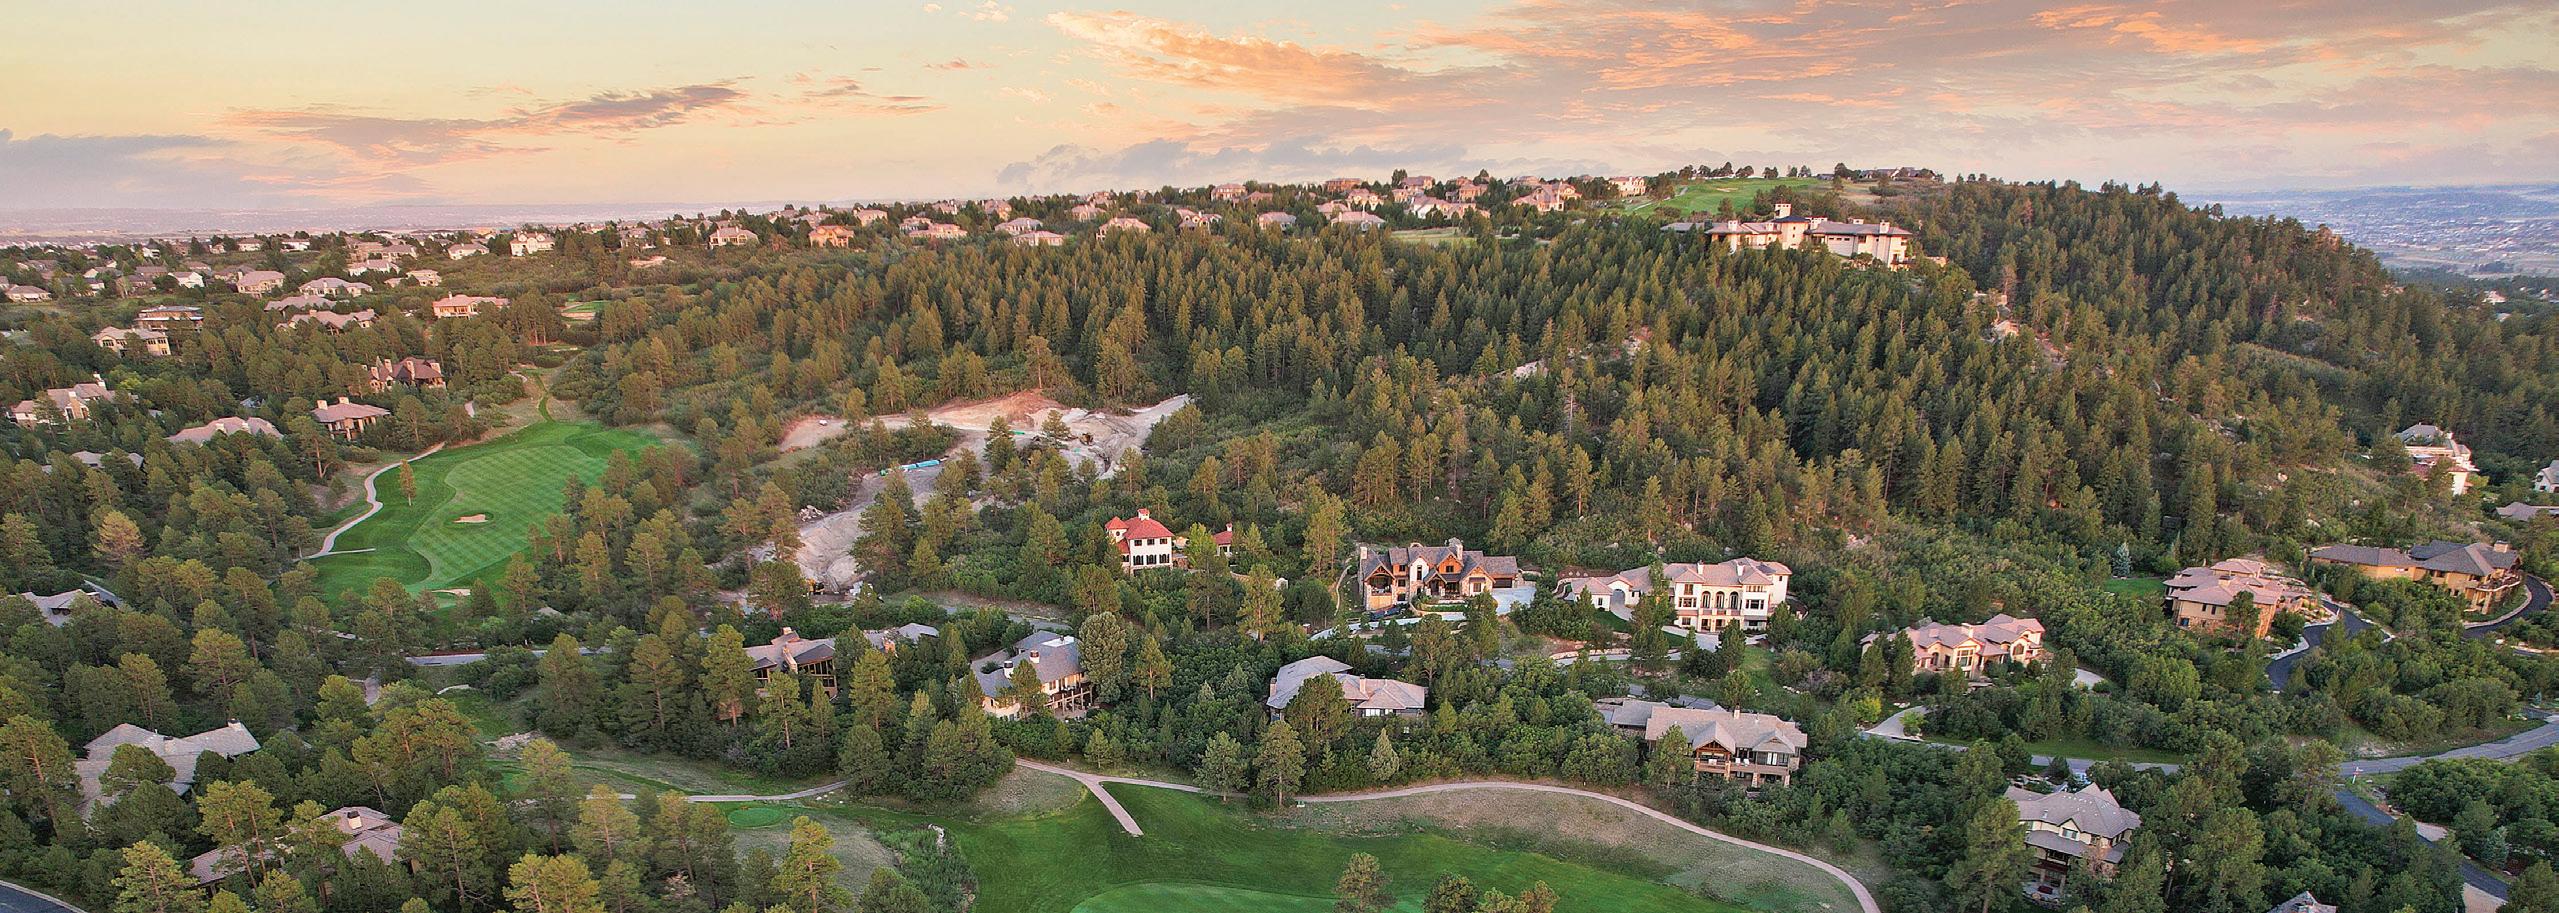
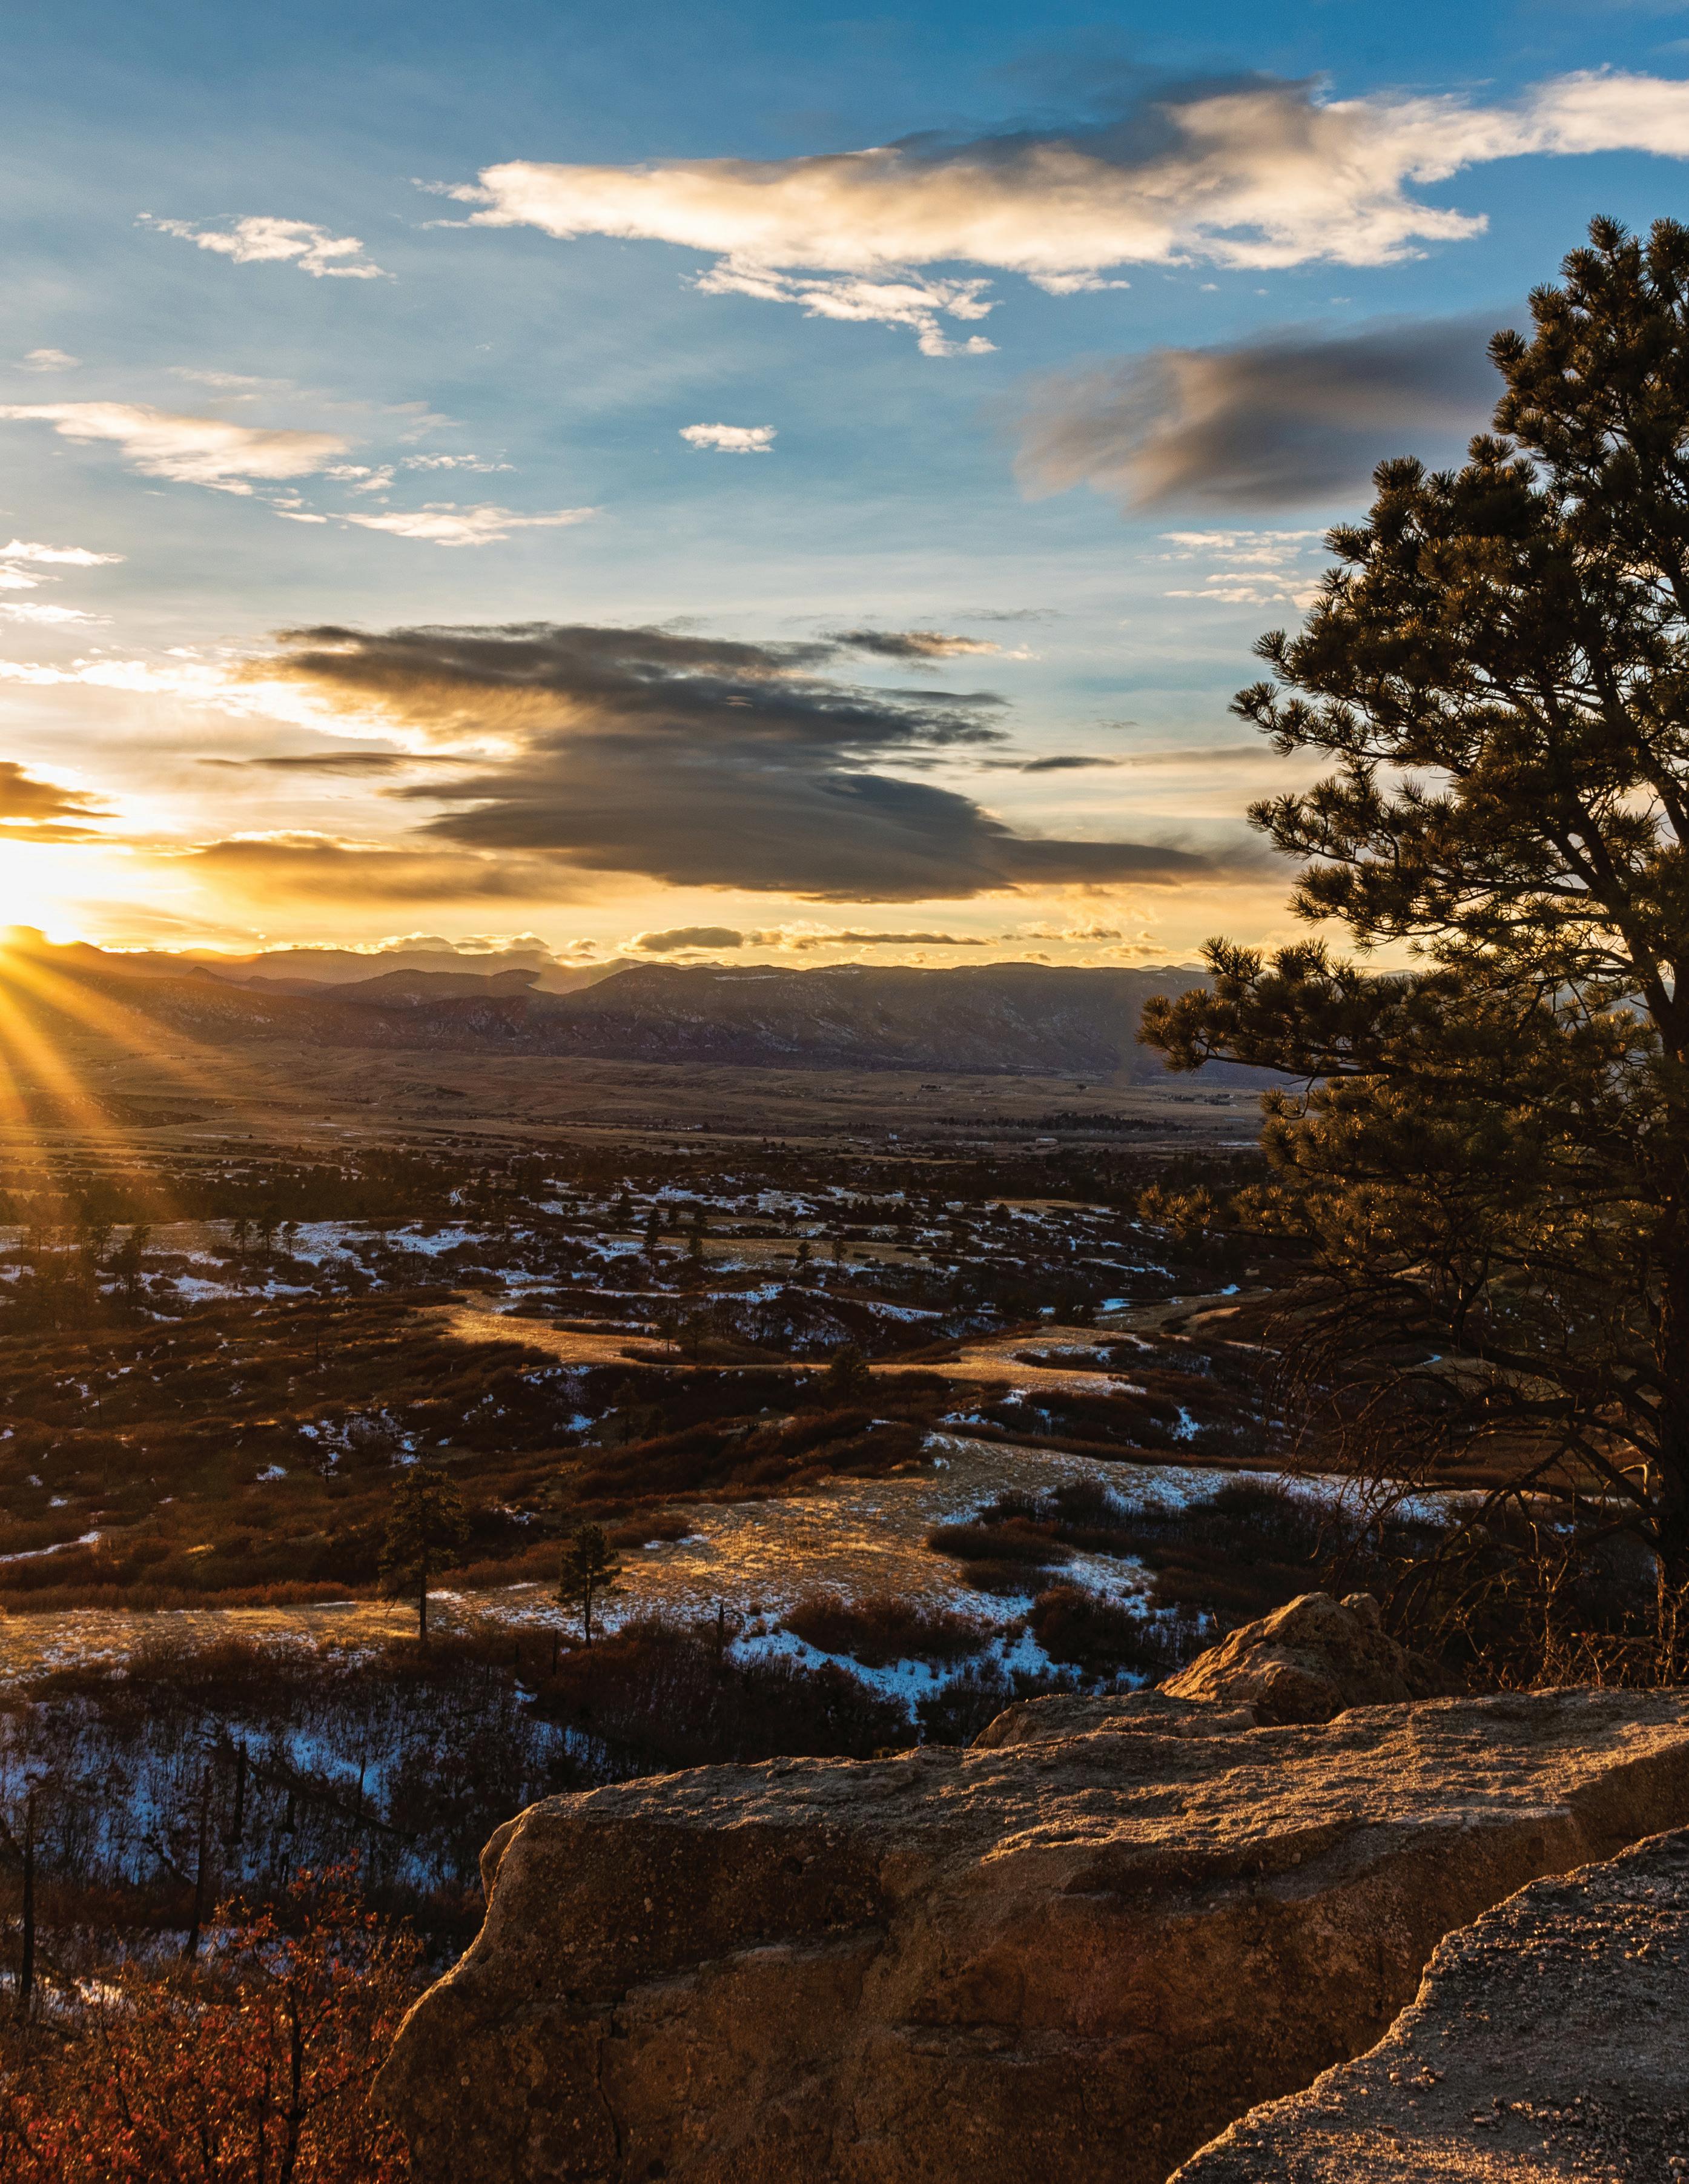
Denver’s South Metro region offers a wide selection of communities that can cater to almost every lifestyle. From spacious ranch properties to exquisitely planned communities and modern condominium living, there’s something here for everyone. Featuring an abundance of parks, trails, and other recreation options in addition to a bustling business hub and endless entertainment choices, it’s no wonder why the South Metro community has remained a favorite for those looking to write their next chapter in a Colorado home.
2022 is now over and what a year it was. In the last half of 2022, the real estate market showed strong signs of normalizing after the 2021 COVID-driven boom. The first half of the year saw incredibly high buyer demand, and it felt similar to the 2021 market. The market started to shift when mortgage interest rates started to rise. This was intended to tamp
down buyer demand, but because of limited inventory in Douglas County—which saw a 7.3% decrease in new listings in 2022 as compared to 2021—they still managed to have historically high appreciation averaging 12.5% for the average price of detached homes.
We recognize each locality is unique and no two regions respond to market shifts the same way. To present an accurate picture of each of the areas that make up Denver’s South Metro region, LIV Sotheby’s International Realty is proud to present our year-end Micro Market Report, representing the metrics of many key and beloved neighborhoods.
Conveniently located near all the very best activities and amenities that the Front Range has to offer, the South Metro community is a haven for homebuyers and sellers hoping to reach their lifestyle goals in Colorado.
Douglas County
coloradomicroreports.com Based on Information from REColorado for the period January 1st, 2022 - December 31th, 2022. This representation is based in whole or in part on data supplied by REColorado. REColorado does not guarantee nor is in any way responsible for its accuracy. Data maintained by REColorado may not reflect all real estate activity in the market. January through December 2021 2022 % Change New Listings 9,300 8,624 -7.3% Sold Listings (All Properties) 8,920 7,267 -18.5% Average Price (All Properties) $719,192 $808,769 12.5% Average Price (Single Family) $772,910 $861,513 11.5% Average Days on Market 14 22 57.1% % Sold Price to Original List Price 102.1% 100.0% -2.1% Total Dollar Volume Sold $6,415,196,580 $5,877,322,263 -8.4%
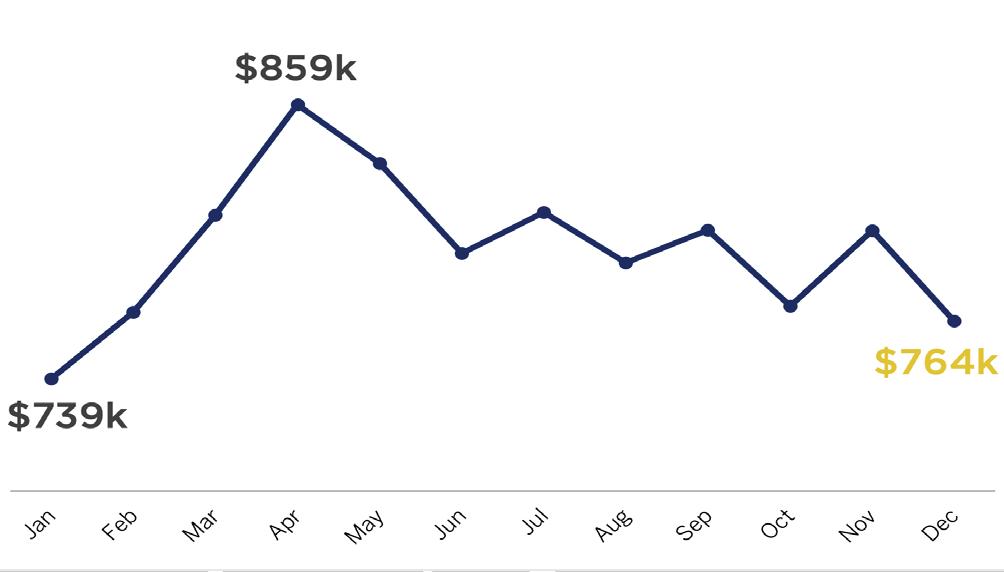
Average Sales Price (All Properties)
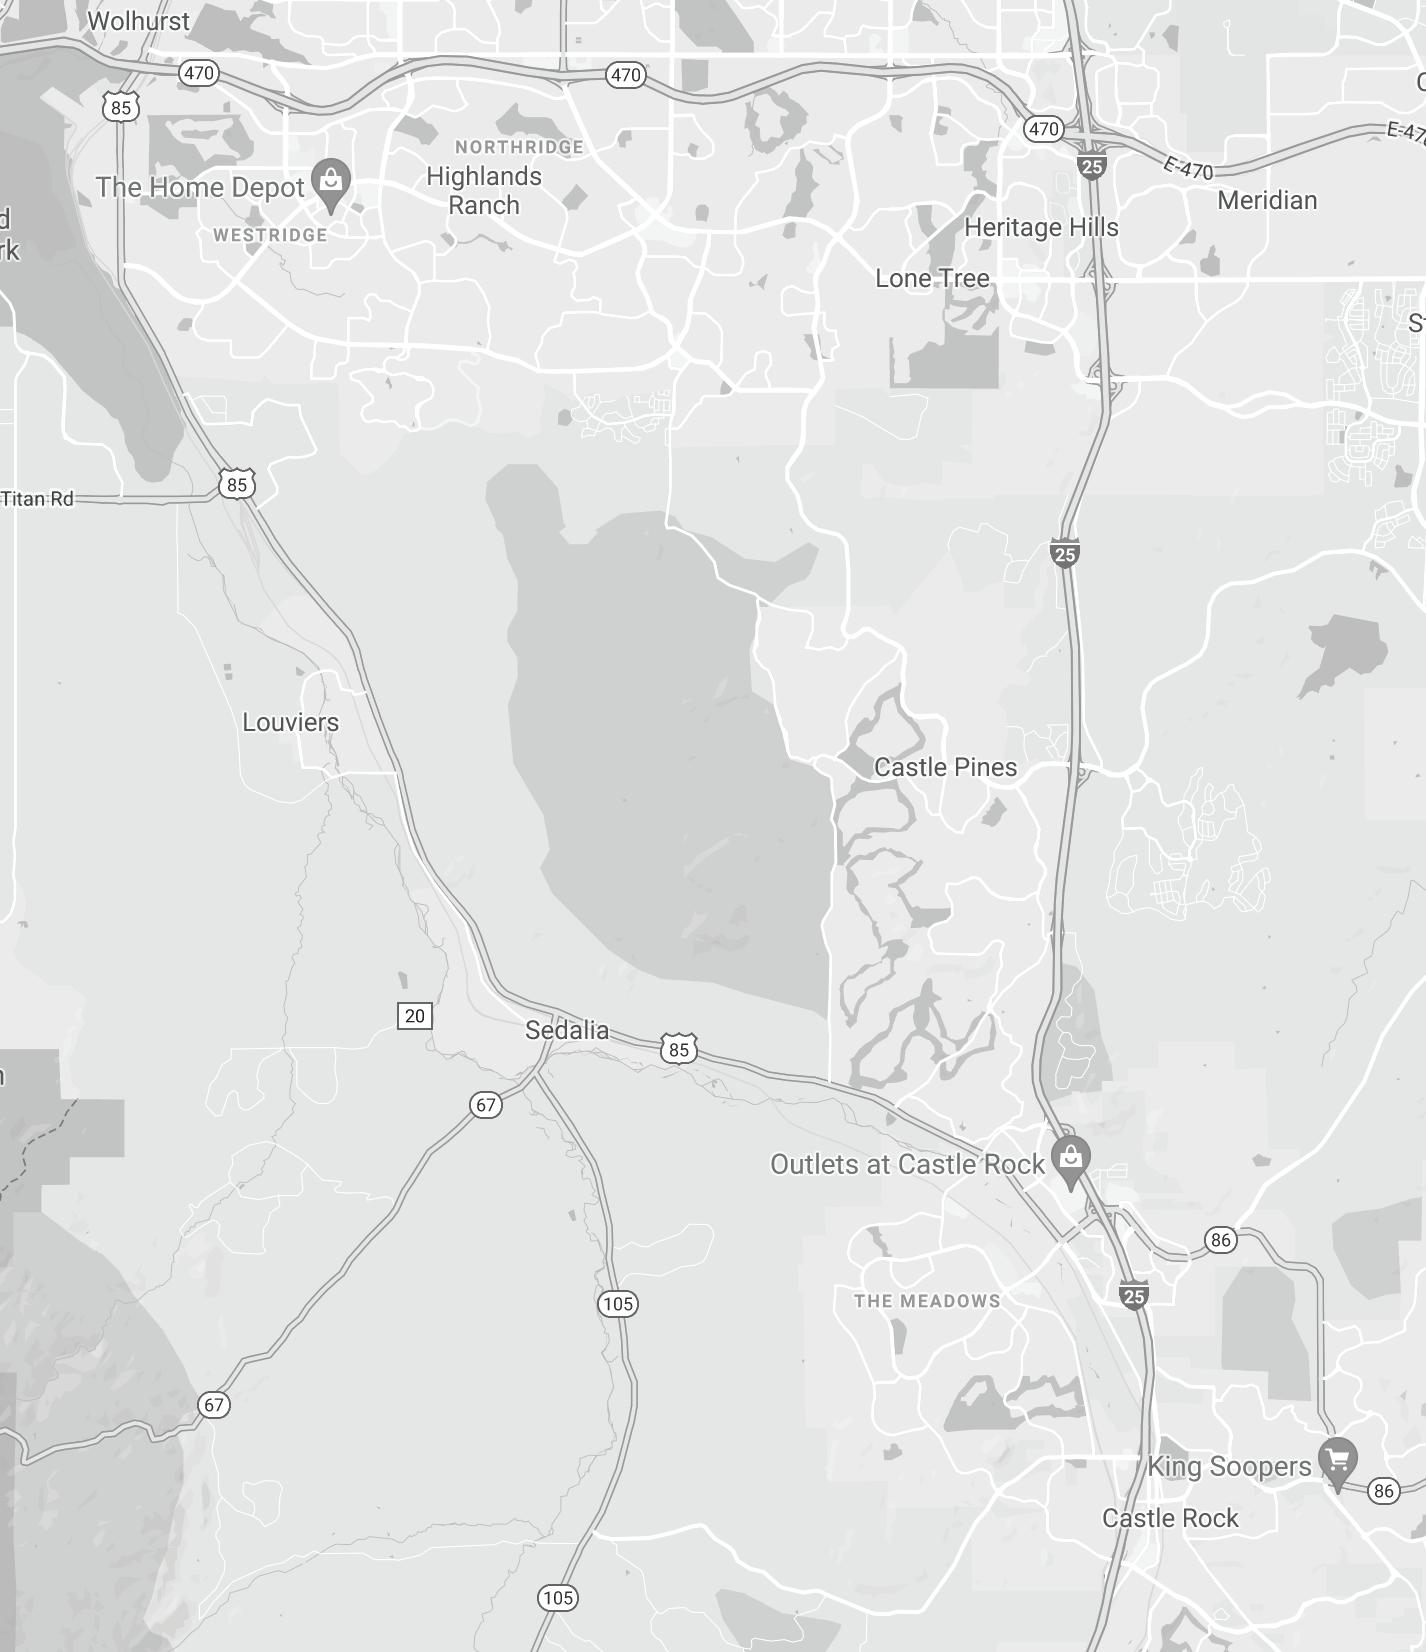
MICRO MARKET REPORT | South Metro JANUARY - DECEMBER 2022 • COLORADOMICROREPORTS.COM livsothebysrealty.com SOUTH METRO NEIGHBORHOODS 1. Backcountry 2. Bell Mountain Ranch 3. Castle Pines 4. Castle Rock 5. Chaparral/Chenango 6. Crystal Valley 7. Eastridge 8. Falcon Hills 9. Firelight 10. Forest Park 11. Highlands Ranch Golf Club 12. Heritage Estates 13. Heritage Hills 14. Highlands Ranch 15. Inspiration 16. Keene Ranch 17. Larkspur 18. Lone Tree 19. The Meadows 20. Pradera & Timbers 21. Ravenna 22. Ridgegate 23. Roxborough Park 24. Spirit Ridge 25. Sterling Ranch 26. The Village at Castle Pines 27. Westridge 15 8 7 13 2 5 11 14 16 9 10 3 6 4 1 25 20 19 18 17 21 24 23 26 27 12 22
BACKCOUNTRY
16.2%
The average home sale price in Backcountry increased by 16.2% in 2022 compared to that of 2021.
January through December 2021 2022 % Change
Average Price
$1,424,756 $1,654,855 16.2%
Average Price Per Square Foot $436 $505 15.7%
Average Days on Market 8 18 125.0%
Highest Price $2,725,000 $4,400,000 61.5%
Properties Sold 99 72 -27.3%
% Sold Price to List Price 100.1% 97.5% -2.6%
BELL MOUNTAIN RANCH
Bell Mountain Ranch is a working horse ranch in Castle Rock that has been around for over 100 years. This beautiful, high-end neighborhood, located 40 minutes southeast of Denver, features 305 custom home sites ranging from three to 12 acres.
January through December 2021 2022 % Change
Average Price
$1,312,075 $1,349,444 2.8%
Average Price Per Square Foot $463 $478 3.3%
Average Days on Market 39 34 -12.8%
Highest Price $1,910,000 $1,820,000 -4.7%
Properties Sold 20 9 -55.0%
% Sold Price to List Price 94.5% 95.8% 1.4%
CASTLE PINES
January through December 2021 2022 % Change
Average Price
$932,498 $1,063,432 14.0%
Average Price Per Square Foot $328 $381 16.1%
Average Days on Market 16 21 31.3%
Highest Price $2,988,889 $2,859,021 -4.3%
Properties Sold 313 296 -5.4%
% Sold Price to List Price 101.6% 100.1% -1.5%
Average
Average
55.2%
The average number of days on market in Chaparral/Chenango decreased by 55.2% in 2022 compared to that of 2021.
through December 2021 2022 % Change
Price
Price Per Square Foot
through December 2021 2022 % Change
January
Average
$580,214 $669,859 15.5% Average
$259 $300 15.9% Average Days on Market 13 23 76.9% Highest Price $1,410,000 $1,195,000 -15.2% Properties Sold 253 242 -4.3% % Sold Price to List Price 102.4% 99.6% -2.7% January
Price
Price Per
Foot
Days
Market
List Price
through December 2021 2022 % Change
$731,613 $818,659 11.9% Average
Square
$306 $345 12.7% Average
on
14 24 71.4% Highest Price $5,800,000 $6,340,000 9.3% Properties Sold 2,100 1,764 -16.0% % Sold Price to
102.4% 99.9% -2.4% January
Price
Price Per Square Foot
VALLEY
CASTLE ROCK
$1,405,369 $1,441,965 2.6% Average
$339 $402 18.3% Average Days on Market 29 13 -55.2% Highest Price $2,650,000 $2,600,000 -1.9% Properties Sold 26 16 -38.5% % Sold Price to List Price 99.0% 97.2% -1.9% CRYSTAL
CHAPARRAL/CHENANGO
FALCON HILLS
Falcon Hills is a prestigious, master-planned, gated neighborhood located in Highlands Ranch. In this private neighborhood, residents enjoy the peaceful, quiet atmosphere with views of the Rocky Mountains and the Denver Metro area.
January through December
Average Price
19.8%
The average home sale price in Firelight increased by 19.8% in 2022 compared to that of 2021.
2021 2022 % Change
$654,957 $709,701 8.4%
Average Price Per Square Foot $318 $378 19.0%
Average Days on Market 6 15 150.0%
Highest Price $1,170,000 $1,420,000 21.4%
Properties Sold 116 77 -33.6%
% Sold Price to List Price 104.8% 101.6% -3.1%
January through December 2021 2022 % Change
Average Price
$1,357,500 $1,662,143 22.4%
Average Price Per Square Foot $356 $441 23.9%
Average Days on Market 19 18 -5.3%
Highest Price $1,650,000 $2,605,000 57.9%
Properties Sold 6 7 16.7%
% Sold Price to List Price 102.6% 93.5% -8.9%
January through December 2021 2022 % Change
Average Price
$703,496 $842,639 19.8%
Average Price Per Square Foot $310 $337 8.7%
Average Days on Market 7 16 128.6%
Highest Price $1,235,000 $1,590,000 28.7%
Properties Sold 97 100 3.1%
% Sold Price to List Price 104.6% 101.1% -3.4%
EASTRIDGE
FIRELIGHT
January
Average Price $1,148,083 $1,414,500 23.2%
Average Price Per Square Foot $395 $500 26.7%
Average Days on Market 17 22 29.4%
Highest Price $1,475,000 $1,875,000 27.1% Properties Sold 6 5 -16.7%
% Sold Price to List Price 102.4% 99.7% -2.6%
Average Price $984,422 $1,262,333 28.2%
Average Days on Market 7 26 271.4%
Highest Price $1,600,000 $1,749,000 9.3% Properties Sold 18 15 -16.7%
% Sold Price to List Price 102.2% 101.2% -1.0%
28.2%
The average home sale price in Highlands Ranch Golf Club increased by 28.2% in 2022 compared to that of 2021.
Average Price $1,759,000 $2,305,689 31.1%
Average Price Per Square Foot $450 $520 15.6%
Average Days on Market 67 25 -62.7%
Highest Price $2,500,000 $3,094,824 23.8%
Properties Sold 11 7 -36.4%
% Sold Price to List Price 100.1% 96.0% -4.1%
Heritage Estates was built around the fairways of the Lone Tree Golf Course and is located near downtown Lone Tree and Bluffs Regional Park, a popular hiking and biking spot for residents.
January through December 2021 2022 % Change
through December 2021 2022 % Change
January through December 2021 2022 % Change
Average Price Per Square Foot $331 $372 12.2%
ESTATES HIGHLANDS RANCH GOLF CLUB FOREST PARK
HERITAGE
HERITAGE HILLS
Heritage Hills is a gated, luxury community in Lone Tree offering a combination of new builds and homes built in the last 20 years.
Residents have access to a variety of parks, pools, tennis courts, and playgrounds within the community.
January through December 2021 2022 % Change
Average Price
$1,485,302 $1,560,983 5.1%
Average Price Per Square Foot $407 $461 13.1%
Average Days on Market 32 16 -50.0%
Highest Price $2,925,000 $2,500,025 -14.5%
Properties Sold 56 36 -35.7%
% Sold Price to List Price 99.6% 98.2% -1.4%
HIGHLANDS RANCH INSPIRATION
20.8%
The number of homes sold in Inspiration increased by 20.8% in 2022 compared to that of 2021.
Average Price $741,733 $824,556 11.2%
Average Price Per Square Foot $332 $375 12.7%
Average Days on Market 6 16 166.7%
Highest Price $2,725,000 $4,400,000 61.5%
Properties Sold 1,589 1,255 -21.0%
% Sold Price to List Price 104.5% 100.8% -3.5%
January through December 2021 2022 % Change
Average Price
$744,639 $793,876 6.6%
Average Price Per Square Foot $304 $333 9.6%
Average Days on Market 25 27 8.0%
Highest Price $1,280,000 $1,230,000 -3.9%
Properties Sold 101 122 20.8%
% Sold Price to List Price 100.9% 99.0% -1.9%
January through December 2021 2022 % Change
January
Average
6.9%
The average home sale price in Keene Ranch increased by 6.9% in 2022 compared to that of 2021.
Lone Tree is a south Denver suburb, tucked just off I-25 in between Littleton and Parker. Conveniently located along the Light Rail at Lincoln Station, this Front Range town lies within Douglas County.
through
% Change
January
December 2021 2022
Average Price $1,162,194 $1,262,659 8.6% Average Price Per Square Foot $362 $413 14.3%
Average Days on Market 21 18 -14.3%
Highest Price $2,925,000 $3,094,824 5.8% Properties Sold 206 154 -25.2% % Sold Price to List Price 101.4% 99.1% -2.2%
through
December 2021 2022 % Change
Price $1,576,111 $1,684,401 6.9%
Average Price Per Square Foot $466 $464 -0.4%
Average Days on Market 15 28 86.7%
through
% Change
Highest Price $3,270,000 $2,892,000 -11.6% Properties Sold 18 19 5.6% % Sold Price to List Price 99.2% 95.4% -3.7% January
December 2021 2022
Average Price $926,792 $1,203,960 29.9% Average Price Per Square Foot $352 $424 20.6% Average Days on Market 11 34 209.1%
Highest Price $4,350,000 $4,495,000 3.3% Properties Sold 79 83 5.1%
% Sold Price to List Price 102.8% 96.7% -6.0%
LONE TREE
LARKSPUR
KEENE RANCH
THE MEADOWS PRADERA & TIMBERS
26.1%
The average price per square foot in Pradera & Timbers increased by 26.1% in 2022 compared to that of 2021.
January through December 2021 2022 % Change
Average Price
$611,972 $690,045 12.8%
Average Price Per Square Foot $279 $326 16.5%
Average Days on Market 8 16 100.0%
Highest Price $1,190,000 $1,450,000 21.8%
Properties Sold 484 347 -28.3%
% Sold Price to List Price 103.1% 100.8% -2.2%
RAVENNA
Ravenna is a charming custom home village in Littleton set among rolling hills and red rock outcroppings on a worldclass golf course in Waterton Canyon.
Average Price $1,167,715 $1,403,205 20.2%
Average Price Per Square Foot $337 $425 26.1%
Average Days on Market 21 24 14.3%
Highest Price $2,275,000 $5,050,000 122.0%
Properties Sold 116 108 -6.9%
% Sold Price to List Price 101.1% 99.0% -2.1%
January through December 2021 2022 % Change
Average Price
$2,613,835 $2,705,554 3.5%
Average Price Per Square Foot $749 $942 25.8%
Average Days on Market 112 69 -38.4%
Highest Price $4,100,000 $4,250,000 3.7%
Properties Sold 17 18 5.9%
% Sold Price to List Price 96.7% 99.6% 3.0%
January through December 2021 2022 % Change
Average Price $854,561 $892,766 4.5%
Average Price Per Square Foot $333 $369 10.8%
Average Days on Market 11 16 45.5%
Highest Price $1,578,500 $1,491,900 -5.5%
Properties Sold 41 28 -31.7%
-1.7%
10.8%
The average price per square foot in Ridgegate increased by 10.8% in 2022 compared to that of 2021.
Average Price $939,951 $996,109 6.0%
Average
Average Days on Market 32 16 -50.0%
Highest Price $2,012,896 $2,600,000 29.2%
Properties Sold 60 41 -31.7%
% Sold Price to List Price 99.7% 98.6% -1.0%
The small town of Roxborough Park lies between Chatfield State Park and Roxbourough State Park. Situated at the base of the foothills, Roxborough Park provides views of natural rock formations as well as the Rocky Mountains.
Average Price $1,606,667 $1,470,000 -8.5%
Average Price Per Square Foot $388 $352 -9.3%
Average Days on Market 179 9 -95.0%
Highest Price $2,265,000 $1,500,000 -33.8%
Properties Sold 6 3 -50.0%
% Sold Price to List Price 95.6% 98.4% 2.9%
January through December 2021 2022 % Change
January through December 2021 2022 % Change
% Sold Price to List Price 101.6% 99.9%
January through December 2021 2022 % Change
Price Per Square Foot $384 $469 22.2%
SPIRIT
RIDGE ROXBOROUGH PARK RIDGEGATE
STERLING
Sterling Ranch is a masterplanned community located just four miles south of C-470 and one mile west of Santa Fe in Littleton. Sterling Ranch offers new homes with state-of-the-art technologies and sustainable resources.
January
Average Price
$736,578 $804,403 9.2%
Average Price Per Square Foot $292 $335 14.7%
Average Days on Market 19 23 21.1%
Highest Price $1,495,000 $1,375,000 -8.0%
Properties Sold 98 112 14.3%
% Sold Price to List Price 100.6% 97.6% -3.0%
12.0%
The average price per square foot in Westridge increased by 12.0% in 2022 compared to that of 2021.
Average Price $1,708,723 $1,955,200 14.4%
Average Price Per Square Foot $496 $582 17.3%
Average Days on Market 42 31 -26.2%
Highest Price $4,295,000 $6,340,000 47.6% Properties Sold 117 100 -14.5%
% Sold Price to List Price 99.8% 98.9% -1.0%
January through December 2021 2022 % Change
Average Price
$633,424 $699,879 10.5%
Average Price Per Square Foot $329 $368 12.0%
Average Days on Market 5 18 260.0%
Highest Price $1,226,000 $1,109,200 -9.5%
Properties Sold 156 108 -30.8%
% Sold Price to List Price 105.8% 100.8% -4.7%
RANCH THE VILLAGE AT CASTLE PINES WESTRIDGE
through December 2021 2022 % Change
January through December 2021 2022 % Change
The definition of paradise depends on your point of view. Find a home that makes each day more extraordinary than the last with LIV Sotheby’s International Realty. 303.893.3200 | livsothebysrealty.com
in the moment
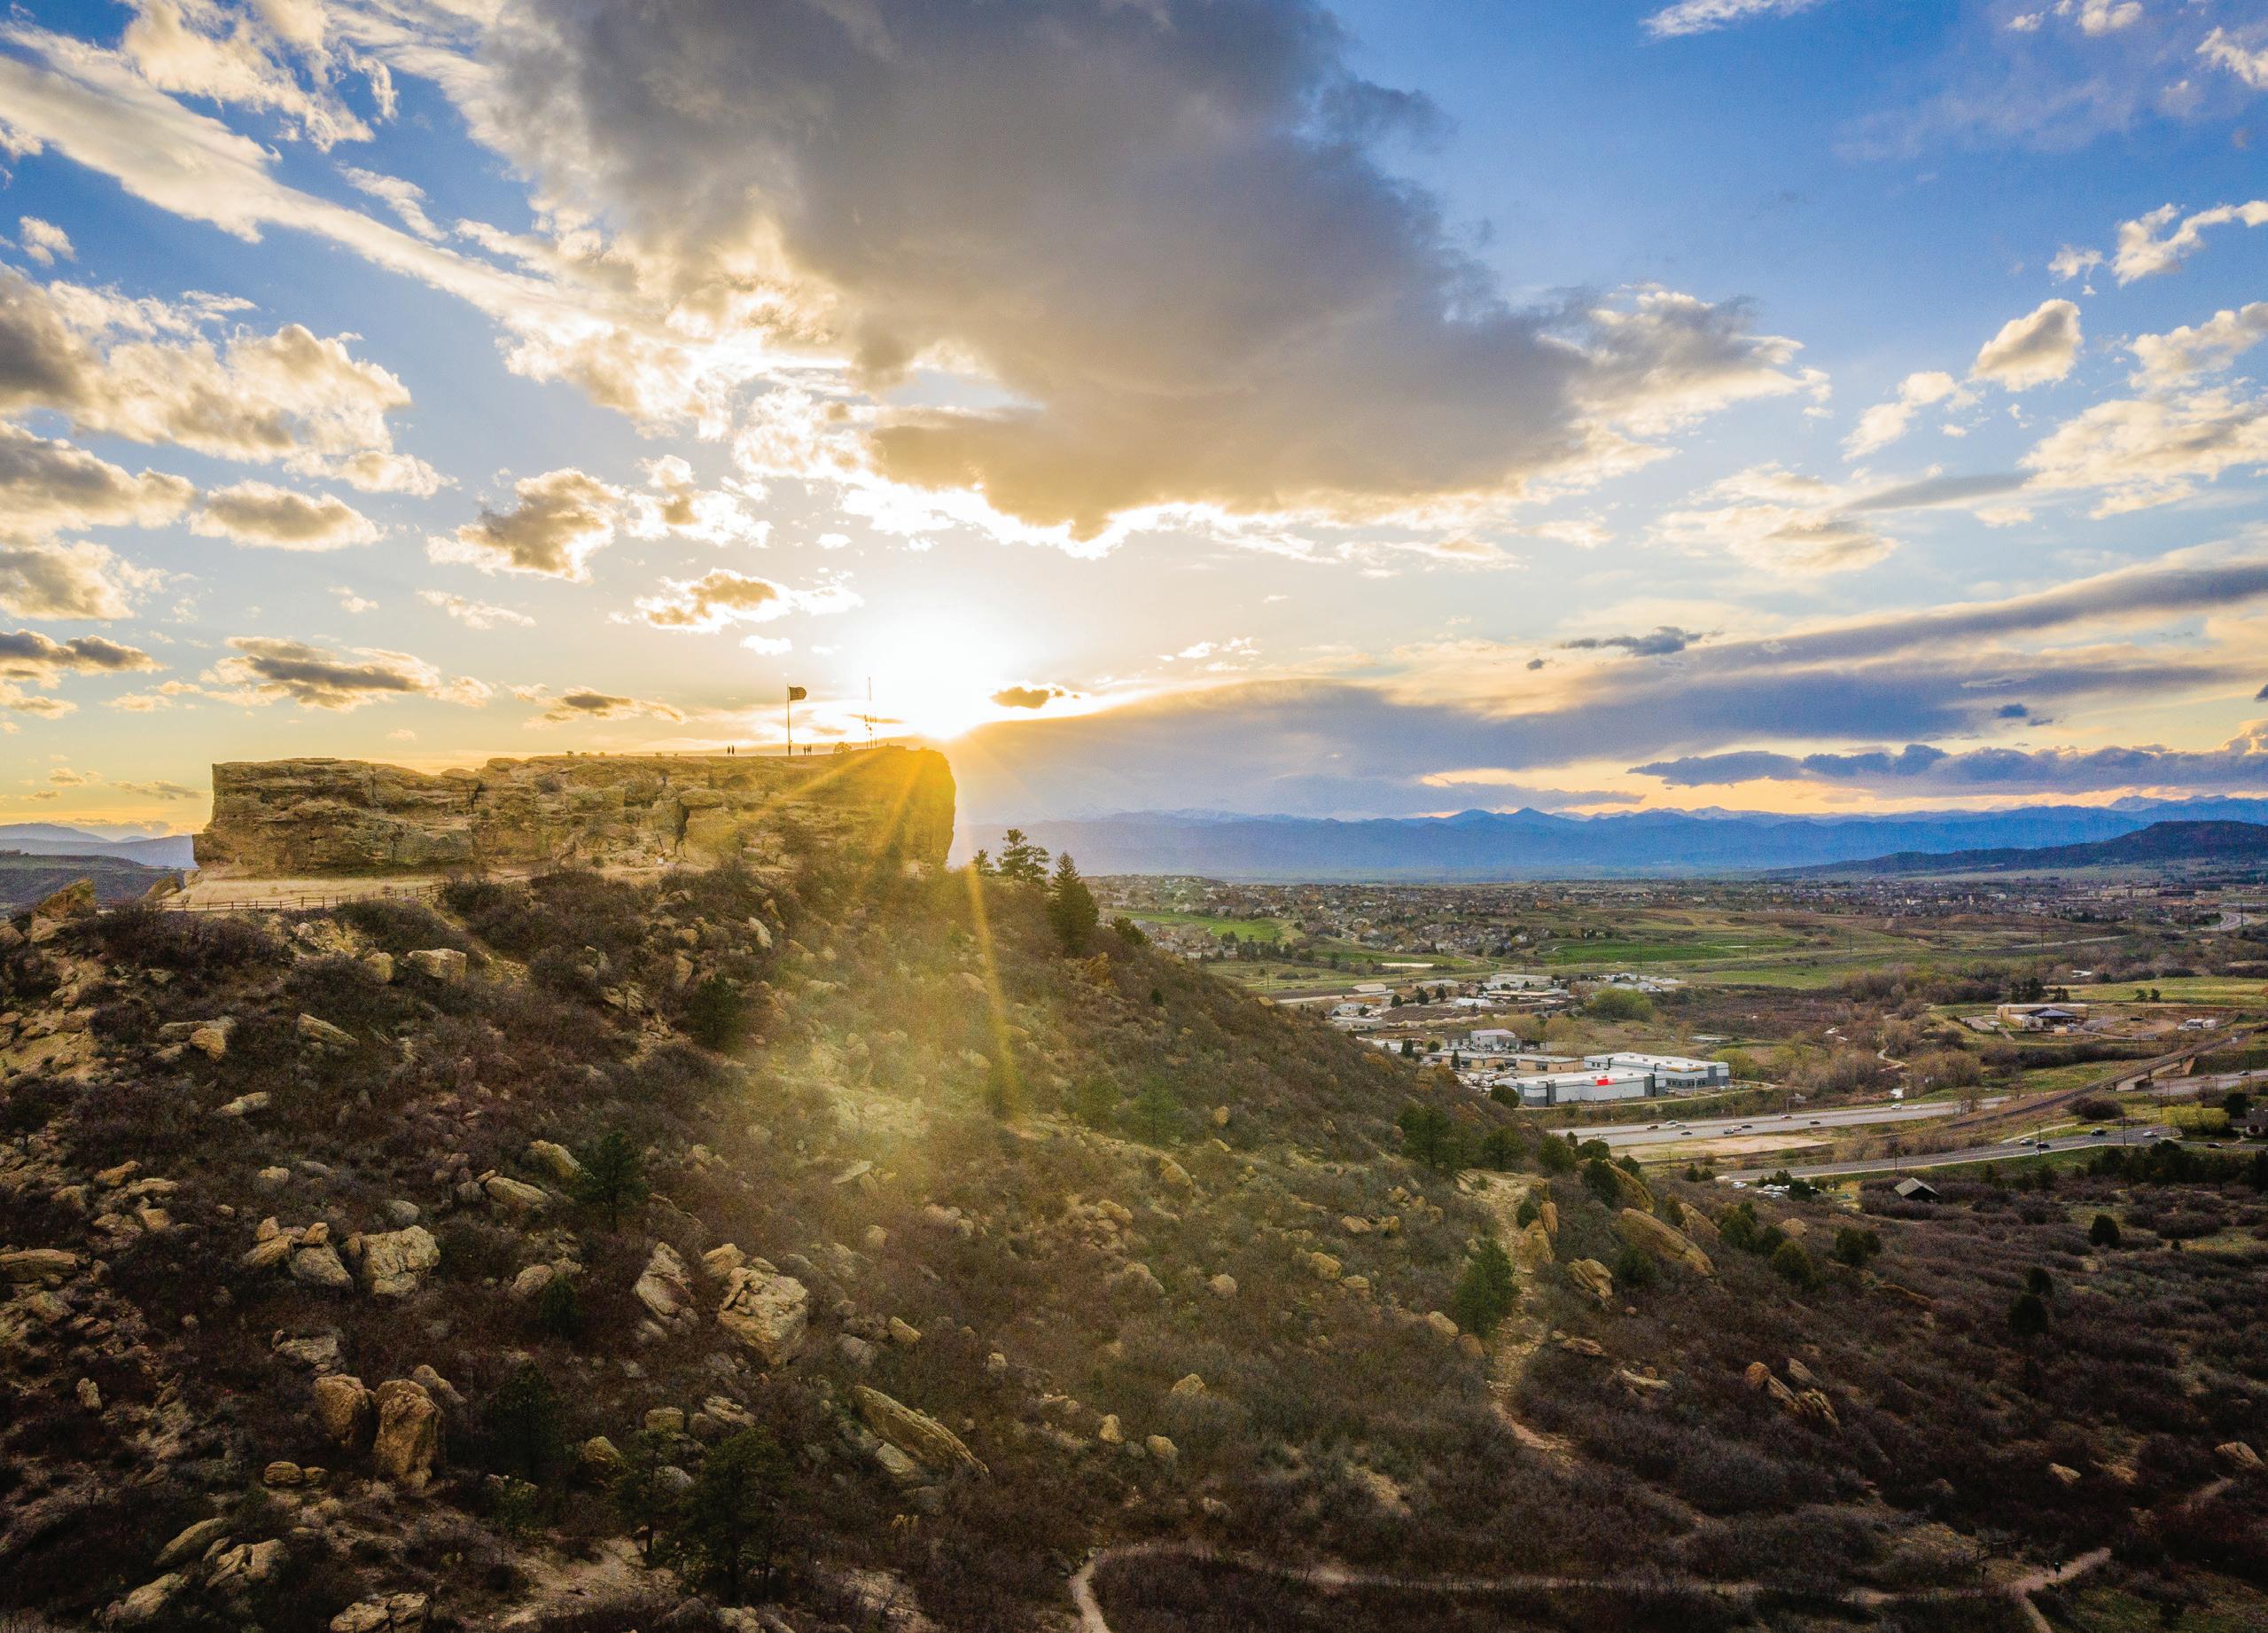
WHY COLORADO?
04 07 28 NATIONAL PARKS MOUNTAIN RANGES SKI AREAS & RESORTS
AVG DAYS OF SUNSHINE ANNUALY CRAFT BREWERIES 300 350+
MICRO MARKET REPORT | South Metro JANUARY - DECEMBER 2022 • COLORADOMICROREPORTS.COM