LFMP3 Learning From Matt Pearson

book Generative Art A practical guide using Processing
Based on Matt Pearson’s
2023 Henk Lamers
Random lines generated with Processing. Using the HYPE Library (HSwarm)
Henk Lamers | 2018
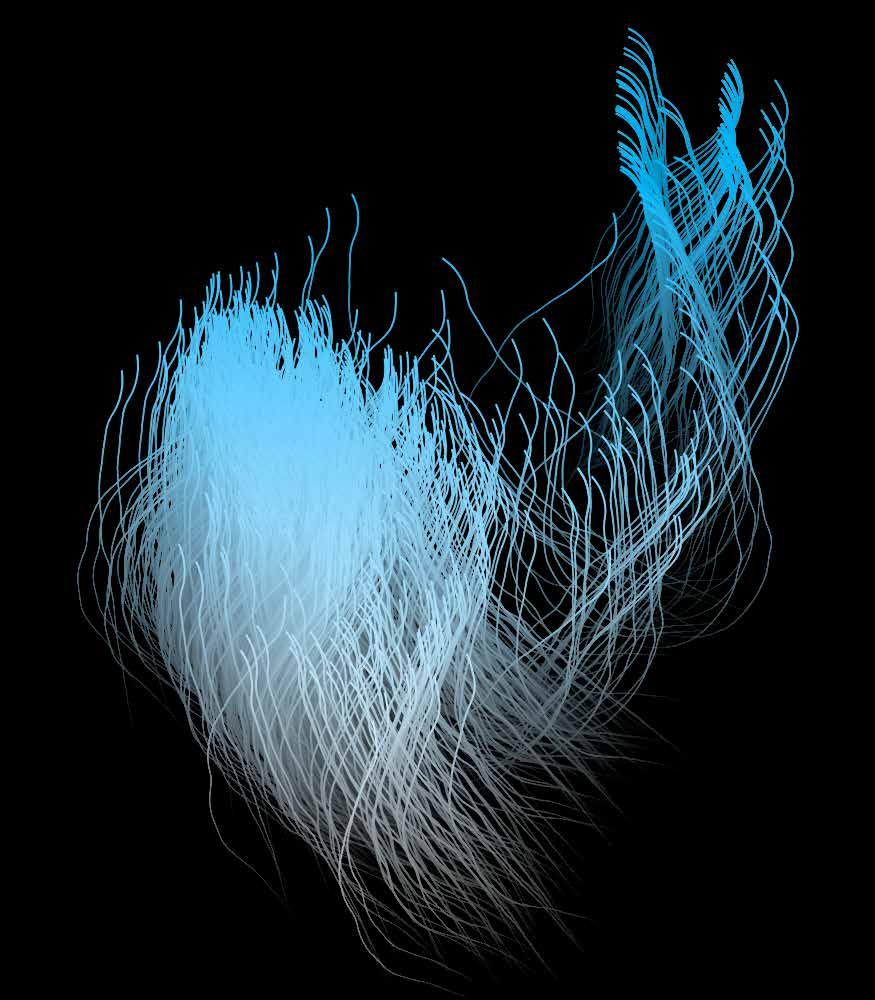
The 'right' way to draw a line, according to a machine, is always the most efficient and accurate way to get from point A to point B. But from an artistic point of view, the ‘wrong’ way is often the most interesting.
Matt Pearson, page X
That accuracy and randomness may not lead to the most aesthetically pleasing images becomes clear as you read through this publication. But in this story, the image is an afterthought. The aim is to find out how to deal with accuracy and randomness.
What is accuracy? In science, engineering, industry and statistics, precision or accuracy is the degree of agreement between a measured or calculated value and the true value. The greater the accuracy, the smaller the error. Accuracy consists of correctness and precision. But aren‘t these two the same concepts? What the difference is between accuracy and precision becomes clear in the following example.
Suppose you shoot four arrows at a target. These four arrows all grandiosely miss the centre. How far from the centre is measured. Then the measurement may be precise and correct. But then the accuracy at which the arrows were shot is poor. But I think we digress here because accuracy is of only limited value in the context of generative art.
Randomness is the synonym of chance. You chose something randomly. Not according to certain rules. In fact, randomness is the opposite of accuracy. It also corresponds to unpredictability. And that brings us to the random function of Processing. Accuracy and randomness are the two topics in this publication.
Henk Lamers
Four arrows 3


4
Several line shapes generated by Matt Pearson’s original program.
This program demonstrates the randomisation of a straight line via Perlin noise. You could divide a line into shorter lines. The line segments allow you to vary their direction and length in random places. But in this case, the call to random is replaced with a Perlin noise sequence.
void setup (); This program only uses the setup block. We don't need animation so the draw () block can be omitted.
int step = 10;
The number of steps determines how much noise is added to the line. A higher number (more noise) gives a tighter line. A lower number (less noise) gives a more jagged line.
float lastx = -999; float lasty = -999; Initialisation of lastx and lasty happens outside the display window.
float ynoise = random (10); Initialisatie van ynoise. Generates random numbers. Each time the random() function is called. For example, random (5) returns values between 0 and 5 (starting at zero, and up to, but not including, 5).
for (int x = 20; x <= 480; x += step) { The line starts at 20 pixels from the left. If x is less than or equal to 480 then x is incremented by step. In this case it is 10 pixels.
y = 10 + noise (ynoise) * 80; y = 10 + noise (ynoise is a number between 0 and 9) multiplied * 80. Suppose ynoise is 4. 4 * 80 = 320.
if (lastx > -999) {
If lastx is greater than -999 then the following rule takes effect.
line (x, y, lastx, lasty); Strange lastx is -999, right? So then nothing happens in the first step through the loop. No line segment is drawn. So in the next pass through, it does.
lastx = x; lasty = y;
So here, lastx becomes 20 and lasty also becomes 20? But I’m not quite sure about that.
ynoise += 0.1; Here, 0.1 is added to ynoise. And then the program enters the following run through the for loop.
Analysis Perlin noise. LFMP_03_01_00 5
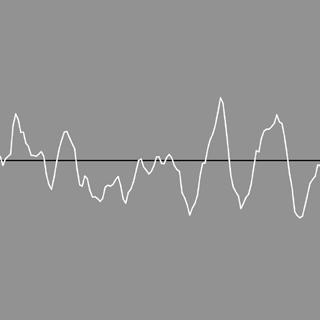
A straight line



6
LFMP_03_01_01
Noise in the middle
So we get to work with Perlin noise. I am not going to say anything about Ken Perlin because Matt Pearson has already done that extensively. We are going to concentrate on the program. I have made a small number of changes to it.
size (1000, 1000); I will always work with a size of 1000 x 1000 pixels during these publications. That seems clearer to me. And it‘s no more expensive than a smaller size. It‘s just pixels.
background (128); The background is grey.
strokeWeight (4); The line width is 4 pixels.
stroke (0); The first line drawn is black.
line (0, height / 2, width, height / 2); I would like the black line to be horizontal in the middle. This line is a kind of reference relative to the line generated with Perlin noise.
int step = 1; This means plotting every other pixel. So very much a difference. If you replace 1 with 100, fewer points become available. The number of steps determines how many points the line consists of. A higher number gives a tighter line. A lower number gives a more jagged line (as I mentioned earlier).
float ynoise = random (1000); Apparently, it doesn‘t matter which number you use to initialise ynoise.
for (int x = 20; x <= 480; x += step) {
Changed it to:
for (int x = 0; x <= width; x += step) { I want a full-width white noise line. But there‘s another problem. How do you get the noise line in the middle?
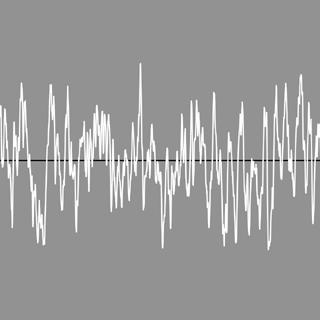
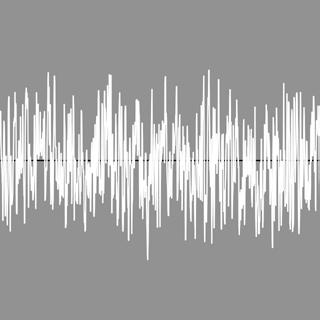
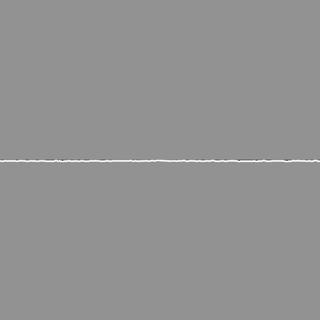
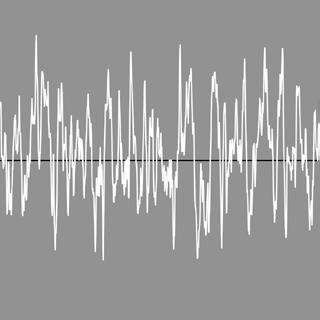
y = 100 + noise (ynoise) * 800; With this setup, I made several variations where the step size was doubled each time.
Variations Perlin noise
7



8
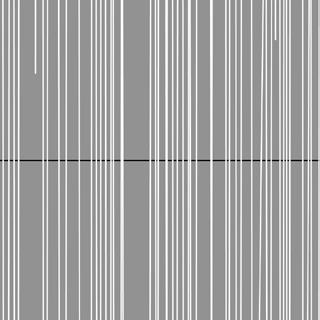
A number of variations where ynoise is always increased. This manifests itself, oddly enough, mainly in the horizontal density of the vertical lines.
Variations Perlin noise
+= 0.1
LFMP_03_01_02 Horizontal density ynoise
9




10
LFMP_03_01_03
Dominating noise
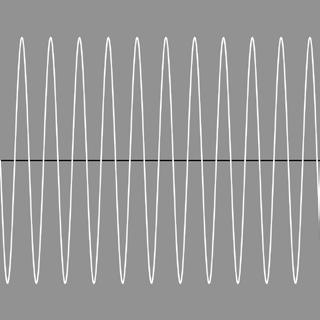
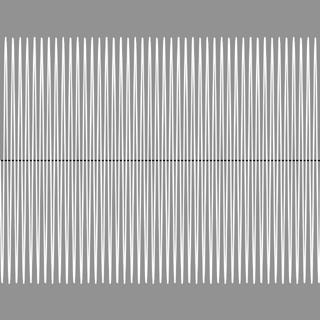
y = 50 + noise (ynoise) * 1; A number of variations where ynoise is always doubled. Starting with: 1, 2, 4, 8 to 1024. The noise actually only shows itself at 2. At 1024, the noise clearly dominates the image.
Perlin noise
Variations
11



12
Variations
Drawing a sine curve
Radians and degrees
LFMP_03_02_01
In fact, this setup is not that much different from the previous programs. Random has been replaced by the radians function. Randians convert a degree measurement to its corresponding value in radians. Radians and degrees are two ways of measuring the same thing.
float rad = radians (angle); The variable rad contains the number of radians.
y = 500 + (sin (rad) * 256); Makes the sine curve start vertically at 500 pixels. 256 Makes the top and bottom of the amplitude better distributed over the display window. At 2, you get a very low amplitude. At 256, a high amplitude.
angle++;
Is replaced with:
angle += 32; Increasing the variable angle gives you control over the frequency of the sine wave. Some examples with different frequencies.
13


14
LFMP_03_02_02
In these variations of the program, noise has been added gradually to the sine wave. Otherwise, everything else in the program remains the same.
y = 500 + (pow (sin (rad), 3) * noise (rad * 2) * 384); 500 Still makes the sine wave start at 500 pixels in height.
The pow() function is an efficient way of multiplying numbers by themselves (or their reciprocals) in large quantities.
The sin() function calculates the sine of an angle.
The rad variable contains the radians.
The 3 is rather puzzling. If you replace it with 0, the wave motion shifts below the black centre line. And the amplitude also halves.
At 1, the wave motion is back in the centre.
At 2, the wave motion moves against the bottom of the black line.
At 3, it is perfectly in the middle again.
4 Delivers the same result as 2. 5 Is the same as 1 and 3. 6 Is the same as 2 and 4.
The noise () function is the same from previous programmes.
rad * 2 Doubles the radians. And it is then multiplied again by 384 which again increases the amplitude.
angle++;
Is still:
angle += 32;
If you make this 1 then you get few wave movements. At 32, the wave motions are closer together. Again, I made some variations with different frequencies.
Analysis Drawing a sine curve
Add noise 15

16
LFMP_03_02_03
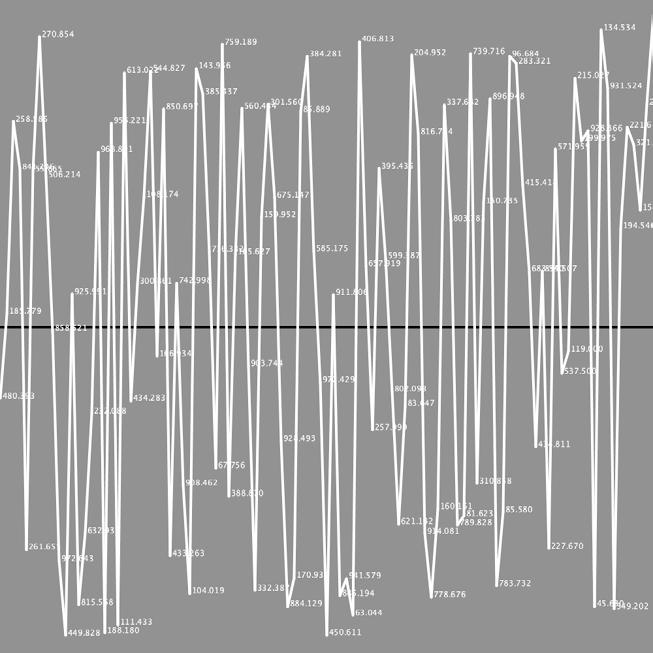
In this program, we look at the influence of randomness in the y position. Two variables are introduced: borderx and bordery.
int borderx = 20
Changed that to 0 because I think the white line should start and end at the beginning of the left and right sides.
int bordery = 10;
The lower this number is the higher the amplitude. But even if I change this number from 10 to 100, I don‘t notice any obvious change. That change only starts at 5000. Then you get almost vertical lines.
Variations Drawing a sine curve
17
Randomness in the y position
18
Variations
Drawing a sine curve
LFMP_03_02_04
println (y);
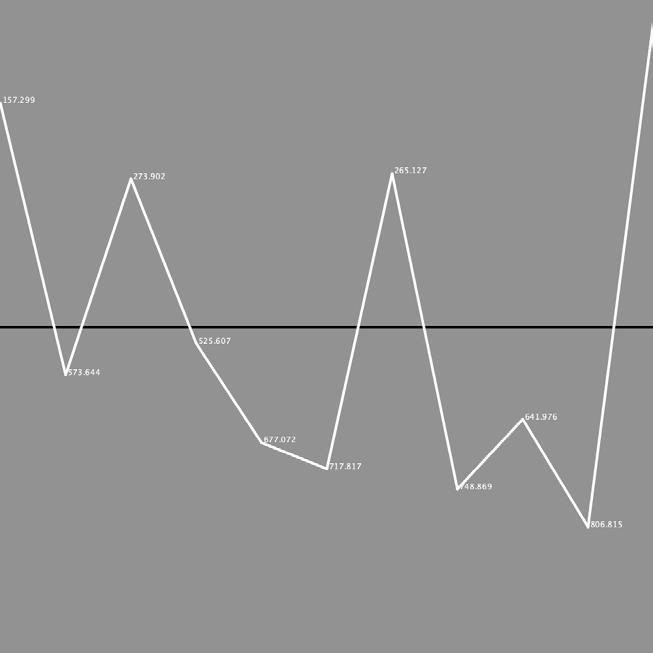
When I write a println (y); in the if loop I get numbers like 532.73956, 346.34482, 190.60365, 143.65884, 115.314064, 322.83063.
text(y, lastx, lasty);
This line depicts the numbers where they generate a point. I want to know what these numbers represent. Is it the case that 532.73956 is a point 532 pixels from the top? If so, only the first digits before the point matter. But when I check that in Photoshop, the numbers don‘t match the locations I thought they would be. The numbers seem randomly scattered.
19
Randomly scattered
20
Drawing a sine curve
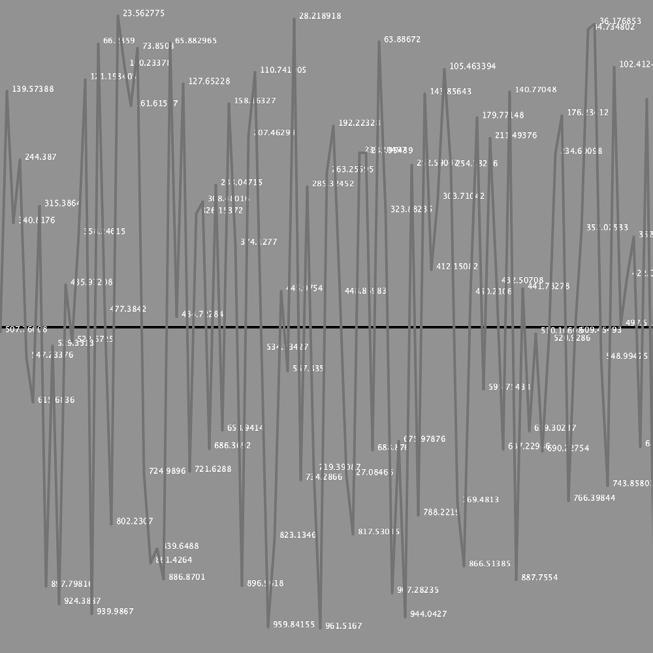
LFMP_03_02_05 xstep = 100;
I made a little more space in the width to make the numbers easier to read.
text(y, lastx, lasty);
I have to admit I made a mistake. I had put the above line in the if loop. That gives wrong random numbers and wrong positions. I have now moved the rule to the for loop. And that gives a better picture. Checked a screendump again in Photoshop. And now it‘s exactly right.
Variations
A
21
mistake
Drawing a sine curve
LFMP_03_02_06 xstep = 10; Reset xstep to the original setting.
text (" " + y, lastx, lasty); Gave two word spaces more space so the numbers don‘t stick to the lines. Greyed out the lines themselves. Not that it helps much for readability. Actually, the texts should be placed last. So if you wanted to do it perfectly, you should draw the lines first. And secondly the numbers. And use ints instead of floats.
Variations
23
Perfection isn’t required

24
Variations
A custom random function
The structure of a program
LFMP_03_03_01
The novelty of this program is not so much the output but the structure of the program itself.
float customRandom () { We are now using a custom random function. Does this have any advantages?
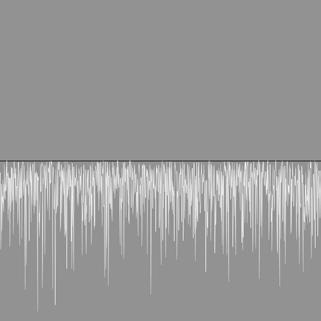
y = 500 + (customRandom () * 10); This gives a minimum amplitude. So I changed 10 to 100, which was still too little. So changed again to 1000. And that gives a reasonable plane distribution.
25

26
LFMP_03_03_02
I am curious to know what this looks like when the lines are not built downwards (from the black line onwards).
lastx = y; lasty = x; This gives an unexpected image. Not something I was looking for but maybe this will lead to better results.
line (y, x, lastx, lasty); I just replaced x and y to y and x. That results in randomly generated lines.
float returnValue = 1 + pow (random (1), 100); Or as in the spirit of Matt Pearson: multiply it by 100. And this is also the last variation of this chapter.
Variations A custom random function
Randomly generated lines 27


