
18 minute read
EVIDENCE-BASED LP


Footprints and Flea Markets
by Read Hayes, PhD, CPP
Dr. Hayes is director of the Loss Prevention Research Council and coordinator of the Loss Prevention Research Team at the University of Florida. He can be reached at 321-303-6193 or via email at rhayes@lpresearch.org. © 2017 Loss Prevention Research Council
Every living person generates signals, signatures, and noise, if you will. As we move through time and space, we shed DNA, talk on phones, travel, register for, apply for, and purchase things—all the while texting, emailing, tweeting, posting, and so on.
Human Footprints
This biological and digital exhaust and our literal and digital footprints are with us now and in the future. And so it goes with our retail customers and criminal offenders. This phenomenon is a huge opportunity for us to leverage these bio-digital signatures to attract and keep more good shoppers, as well as to deter, disrupt, and detain those attempting to defraud, attack, and steal from our organizations and people.
To further build cost-effective, protective packages (integrated tactics and technologies), executives from over forty-five Loss Prevention Research Council (LPRC) member retail chains and sixty-five technology partners are working in focused innovation chains (ICs). Current ICs include anti-robbery, anti-burglary, anti-theft, our Security Operations Center (or SOCLab), and signatures.
LPRC Innovation Chains
An LPRC innovation chain often starts with initial research and development at the LPRC and University of Florida (UF) innovation lab. Subsequent trials can be conducted in actual physical test stores and distribution centers provided by member retailers to fine-tune the program based on shopper, employee, and offender feedback. Finally, adjusted anti-crime and loss processes are frequently rigorously evaluated in randomized, controlled trials across larger samples of locations to estimate their efficacy and cost-effectiveness.
The chart below is the current iteration of the LPRC UF Anti-Robbery Innovation Chain.
Zones of Influence
As many readers may have heard by now, the LPRC and UF teams are working hard to help our retail, manufacturing,
Anti-Robbery Innovation Chain
iLab > Gainsville > Baltimore
Smart safe Cash drop Signage SelectaDNA apply to assett Duress words detection Anti-counter jump solutions Multi-view ePVM Signage Inside exit barrier (Blue Line) Facialrecognition Entry ePVMoptions Signage SelectaDNA exit mist LiveView video platform trailer Security guard/vehicle options Entry/exit barrieroptions Outside camera with bllinkingLED lights Outside exit face cameras License platereader Mac address sensor Mosquito MOOD parkinglot music system Interface GPS trackers with photo imaging Captis intel Cap index Map large Slack channel
Zone 1 Zone 2 Zone 3 Zone 4
(Parking Lot Control Innovation Chain)
Zone 5
Retailer 1 ✓ ✓ ✓
Retailer 2 ✓ ✓ ✓ ✓ ✓ ✓ ✓ ✓ ✓ ✓ ✓ ✓ ✓ ✓
Retailer 3
Retailer 4
Retailer 5
Retailer 6
Retailer 7
Retailer 8
Retailer 9 ✓ ✓ ✓ ✓ ✓ ✓ ✓
and solution partners obtain and provide accurate and actionable information and solutions from and to all five “zones of influence.”
Below is a generalized zones of influence graphic:
The LPRC team works closely with the University of Florida’s Center for Retailing Education and Research to craft holistic initiatives that simultaneously boost sales, lower costs, and reduce crime and losses. In his September 4, 2017, post on his extensively read retail blog at tonydonofrio.com, noted Tyco/Johnson Controls executive Tony D’Onofrio made the following observation on how a precision LP/AP framework using effort-risk-reward, see-get-fear concepts deployed in the five zones of influence can help improve all retailing facets:
“Brand differentiation and immersive customer experience are the two critical elements that will drive the future of retail. Physical and digital variations of these critical elements need to converge into a seamless unified commerce or [omni-channel] ecosystem.
“There is a compelling correlation between [UF and LPRC’s] research and the future of retail. Digital empowerment of today’s consumers leads to multiple ‘zones of influence’ towards the actual purchase. Focusing only on the product on the shelf [or even just the in-store experience] is not a recipe for retail success.
“The value is derived by the intertwined connections between the zones of influence. Think of the power today of new voices such as social media / online reviews (Zone 5) and their impact on legacy retail models.
“Discerning the ‘zones of influence’ leads to deeper consumer engagements. Innovation chains can be leveraged to shape a positive, engaging shopper experience.”
ZONE 5
Cyber / Public
ZONE 4
Parking Lot
ZONE 3
Interior
ZONE 2
Category Area
ZONE 1
Point / Asset

SOCLab and Tabletop Exercises
The LPRC SOCLab team and advisors conducted the initial shakedown, tabletop exercise on September 8, 2017. It concluded successfully and brought lessons learned on how to improve the lab and conduct progressively more challenging and realistic exercises, as well as needed situational awareness and decision-support apps.
Kevin Coleman, senior VP of asset protection at Macy’s, and CCI/Protection 1’s Garret King subsequently presented an active-attack scenario with lessons learned, along with SOCLab upcoming tactics and technology improvements at the LPRC Impact Conference upcoming in October. We strongly encourage your organization to assign someone to the SOCLab steering team to work with us as we strive


RIGHT ON THE MONEY.
Secures your cash. And your future.
Ascent Validating, Note Deposit, Coin and Note Dispensing safe components let you build the ultimate expandable system to secure, track, and account for your cash – dramatically reducing loss, while ensuring employees handle cash less and customers more. See how Ascent can take you to the top now, and even farther as you grow in the future. Call 800-452-4655 x. 3001 today, or visit www.fireking.com.
Call (800) 342-3033 ext. 3001 today, or email info@fireking.com.
to enhance “Detect-Define-Decide” capabilities for storms, disturbances, and active crimes in progress.
UF Now and Next Update
The UF online “Evidence-Based LP Online Certificate” course is completed and ready for enrollment. The course is designed for entry-level to experienced LP/security practitioners, technology designers, and interested parties to participate online in a very informative and challenging University of Florida course. More information is available by searching “evidence-based loss prevention” on the university website at ufl.edu.
Further, UF is placing student interns into retail and technology companies this spring and summer. For more information, please contact operations@lpresearch.org or ufcrer@warrington.ufl.edu.
Retailers should continue experimenting with innovative ways to devalue stolen goods (benefit denial), as well as investigative enhancements like synthetic DNA marking.
Featured LPRC Study
Each edition of LP Magazine, our team will feature a past LPRC or UF study that typically includes the topic, research method, research findings, and implications. This study looked at some flea market (noted theft demand centers) dynamics.
There are over 5,000 flea market type operations in North America, of which at least 1,000 are considered semipermanent. These markets are also referred to as swap meets, trash and treasure, boot sales, and outdoor markets. Many studies across the globe have demonstrated some booth operators in some flea markets do deal in stolen property. However, most booth operators and even most markets do not have stolen items available. Of special note, flea markets can be good selling channels for stolen property, but there are often easier ways to convert stolen product to cash online via small stores, other small business and street fences, drug dealers, friends and coworkers, and by exploiting liberal or poorly executed store refund policies and practices.
Almost 100 flea markets were randomly selected from a guide of 1,000 locations and visited by our teams to assess the availability, pricing, and condition of a high-loss men’s shaving product as example of flea markets and stolen products activity. Approximately one third of the markets had the shaving items for sale, with a handful offering the item for sale with EAS or store stickers on them.
A second phase of the research involved our teams offering premium blade replacement packs for sale to twenty-eight booth operators in several markets in Florida that had Gillette blades on display. The product was offered for sale in pristine condition, in torn packaging, with store logo-stickered packages, and out of the packaging to determine the effects of these conditions on the price offered by operators. Twenty-one of twenty-eight booth operators who were offered the shaving product (which was described as stolen) also purchased the items.
There was no real difference in “wholesale” pricing with all the items other than a slightly lower price offered for the completely out-of-package items or competing or store brand. One booth operator placed the packs with retailer-specific stickers in front of other non-stickered items claiming the retailer logo marketed that it was “legit.”
The following are action steps to consider: ■ Certain flea markets appear to present a compelling threat to some stores. It is difficult to determine a robust method for determining whether a local market is a threat without periodic surveillance by store staff, by law enforcement partners, and by debriefing detained shoplifters. ■ Product marking with secured retailer-specific logos did not appear to deter flea market operators from buying the goods, nor did they diminish the price in this relatively small pilot test. Evidence from this study supports the hypothesis that marking may not always deter boosters or fences, but does significantly aid in recovery and mapping organized retail crime (ORC) networks and stolen goods’ flow.
Please let me know any questions you might have on this very abbreviated study summary.
Recommended Reading
Shopping and Crime by Professor Joshua N. Bamfield, published in 2012 by Palgrave MacMillan (Basingstoke, Hampshire, UK). This book is a comprehensive look at retail crime and loss, relevant research, and many suggested solutions by a noted UK business and asset protection professor.
CONVERSION RATE OPTIMIZATION

TURNING STORE TRAFFIC INSIGHTS INTO BETTER BUSINESS RESULTS
By Mark Ryski


Loss prevention professionals and the LP industry in general have and continue to do an admirable job of bringing new analytic capabilities to their organizations. As I described in my article “Using Loss Prevention Technology to Support Traffic Counting and Conversion” published in January-February 2013, I have long believed that leveraging LP infrastructure for store traffic counting can be both capital efficient and operationally practical.
However, as I am certain many LP professionals who have implemented a store traffic counting solution have discovered, just because you have a system to collect traffic data doesn’t mean it gets used or the insights applied in a way that leads to a measurable improvement in business results. While I’m not suggesting that LP should be responsible for delivering results—clearly this is the domain of store operations—I do believe that LP can play an important role in bringing new ideas to leaders of the teams that do. Conversion rate optimization is one of these ideas.
V12.1 LPPORTAL.COM | V12.1 JANUARY-FEBRUARY 2013
MAGAZINE LOSS PREVENTION
MAGAZINE
THE VOICE OF LOSS PREVENTION
TRAFFIC COUNTING AND CONVERSION RATE
TRAFFIC COUNTING AND CONVERSION RATE
WHAT LP PROFESSIONALS NEED TO KNOW AND WHY
LPM 0113-A.indd 2
INTERVIEW WITH PUBLIX’S DENNIS WAMSLEY
LULULEMON'S CULTURE OF HONESTY AND INTEGRITY
MOBILITY AND CLOUD COMPUTING
1/28/13 3:27 PM
Store Traffic Is a Precious, Nonrenewable Resource
While declining store traffic continues to dominate the headlines and remains the reason most frequently cited for lackluster store performance, it’s only part of the story. If it’s true that store traffic has experienced a permanent and intractable decline, then what are brick-and-mortar retailers to do?
In the aftermath of the dot-com bubble in the early 2000s, online marketers realized they couldn’t merely focus on generating website traffic; rather they needed to focus on conversion—getting more visitors to buy. The same is true in brick-and-mortar retailing. As Jeff Gennette, CEO of Macy’s, stated in a Bloomberg interview, “The key will be for us to convert—we’ll get the traffic.”
Today many brick-and-mortar retailers track store traffic and measure conversion, but the question is what they actually do to optimize their in-store conversion rates. The answer for many is not much.
In the online world, conversion rate optimization (CRO) has become an industry onto itself, spawning a global community of consultants and service providers, formal methodologies, and over a hundred books dedicated to the topic of Amazon alone. There is only one book on brick-and-mortar conversion listed on Amazon. Given the difficult business conditions so many brick-and-mortar retailers are facing, it’s baffling that CRO hasn’t become more of a focus if not an obsession. Many factors may be preventing CRO from taking hold with brick-and-mortar retailers, but just like online marketers discovered after the dot-com bust, focusing on conversion can help them not only survive but even thrive despite traffic declines.
Tracking Conversion versus Optimizing Conversion
Most major tier-one retailers today track traffic and conversion rates in all their stores, so the basic data needed to conduct CRO already exists. For the retailers that misguidedly use sales transaction counts as a proxy for traffic—sorry. Beyond being a grossly inaccurate measure for store traffic, they don’t even possess the basic data needed to calculate conversion rates, so optimization is a non-starter.
But just because a retailer has the data, doesn’t mean they’re doing much with it or as much as they could be, and that’s where CRO comes in. CRO is defined as a system for increasing the percentage of visitors that convert into customers. The key word in this definition is “system.”
In the online world, conversion rates are influenced by a website’s page layout, colors, buttons, call-to-action, and checkout, among other factors. All these variables contribute to conversion, and CRO is the systematic process of tweaking and adjusting these factors in a way that leads to measurable and sustained improvements in conversion rate.
In physical stores, many variables impact conversion rates, including store layout, inventory levels, merchandising mix, promotional activity, and most importantly, the front-line associates and
managers who run the store and serve customers. And herein lies the challenge with CRO for brick-and-mortar retailers—variability. This variability in physical stores not only makes consistently applying conversion improvement initiatives across stores a challenge but also makes measuring results more challenging.
Furthermore, new in-store service features like “buy online, pick up in-store” (BOPIS) make calculating and interpreting conversion rates trickier. Think about it. When customers buy online and then pick up their orders in-store, store traffic increases, but conversion rates decrease since the sales transaction was already captured online and therefore not attributed to the traffic count captured when the customer visited the store to pick-up his or her order.
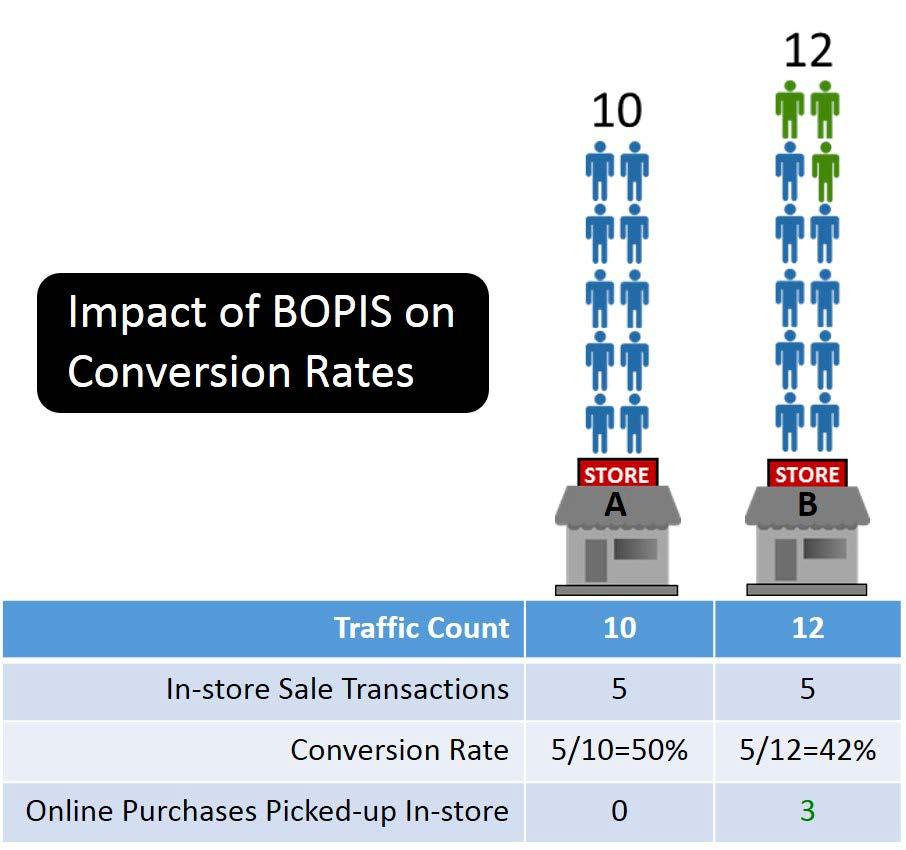
As the simple example in the illustration shows, BOPIS activity will generally cause conversion rates to decrease.
If we compare the conversion rate performance of two stores, one with and one without a BOPIS program, we can see how conversion rates can be impacted.
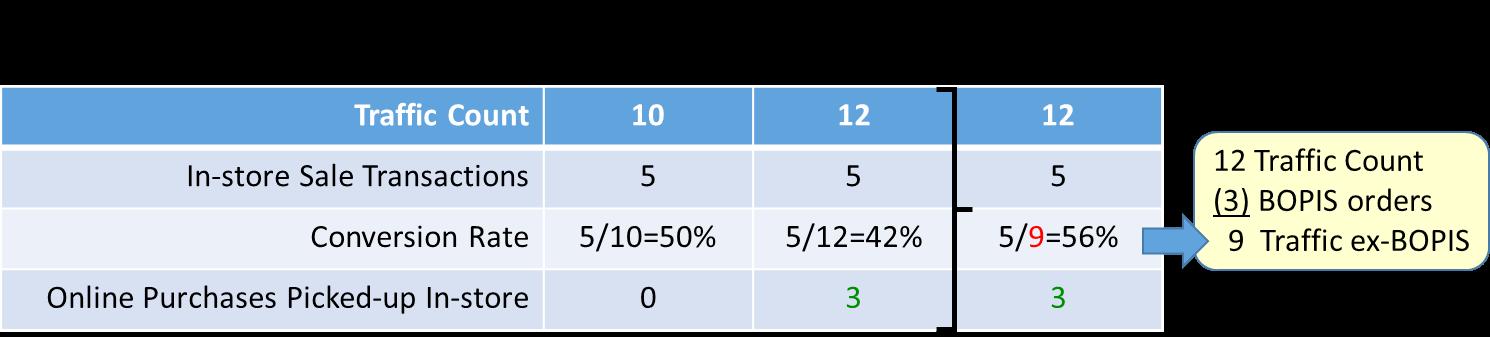
In store A, where there is no BOPIS program, calculating conversion is straightforward. This store received ten visitors and completed five sales transactions resulting in a 50 percent conversion rate. Store B received twelve visitors and also completed five sales transactions resulting in a 42 percent conversion rate. However, three of the visitors came to pick up their online purchase.
Metrics, such as attach rate, can also be tracked to put appropriate attention on fully maximizing all traffic counts to drive overall performance. While it is possible that these three BOPIS visitors may make other purchases while in-store, it’s reasonable to calculate conversion based on a traffic count excluding these visits to more fairly represent true in-store conversion performance.
Initiatives like BOPIS will impact conversion rates; however, they are not necessarily impediments to undertaking a CRO program. That said, extra care does need to be applied to account for how these initiatives are impacting conversion rates prior to initiating a CRO program. The important point is to be consistent in how you calculate conversion rates and then apply CRO initiatives, measuring performance against relative trends.
Testing and Measurement to Prove Results
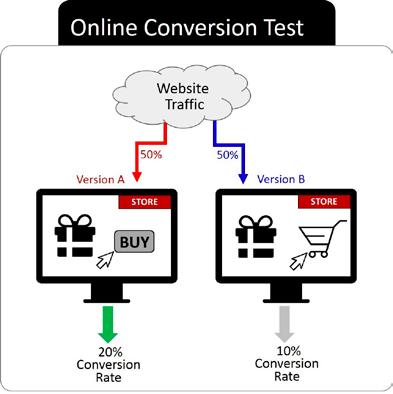
A vital tenant of CRO is testing and more specifically A/B testing. In the online world, this is easily accomplished by setting up two variations of a webpage and then directing an equal amount of traffic to each site. Conversion results of website A are compared to website B, and the winner is declared.
But A/B testing is much more difficult for brick-and-mortar retailers since, unlike websites, every store is unique. Store layouts, inventory levels, geographic location (including proximity
to competitors and demographics of shoppers in the trading area), weather conditions, microeconomic factors, and variations in the skill, experience, and effort of the store staff—all create variability that make comparisons challenging.
So unlike online conversion rate optimization where changes can easily be made and consistently applied with a few keystrokes, in brick-and-mortar stores adjusting variables like staff levels, for example, must be applied at the store level.
There’s another important difference between online and brick-and-mortar conversion optimization tests—traffic. In an online experiment, traffic can be precisely controlled so that each website version receives the same amount of traffic.
In brick-and-mortar stores, the amount of traffic each store receives can’t be controlled and can vary significantly by store. Since conversion rates tend to be inversely related to traffic (in other words, when traffic goes up, conversion rates tend to decline), extra care needs to be applied when interpreting brick-and-mortar conversion optimization test results.
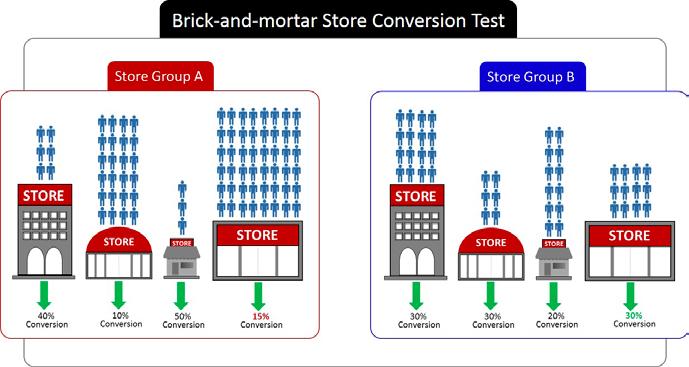
But just because the conversion variables are harder to control in physical stores doesn’t mean that conversion rates can’t be optimized or measured using A/B testing. Here’s an example to illustrate.
The Test: Simplified Reporting and Conversion Coaching. The challenge store personnel have with improving conversion rates is twofold: first, they often can’t easily see where the conversion opportunities are being missed; and second, they struggle with how to adjust behaviors in-store to improve conversion. A series of A/B experiments were conducted with a group of 600 brick-and-mortar stores across four different retail segments.
The hypothesis for the study was simple: store managers who can easily spot conversion opportunities and are encouraged to act on this information will outperform store managers who don’t.
In each experiment, a sample set of stores was identified and clustered into A and B groups. The group A store managers received a simplified daily conversion scorecard indicating where conversion rate sags were occurring along with series of brief conversion coaching sessions conducted by phone to discuss the conversion patterns and behaviors they should consider undertaking to improve conversion rates. Group B store managers did not receive the simplified reporting or coaching.
The Result. Group A stores consistently outperformed group B stores. You can read more about the findings at headcount.com/ROIstudy.
Start with the Biggest Conversion Driver—People
While there are many variables that impact in-store conversion rates, staff scheduling and deployment are at the top of the list since front-line associates and managers play a critical role in converting store traffic into customers. An effective CRO system for brick-and-mortar retailers must begin with ensuring staff schedules are aligned to store traffic patterns. But aligning staff schedules to traffic is only the first step.
Second, retailers need to examine how staff are deployed—tasking versus
servicing customers. Aligning staff schedules to traffic will not improve conversion rates if staff are focused on tasking instead of serving customers.
Third, retailers need to measure associate and manager productivity by analyzing conversion rates by hour attributed to each employee. This will enable retailers to identify top performers, create benchmarks, and identify employees who may require additional coaching or training.
Conversion Rate Optimization Can Mitigate Traffic Declines
In today’s rapidly changing and difficult environment, brick-and-mortar retailers can ill afford to squander the sales opportunities that they do have. Stemming the tide of store traffic declines may be difficult if not impossible for retailers to do, but that doesn’t prevent them from focusing on the traffic opportunities they do have and applying CRO strategies.
Conversion rate optimization is not a panacea, but it can go a long way in helping brick-and-mortar retailers deliver better business results, despite the traffic declines.
And just like the online survivors of the dot-com bust, brick-and-mortar retailers need to realize that it’s not just about the amount of traffic in their stores but what they do with the traffic that matters most.
LP’s Role in Traffic, Conversion, and CRO
Many retailers today are struggling with systemic declines in store traffic, negative same-store sales, and excruciating pressure on the bottom line. These challenging business conditions mean that capital budgets are tight and operating expenses are being cut. If a retailer doesn’t already have a traffic-counting system, many simply can’t stomach the investment to implement one regardless of how critical having one is. But without traffic data, there can be no conversion rate optimization.
Since many LP systems today can be enabled to count traffic, this may be the most practical and cost-effective way for the organization to get the vital insights it needs during these difficult times. Bringing a traffic-counting capability to the organization is an important way LP professionals can contribute to its success.
If your organization already has a reliable traffic-counting system, then LP professionals can help by bringing ideas like CRO to others in the organization.
MARK RYSKI is author of Conversion: The Last Great Retail Metric and When Retail Customers Count. He is also founder and CEO of HeadCount Corporation (headcount.com). Ryski can be reached at 877-463-7004 extension 222 or via email at mark.ryski@headcount.com.